On June 7, Bitcoin (BTC) broke down from a symmetrical triangle that had been in place since May 19.
It’s likely in the process of completing the fifth and final wave of a bearish impulse that could take it below $30,000.
BTC Breaks Down
BTC had been trading inside a symmetrical triangle since May 19. After consolidating for nearly a month, it finally broke down from the pattern on June 7.
So far, BTC has reached a low of $32,351.
The closest support area is near $27,000, created by the 0.618 Fib retracement support level.

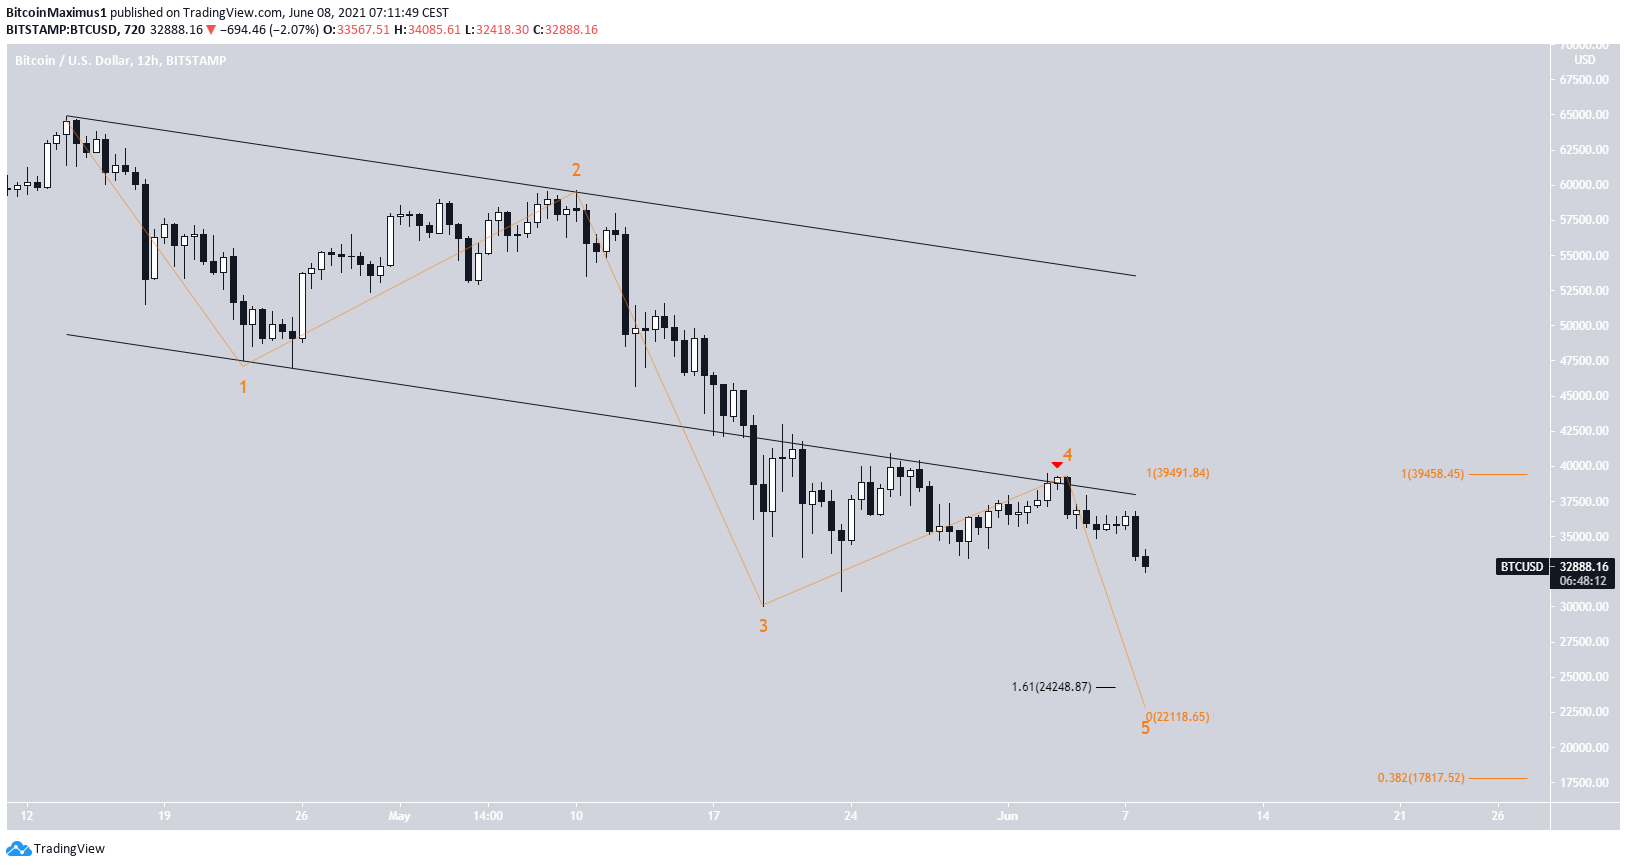
Wave Count
The wave count suggests that the drop is part of the fifth and final wave of a bearish impulse that began with the April 14 all-time high (orange).
This is evident by the rejection from the previous support line of a descending parallel channel (red icon).
The most likely area for the bottom of the movement is between $24,200 and $22,100. This range is found by using an external Fib retracement on wave four (black) and projecting the length of wave 1 (orange).
While an extension could take BTC as low as $17,000, it’s still too early to determine if the current decrease will extend.
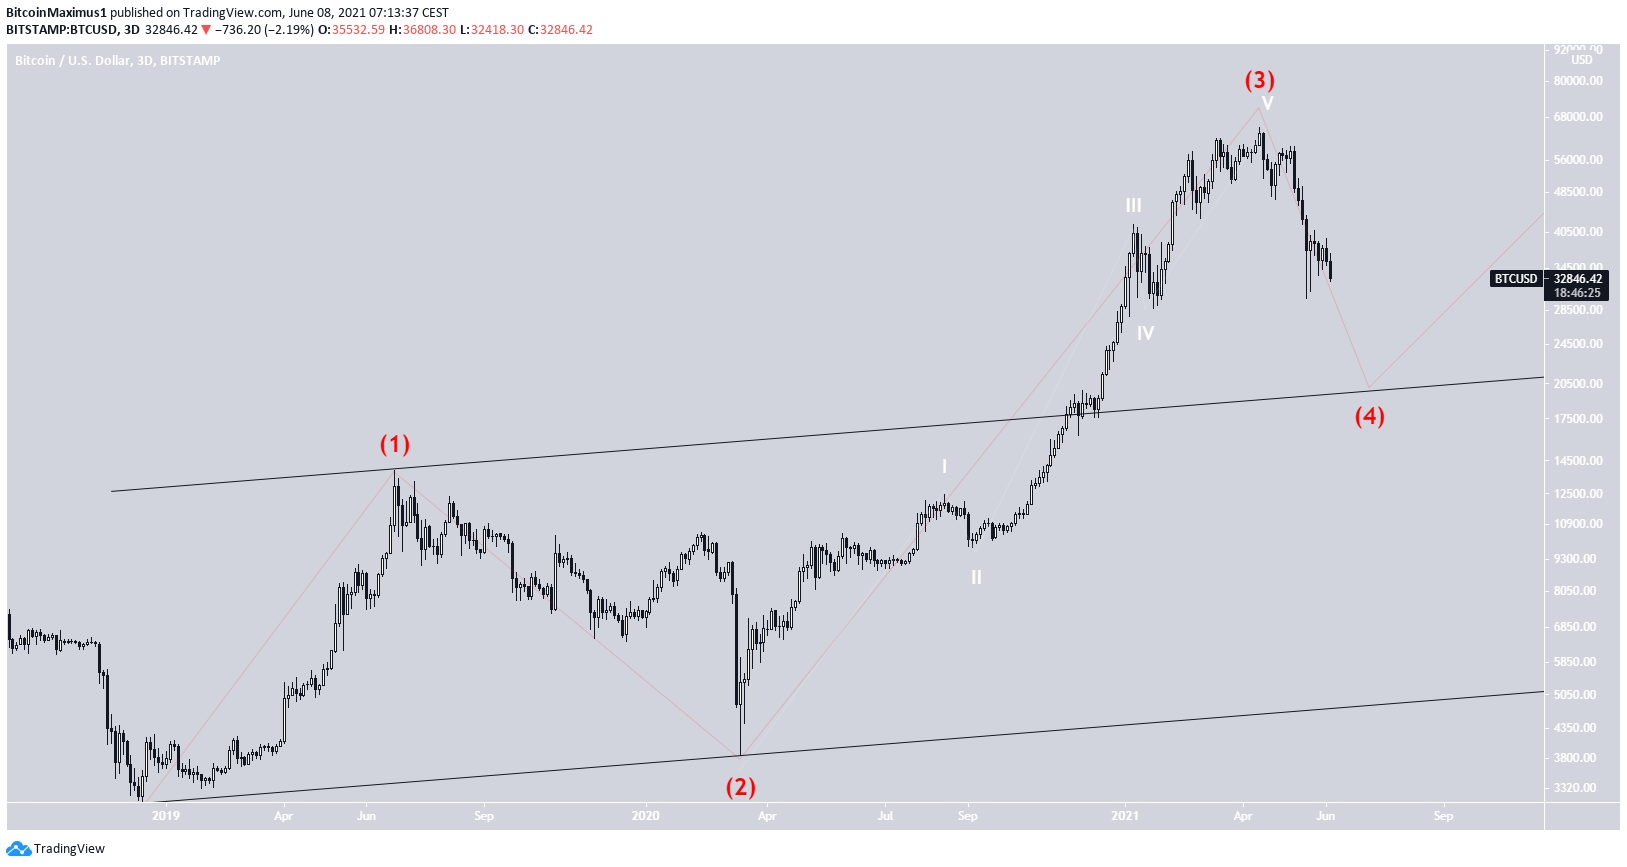
In the long term, the drop appears to be part of wave four (red) of a bullish impulse that began in December 2018.
The proposed decrease would complete a fourth wave pullback before another upward move that would complete the entire bullish cycle.
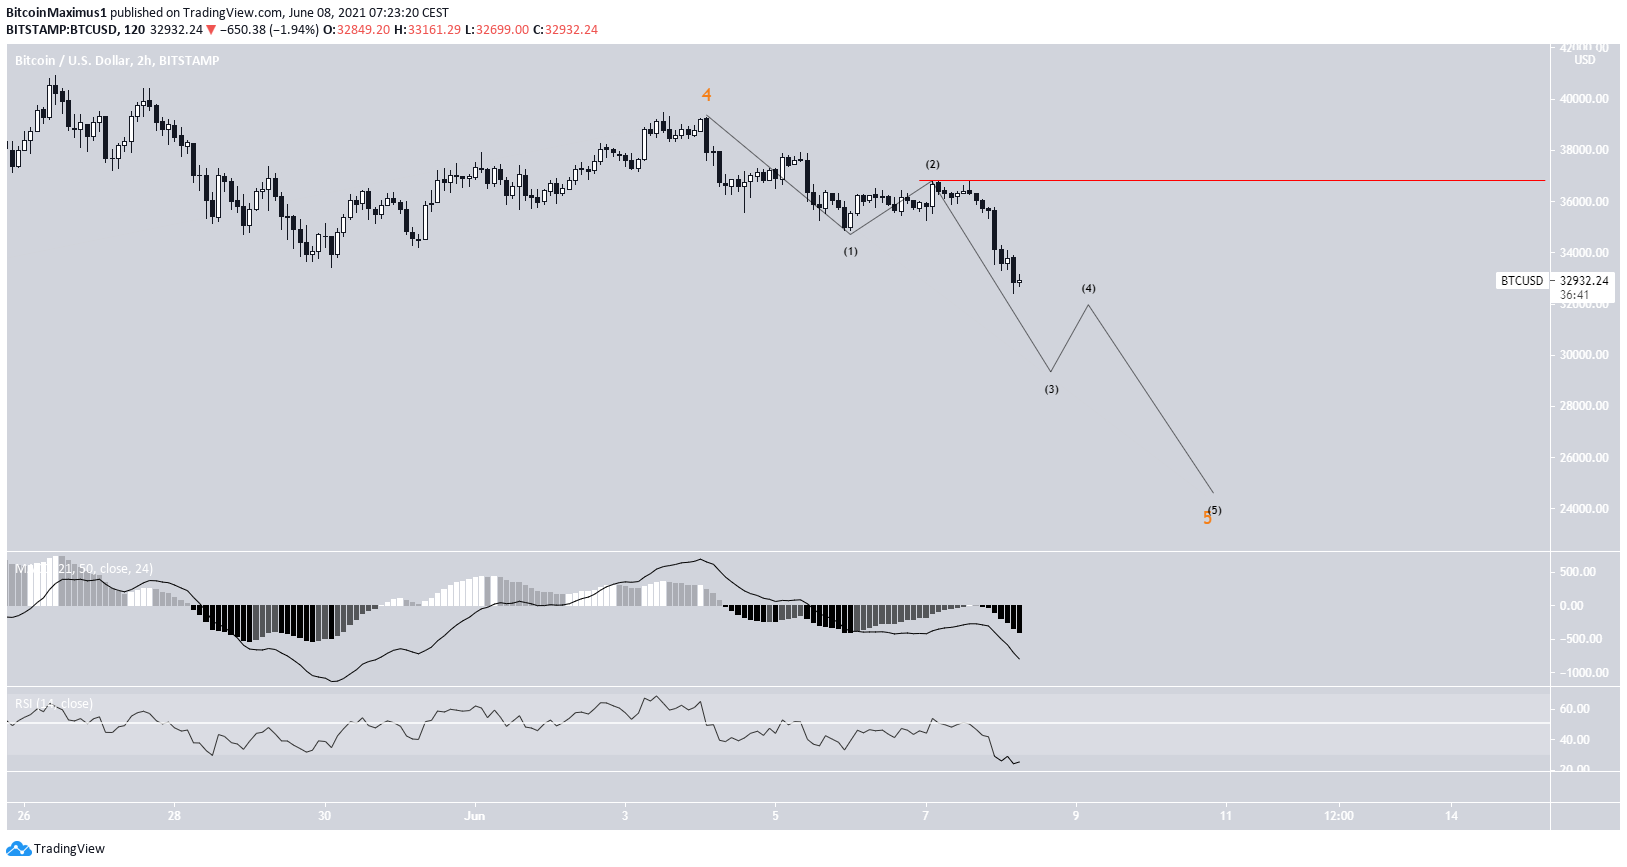
Future movement
In the two-hour chart, the sub-wave count is shown in black. It outlines a potential path for the BTC price.
An increase above the sub-wave two high at $36,811 (red line) would invalidate this wave count.
Technical indicators do not yet show any signs of strength, supporting the possibility that BTC continues decreasing.