The bitcoin (BTC) price temporarily stalled the ongoing correction with a bounce at a long-term Fib retracement support level.
While long-term indicators are still bearish, short-term signals suggest a bounce will occur.
BTC completes weak weekly close
Last week, BTC stymied its downward trend. It created a small bullish candlestick with a bullish close. The bounce occurred right at the 0.5 Fib retracement support level at $34,350.
However, technical indicators are bearish. The MACD has given a bearish reversal signal, the RSI has fallen below 50, and the Stochastic oscillator has made a bearish cross (red icons).
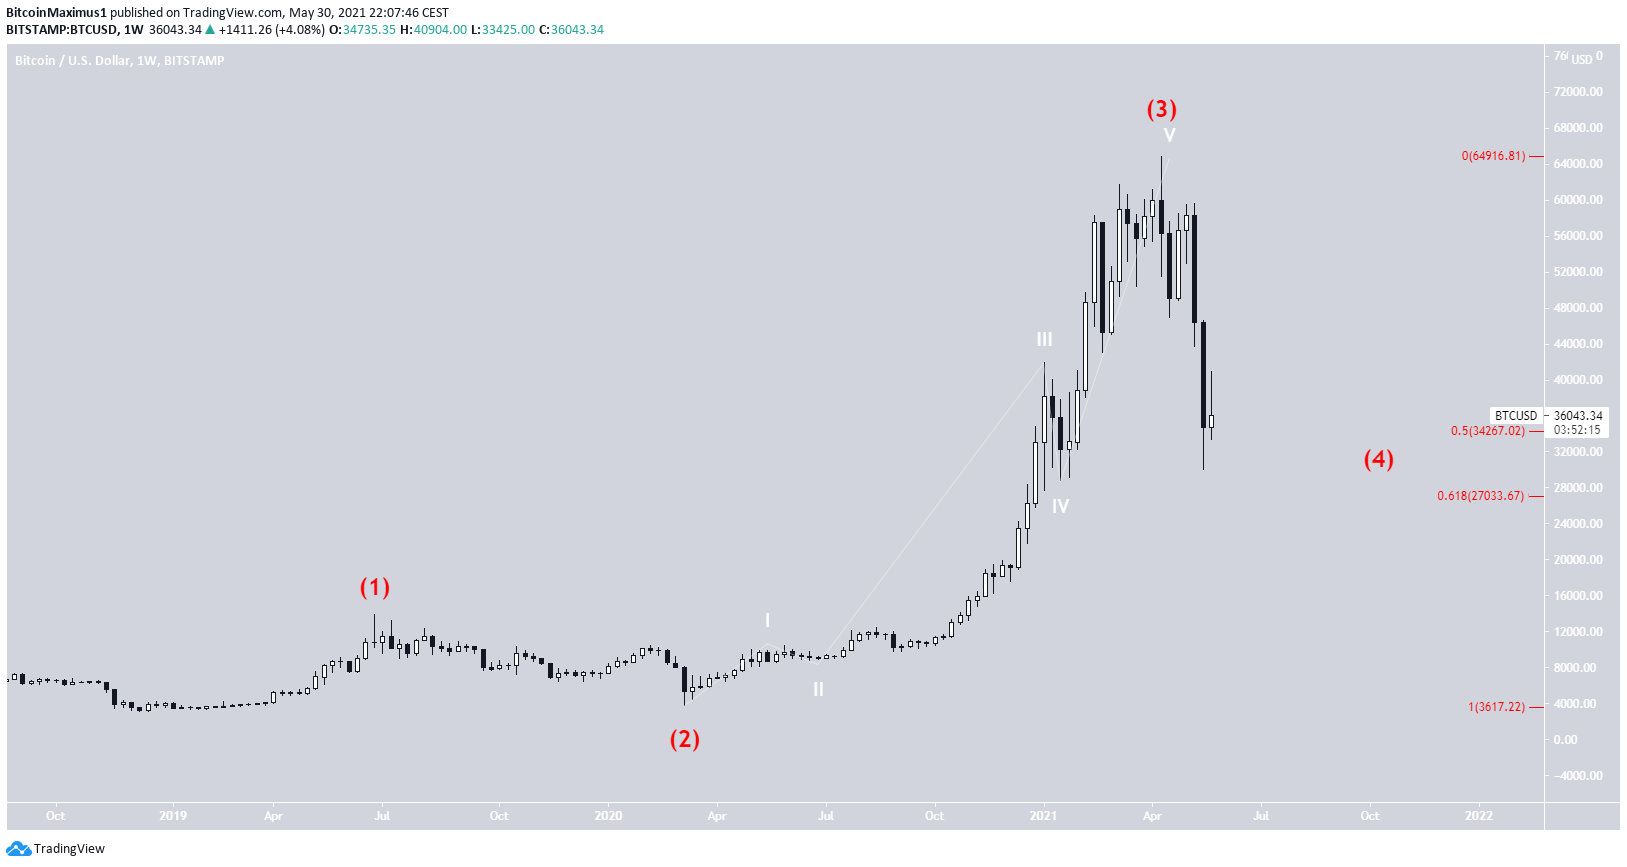
The most recent time all three of these occurred was in September 2019. Therefore, it’s possible that the current movement is similar to that of September 2019. Another similarity between these two movements is the bounce between the 0.5-0.618 Fib retracement support levels, further strengthening the comparison
Due to the sharpness of the correction, a type of bounce would be expected, at least in the short term.
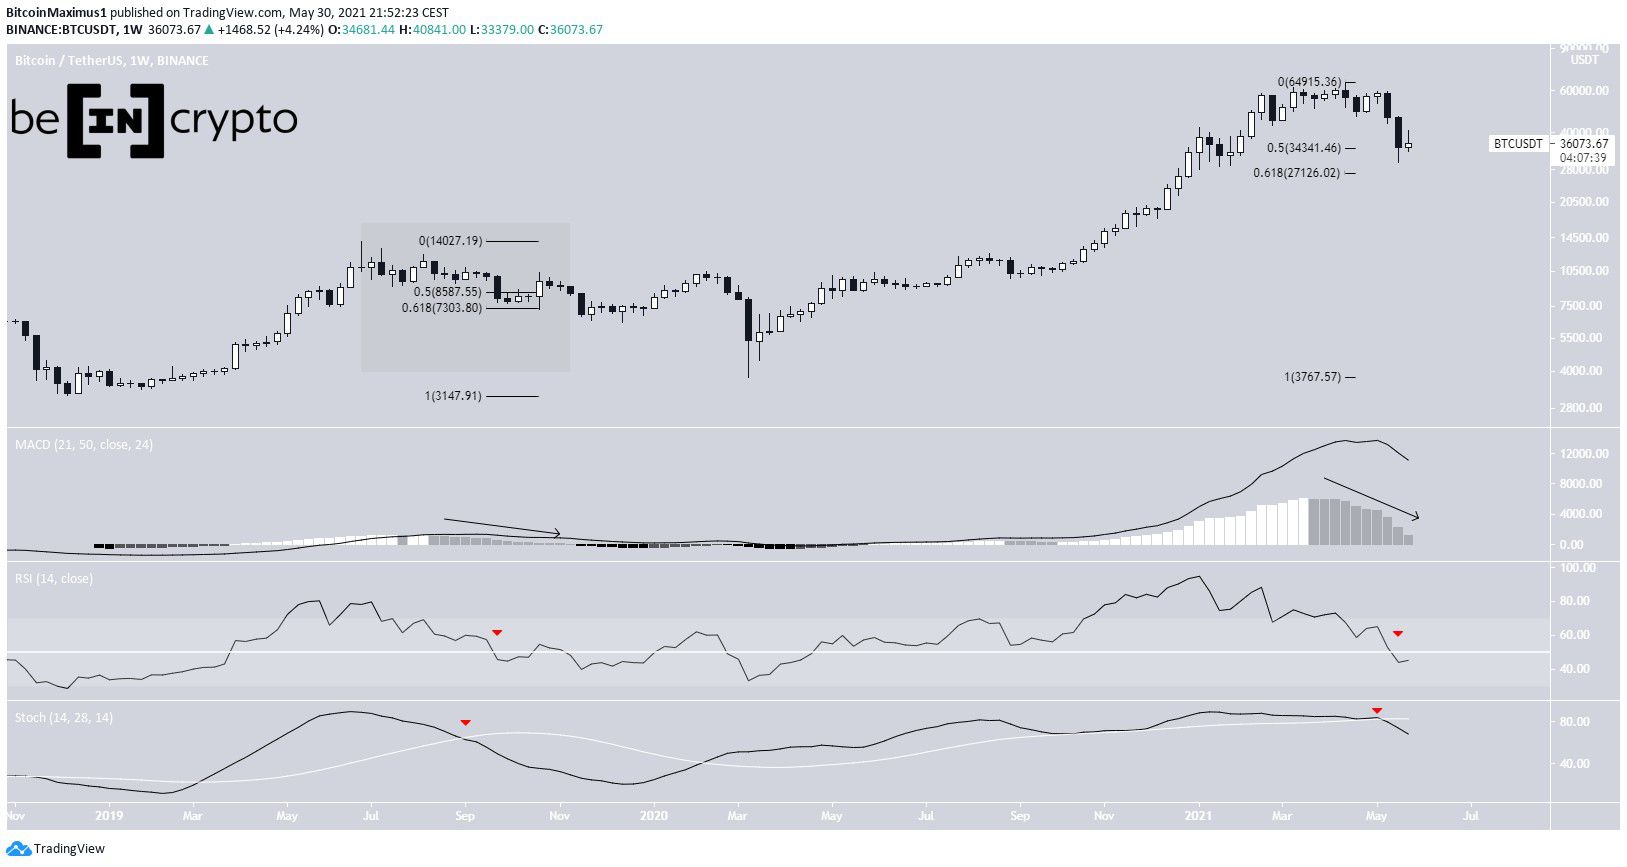
At the time, BTC was in wave two (red), which is oftentimes corrective. Therefore, it would make sense that BTC is currently in wave four, which is also normally corrective.
Daily indicators turn bullish
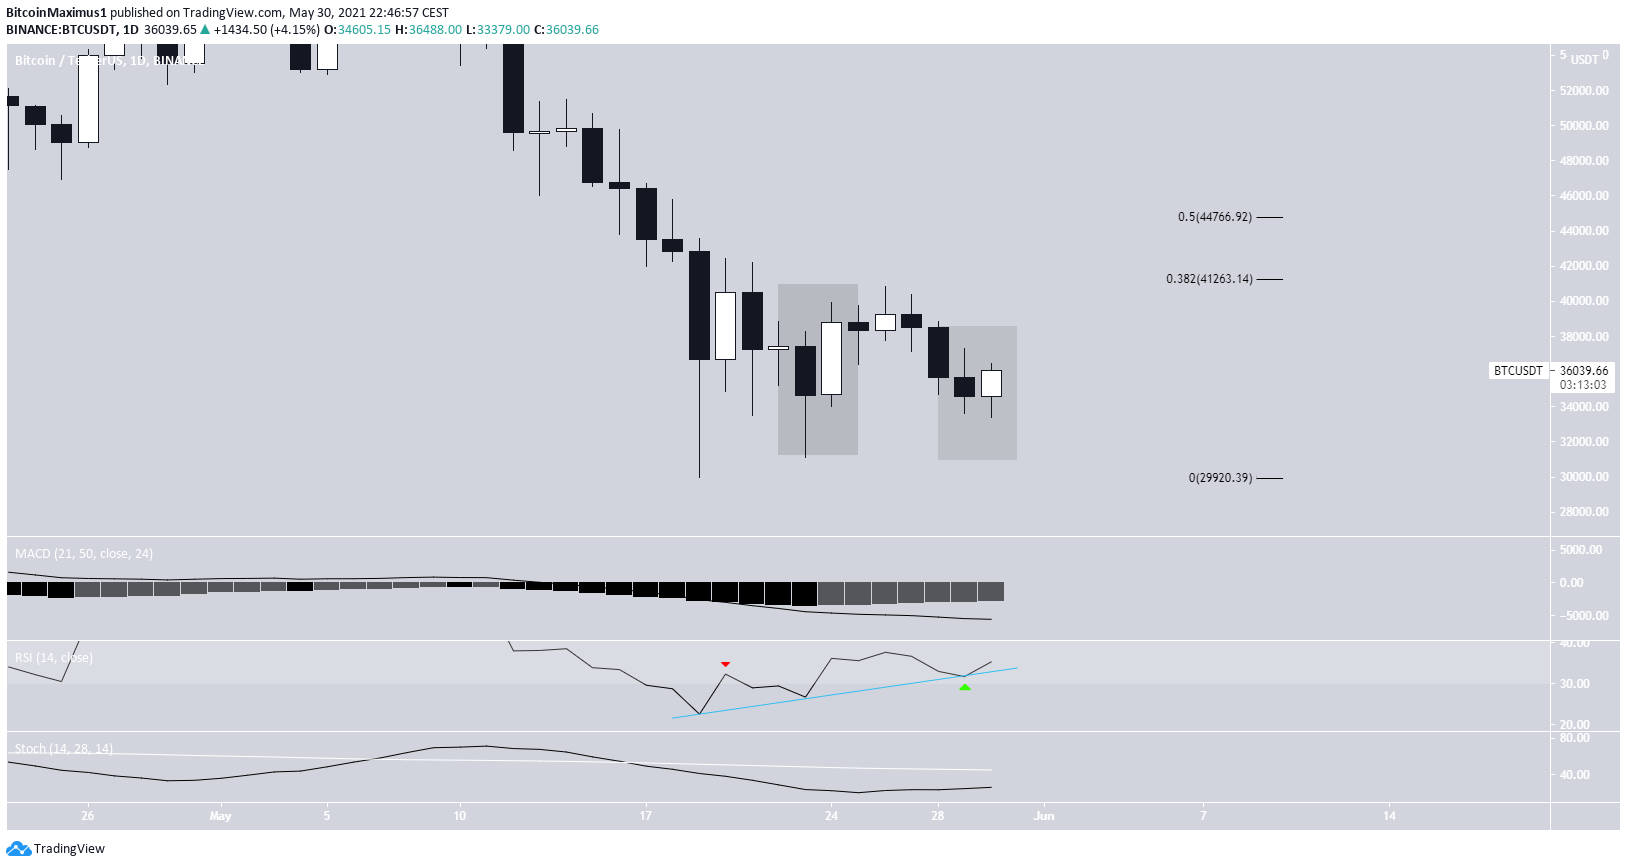
Unlike the weekly chart, the daily time frame provides mostly bullish readings.
The RSI has generated triple bullish divergences and has completed a failure swing bottom. In addition to this, the MACD has given a bullish reversal signal. Finally, the Stochastic oscillator is moving upwards, though it has yet to make a bullish cross.
The 0.382 and 0.5 Fib retracement levels provide resistance. They are found at $41,260 and $44,760 respectively.
Therefore, unlike the weekly time frame, indicators on the daily chart are decisively bullish.
Future movement
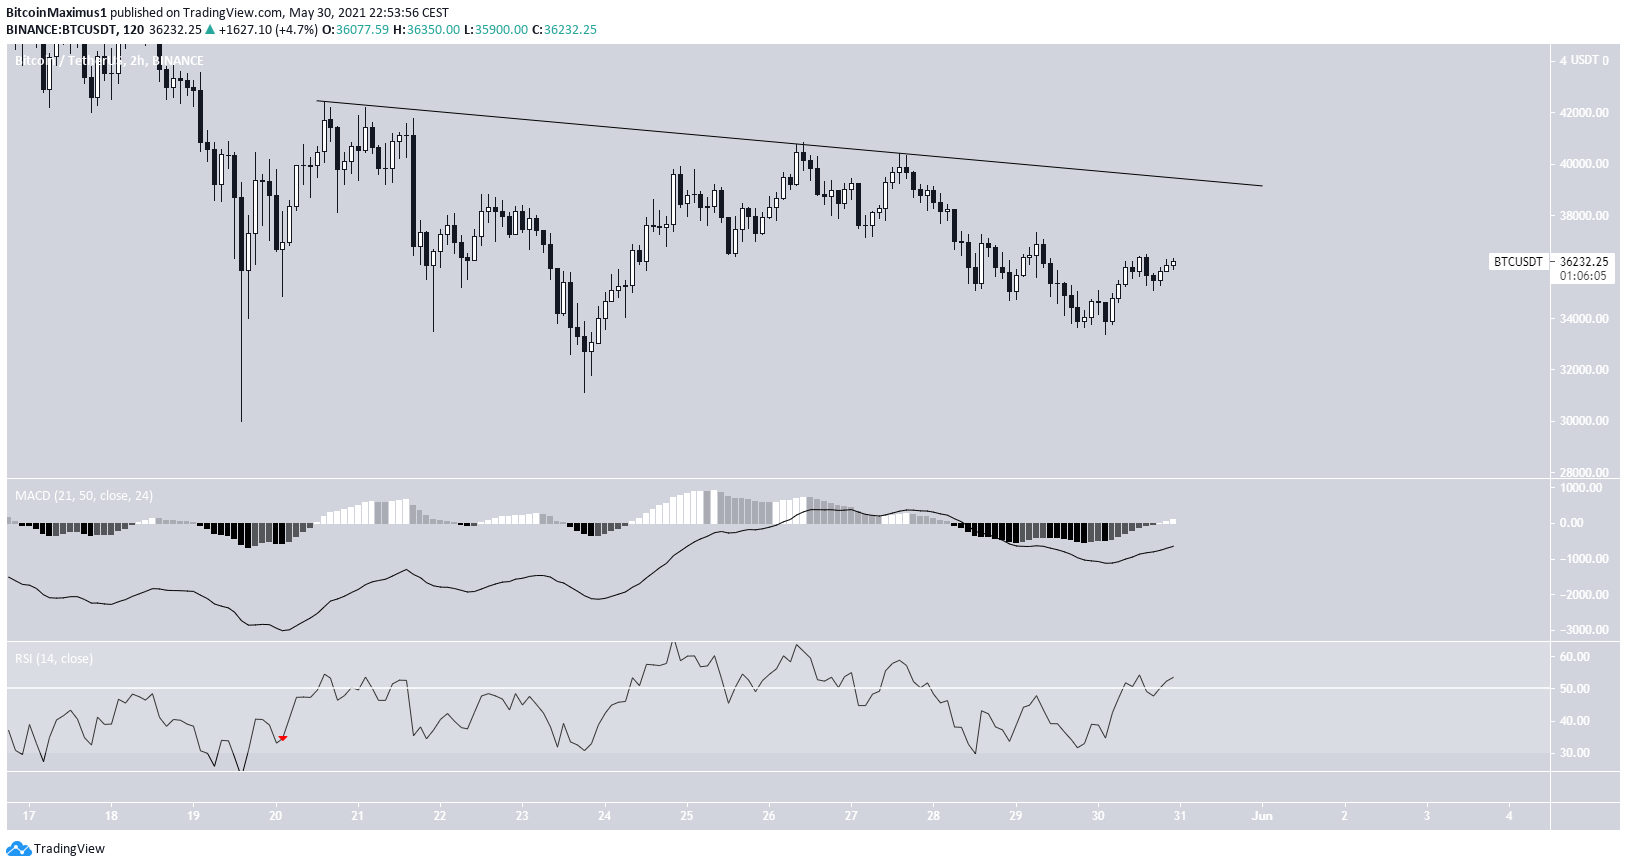
The short-term chart shows a descending resistance line that has been in place since May 20. It’s currently at $39,000. Furthermore, there is a potential ascending support line in place. Together, they create a symmetrical triangle, which is considered a neutral pattern.
This further adds to the confusion since it shows a neutral reading, aligning with neither the daily nor weekly time-frames.
Therefore, a breakout or breakdown from this pattern is required in order to determine the direction of the trend.