Bitcoin’s Christmas rally seems to have come to an end as the prices collapsed below the $4000 line and reached as low as $3700. At the time of writing, the market cap is at $67 billion with 24-hour trading volume at $6.1 billion.
1 Hour
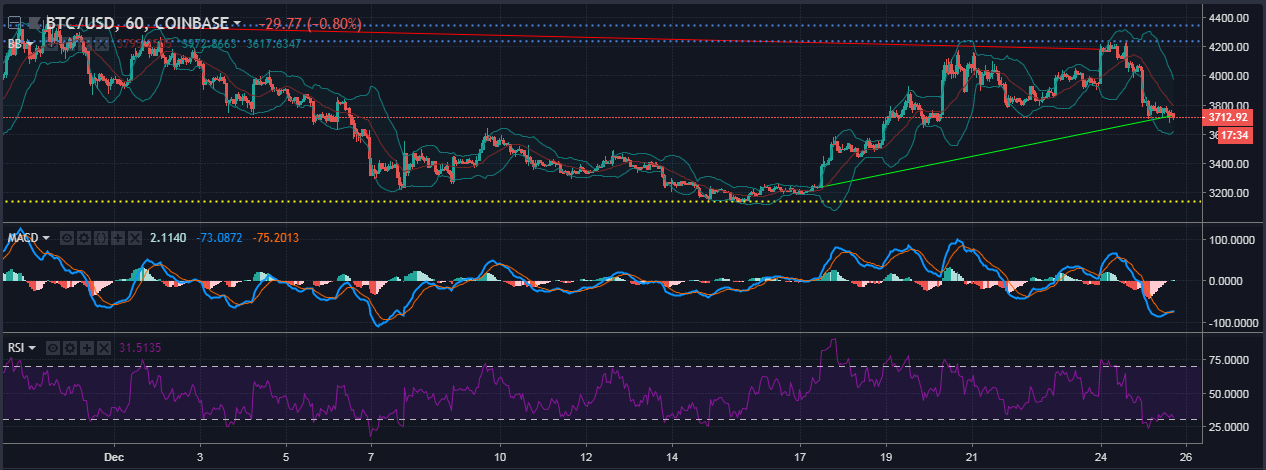
Source: TradingView
The uptrend for Bitcoin extends from $3238 to $ 3726 which is less as compared to the rally previously made. The downtrend, however, remains the same and extends from $4350 to $4183. The prices for Bitcoin, which had moved away from the support at $3139 are now moving back towards it. The resistance points are set up at $4237, $4345.
The Bollinger Bands are seen closing in on the prices as the volatility in the market is reducing. The prices have dropped below the simple moving average, which indicates a bearish trend for Bitcoin.
The MACD indicator has collapsed below the zero-line after a brief period of enjoyment over it. The lines are close to each other and might be signaling a possible bullish crossover.
The Relative Strenght Index has collapsed below the oversold zone and is trying to climb back up.
1 Day
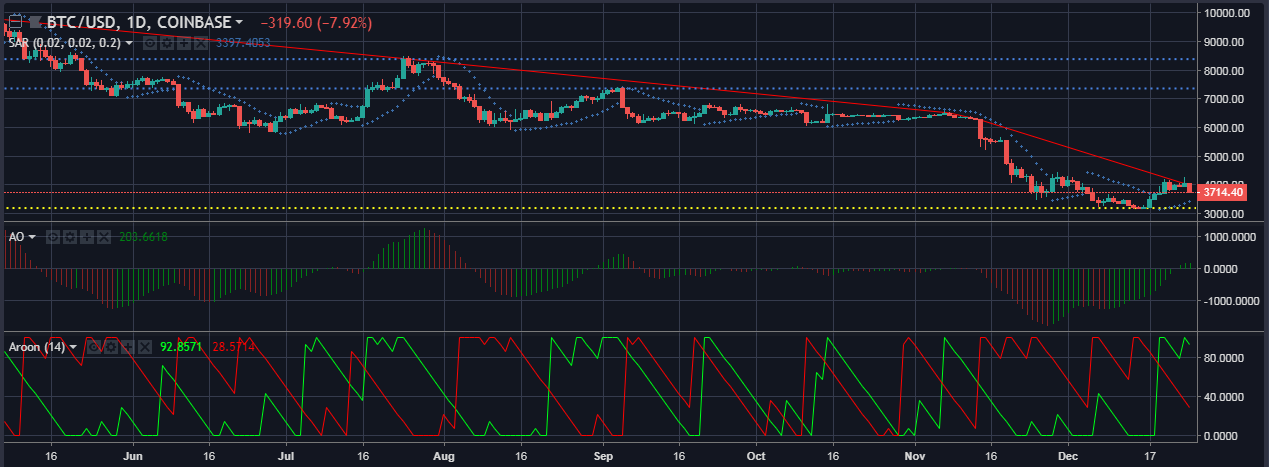
Source: TradingView
The uptrend is not yet a trend that can be expected in the longer time frames. The downtrend, however, can be seen hanging at $9800 to $4035. The prices are supported at $3183, with resistance lines present at $7359, $8385.
The Parabolic SAR markers are formed below the prices candles which indicates a bullish trend for Bitcoin. However, the prices are indicating a drop in the market.
The Awesome Oscillator shows a bullish presence as well with the green bars transitioning from below the bar to over the zero-line.
The Aroon indicator also shows a bullish move for Bitcoin prices as the Aroon green line has hit the 100-line indicating that the uptrend has gained momentum.
Conclusion
The one-hour chart for Bitcoin shows a very grim phase as the Christmas rally looks like it has come to an end, which is indicated by the indicators Bollinger Bands, MACD, and the RSI. The one-hour chart shows quite a bullish trend for Bitcoin as compared to the one-hour chart which is indicated by the Parabolic SAR, Awesome Oscillator, and the Aroon indicator.