Key highlights:
- Bitcoin is up 2.5% today as the bulls try to reclaim the $30,000 level
- The number one ranked cryptocurrency continues to trade inside the established range between $31,000 and $28,650 (June 2021 low) this week
- A new short-term triangle has formed as we head into the weekend
| Bitcoin price | $29,800 |
|---|---|
| Key BTC resistance levels | $30,500, $31,000 $31,650, $32,000, $32,270 |
| Key BTC support levels | $30,000, $29,350, $29,000, $28,650, $28,226 |
*Price at the time of publication
Bitcoin holders are still on the edge of their seats as they wait for signals that will dictate how the current phase of short-term consolidation will play out. As most of you know, the market took a tumble last week as the number one ranked cryptocurrency fell from above $36,000 to reach as low as $25,485 during the capitulation.
Since then, the buyers have regrouped and have formed a short-term trading range between $31,000 and $28,650 (June 2021 lows). During the week, the market did break beneath a short-term triangle pattern (4hr charts), but the buyers defended the June 2021 lows, allowing the market to rebound above $30,000.
A new triangle has formed on the 4hour charts and will be the next pattern to watch moving into the weekend (see analysis below).
While traders wait for the market to provide an indication of where it would like to head next, the fundamentals continue to remain equally uncertain. With the Fed expected to continue to raise interest rates, and the ongoing fear that the Terra ecosystem collapse caused, it feels like the entire market sentiment is in a dark place.
It seems that whales are continuing to dominate the heavy volatility right now. According to the Exchange Whale Ratio, an indicator that measures the ratio between the sum of the top ten BTC transactions to exchanges against total exchange inflows, it seems that whales continue to dominate the inflows to exchanges.
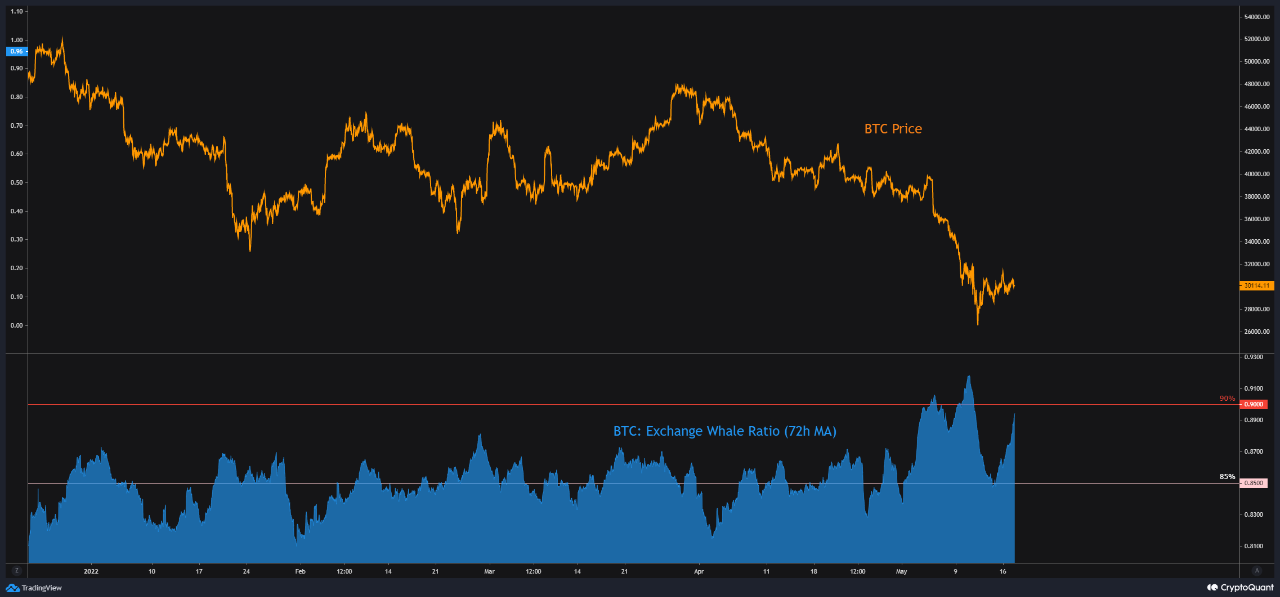
Typically, a value above 85% means that whales currently make up a large part of the overall exchange inflows. But, as you can see, today’s value is touching the 90% mark - indicating that retail investors are at the whim of the whales right now.
Interestingly, the Bitcoin Accumulation Trend Score from Glassnode suggests that there is still some strong buy-side activity taking place. Last week, when the market collapsed beneath $25,000, the Accumulation Trend Score saw a sharp reversal in which it went from weak values beneath 0.3 to climb back toward 0.796.
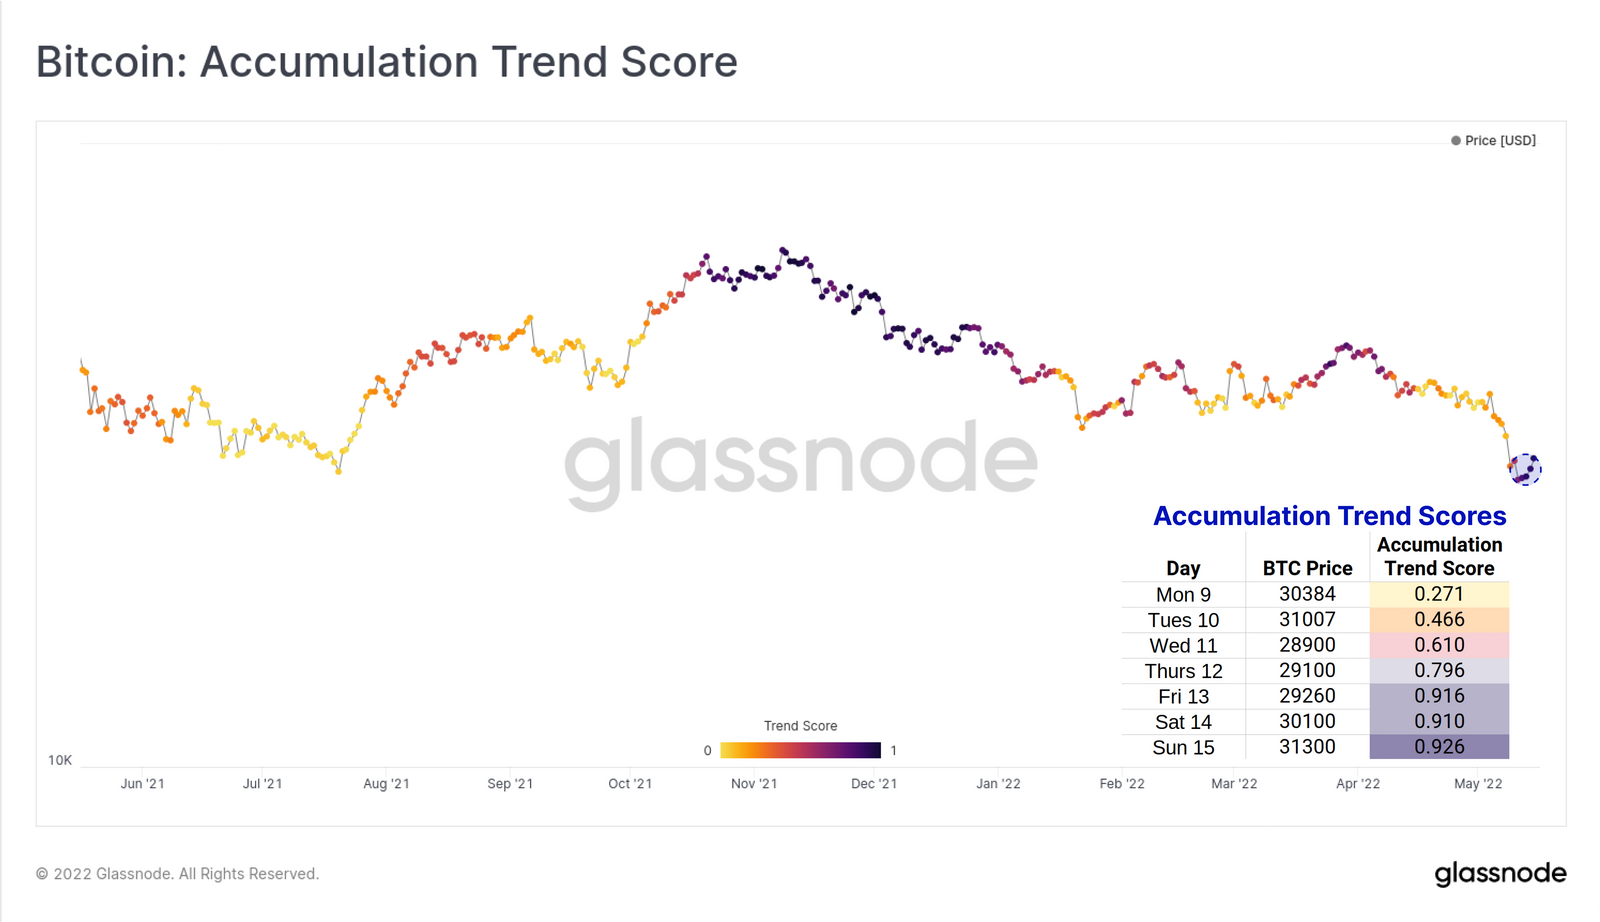
When a large proportion of the market is adding to their on-chain balances, the Accumulation Trend Score tends to head back toward 1. This rise in accumulation was the main reason why Bitcoin managed to reclaim $30,000 this week.
Digging deeper, it seems that smaller holders with less than 1 BTC in their wallets were by far the biggest accumulators in the drop
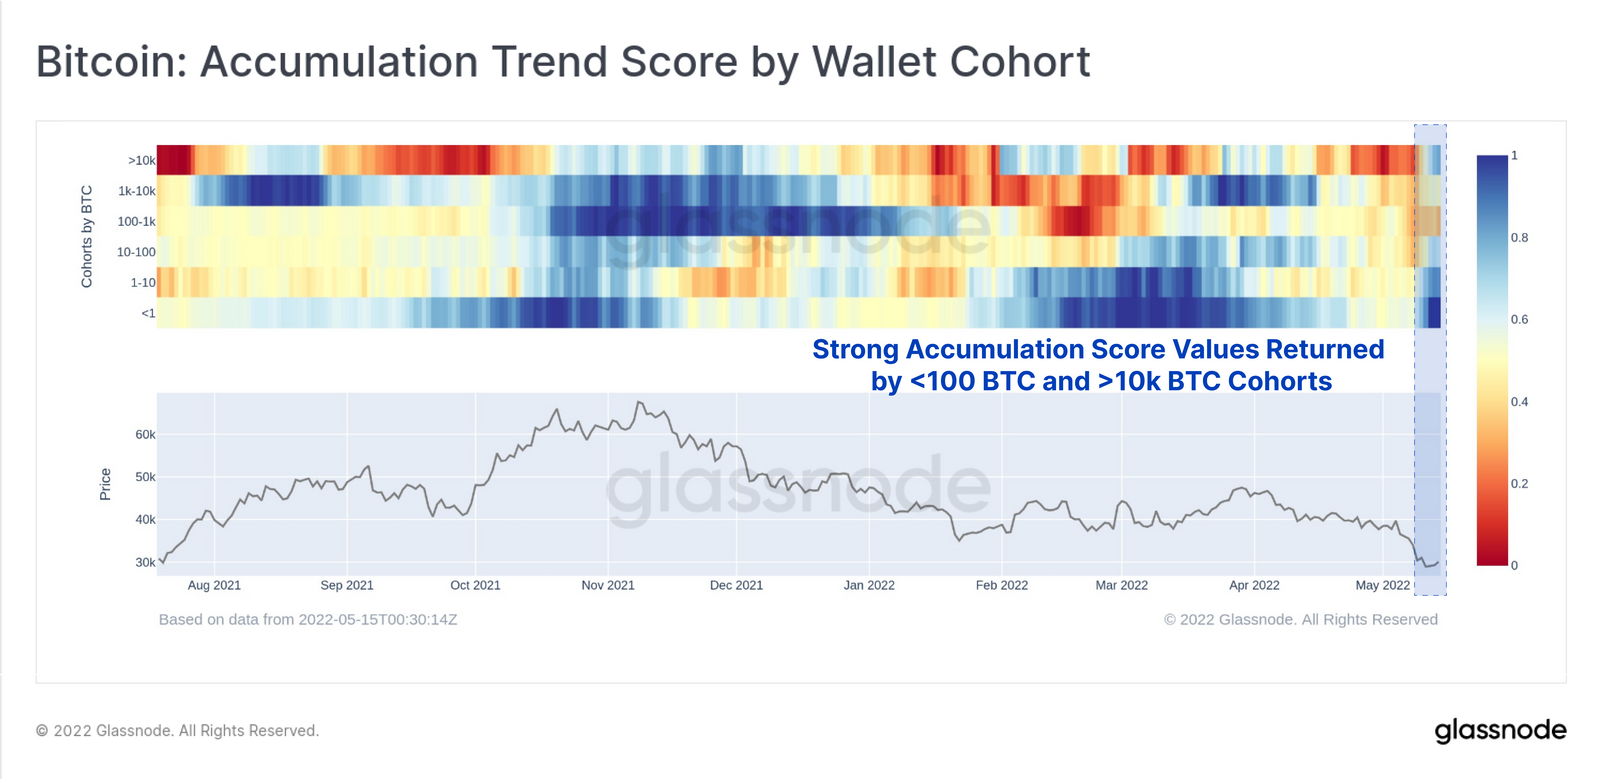
Slightly larger holders helped these small holders with between 1 to 10 BTC in their wallets. The fact that the smaller holders feel comfortable adding to their holdings is a strong bullish signal as they expect that the market dumps might not continue for much longer.
With the market still sitting in uncertain conditions, let us continue to look at where the support is ahead.
Bitcoin price analysis
Daily chart
4-hour chart
What has been going on?
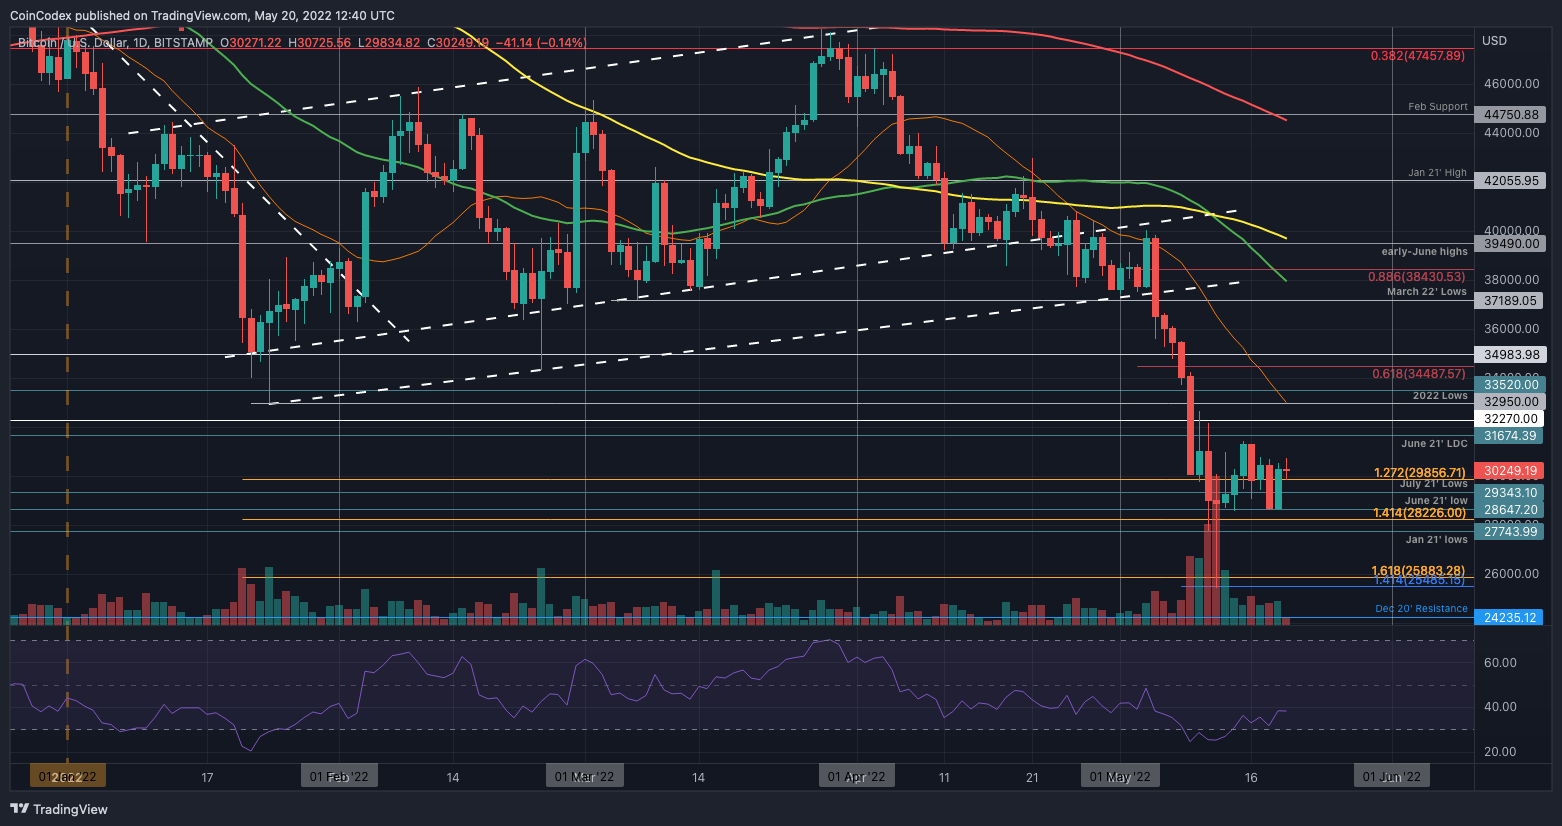
Looking at the daily chart above, we can see that the June 2021 low at $28,650 has been extremely important in preventing further declines this week. However, it is also important to note that Wednesday’s closing candle was lower than the 2022 low-day closing candle, which could be considered a bearish factor moving forward.
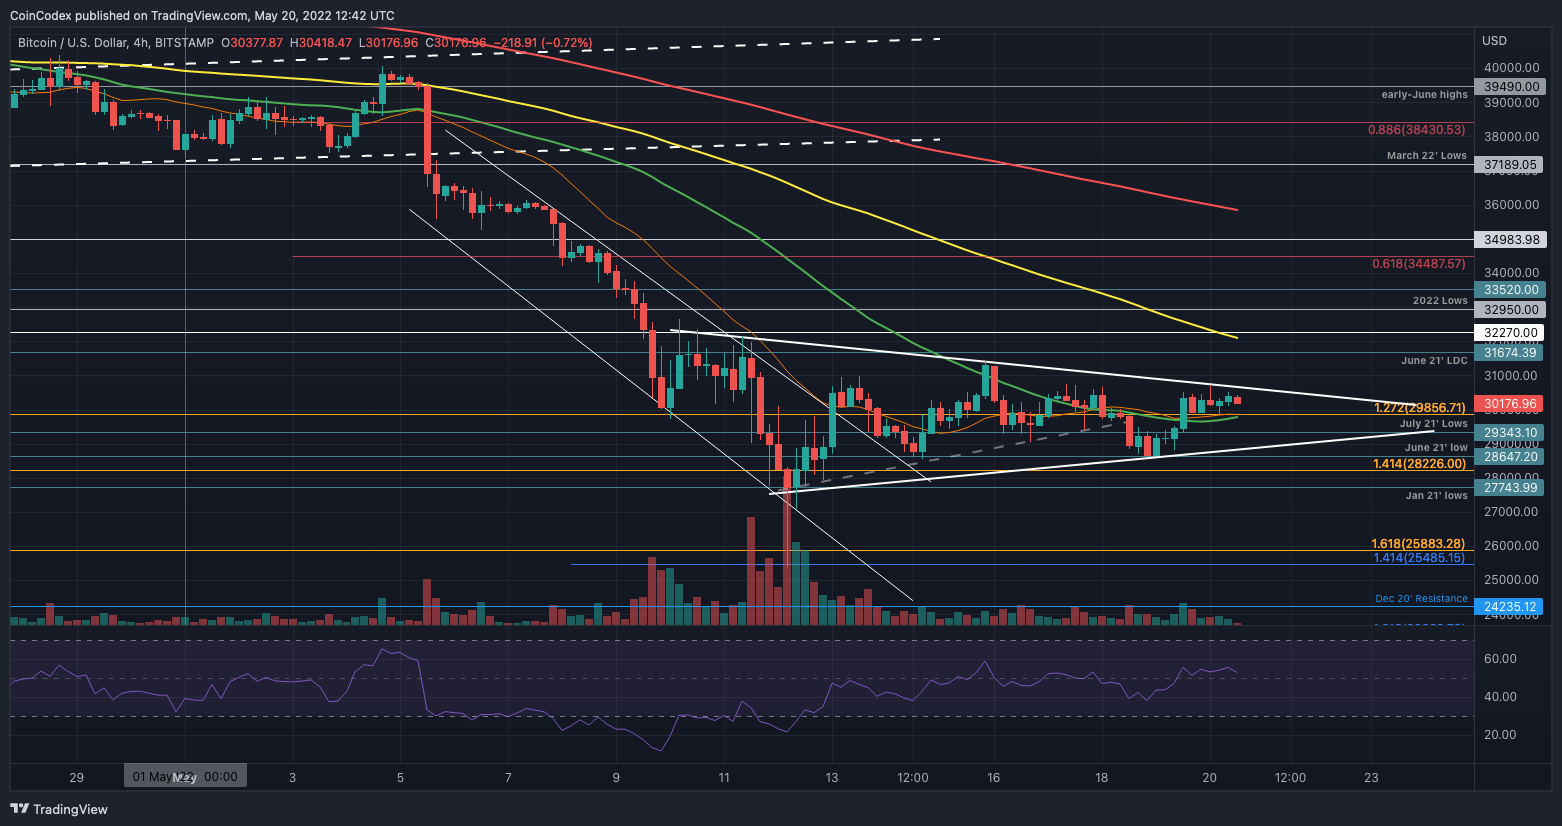
Looking at the 4-hour chart, we can see that the market broke the previous triangle (dashed line) but has now formed a slightly longer termed triangle. After breaking beneath the previous triangle, BTC/USD fell into the June 2021 lows but has since rebounded from this level, allowing BTC to maintain itself above $30,000.
Bitcoin price short-term prediction: Bearish
Bitcoin continues to remain bearish in the short term. BTC would need to break and close beneath the January 2021 lows for the bearish pressure to continue further. To be considered neutral again, the coin would need to break back above $35,000 - strong January 2022 support. To be considered bullish, it would have to continue above the May highs at $40,000.
Toward the upside, resistance is first located at the upper angle of the current triangle. This is followed by resistance at $31,000. Additional resistance lies at the June 2021 LDC of $31,650, $32,000 (100-day MA), $32,950, $33,000, $33,520, $34,000, $35,000, and $36,000.
Where is the support beneath $30,000?
On the other side, the first support now lies at $29,850 (50-day MA). This is followed by support at $29,350 (July 2021 lows), $29,000, and $28,650 (June 2021 lows & lower angle of triangle). If the sellers break beneath the triangle, additional support ies expected at $28,225 (downside 1.414 Fib Extension), $28,000, and $27,750 (Jan 2021 lows).
Beneath the January 2021 lows, support is expected at $27,000, $25,885, $25,485 (last week’s low), and $25,000.
So, where are we heading next?
Although the previous short-term triangle broke to the downside, the new triangle provides a little more hope. However, symmetrical triangles typically break in the direction of the previous trend which, in this case, would be bearish.
We would need to wait for a breakout of the current triangle for the market to provide an indication about where it would like to head next. If the current triangle does break, the June 2021 lows and the January 2021 lows would be the next critical support to defend.
Keep up-to-date with the latest Bitcoin Price Predictions on CoinCodex.