- Bitcoin price action shows a confluence that the crash is likely to bottom at $19,500.
- For now, BTC looks ready for a recovery rally to $32,500 aka the 2021 volume point of control.
- A weekly candlestick close above $52,000 will trigger a bull run for the crypto ecosystem.
Bitcoin price shows interesting setups from multiple time frames that hint at a confluence. This convergence occurs for the short-term bullish outlook as well as the macro bearish scenario for BTC.
Macro outlook reveals BTC under pressure
Bitcoin price has crashed 61% from its all-time high at $69,000 to a recently formed swing low at $26,591. This massive downswing comes as BTC breached the bear flag setup on May 5. While the continuation pattern forecasts a 52% downswing to $17,803, there are multiple technicals that arrive at a similar conclusion.
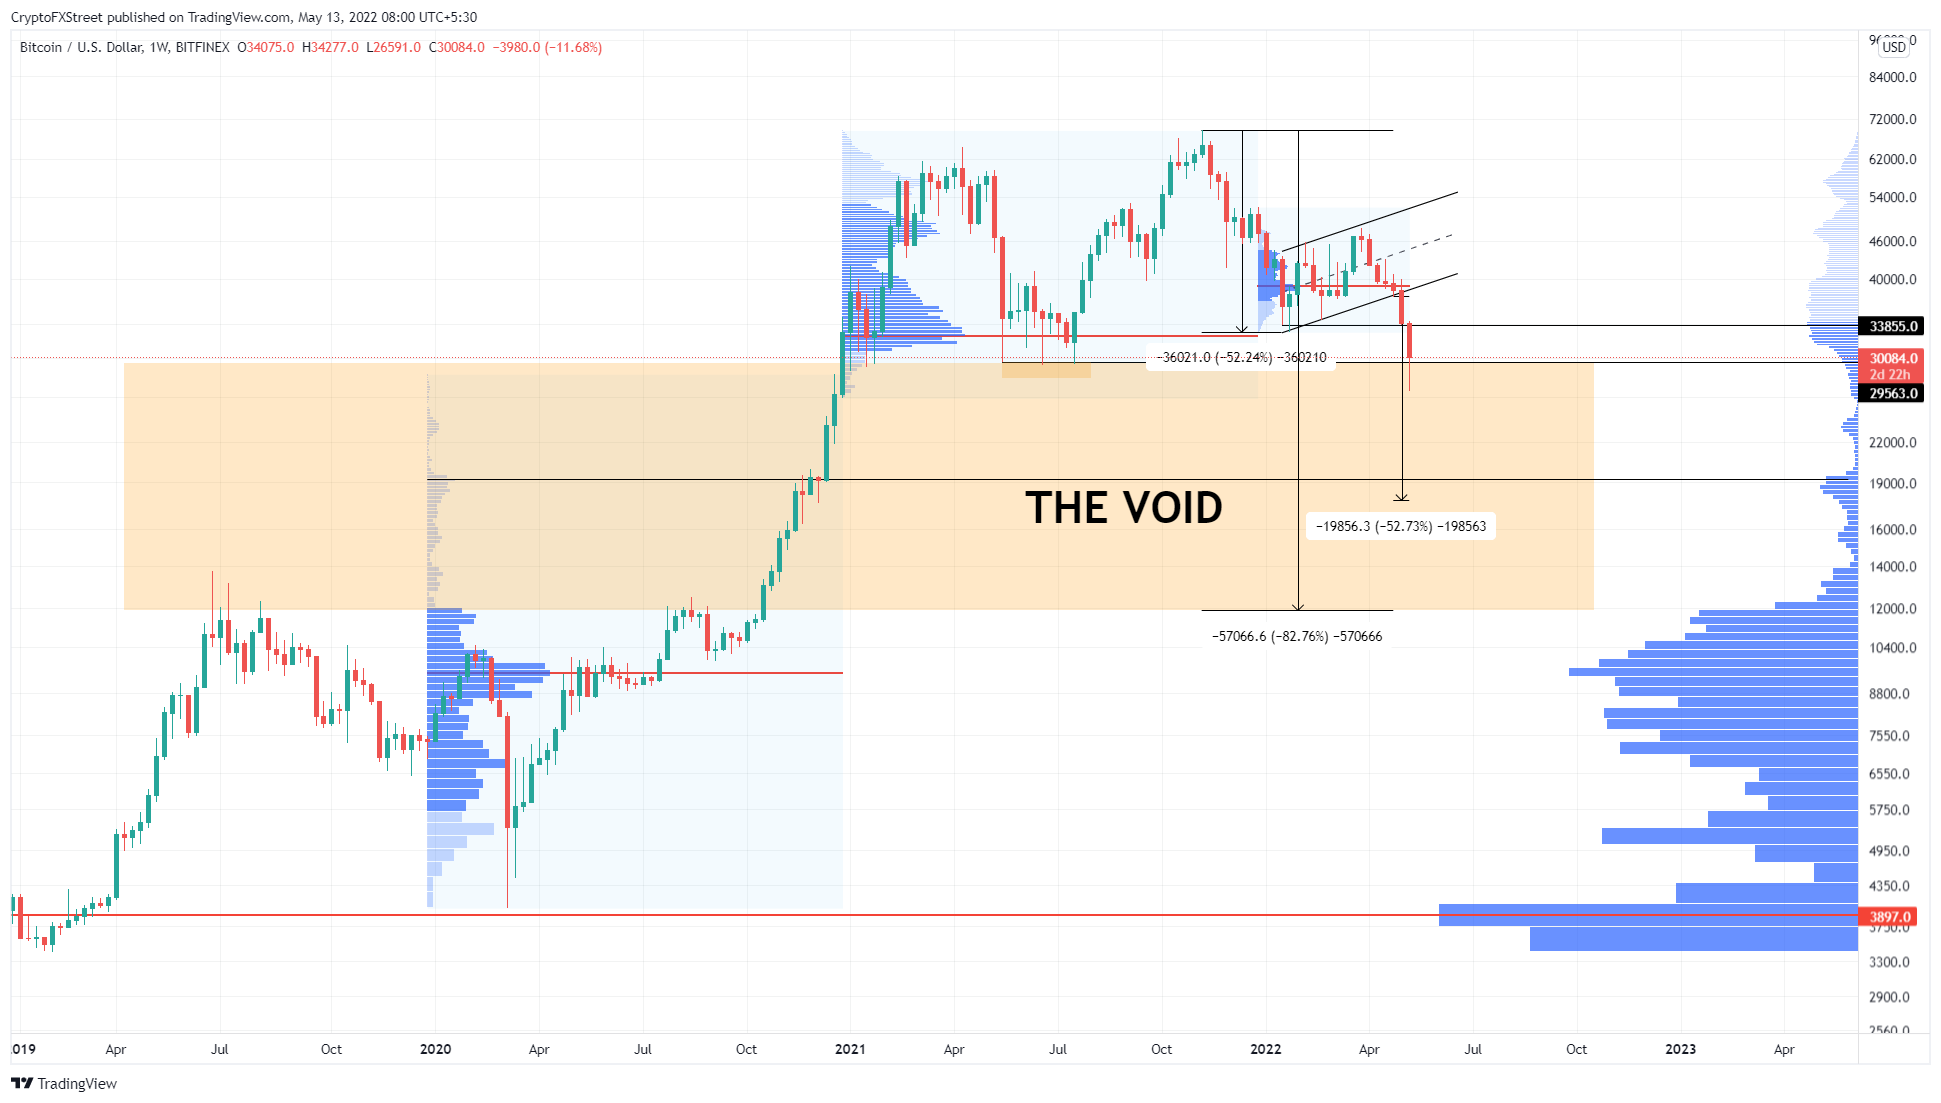
The weekly chart, as shown below, contains the volume profile for 2020, 2021, and 2022. The most eye-catching data is seen in the 2020 and 2021 profiles. The indicator shows that barely any volume was traded as Bitcoin price rallied 556% between September 7, 2020, and April 12, 2021.
To be precise, this void in volume occurs between the price range extending from $11,891 to $29,424. Due to the exponential nature of the market, Bitcoin price quickly rallied higher, leaving behind inefficiencies.
The takeaway from this data is that the ongoing crash could see BTC bottom at $11,891 under an extremely dire case scenario. However, using the volume profile indicator’s data stretching from 2019 to 2022 shows that the first line of defense is at $19,500.
Therefore, the bleed to $11,891 could be prematurely cauterized at this level, which could potentially serve as a macro bottom. Interestingly many investors are expecting BTC to stabilize around this level.
Robert Kiyosaki, the famed author of the “Rich Dad, Poor Dad,” commented.
BITCOIN CRASHING. Great news. As stated in previous Tweets I am waiting for Bitcoin to crash to 20k. Will then wait for test of bottom which might be $17k. Once I know bottom is in I back up the truck. Crashes are best times to get rich. Take care.
While the technicals from a higher time frame suggest the possibility of the crash steepening, the short-term outlook is not as gloomy. The lower time frame technicals hint at the possibility of a minor relief rally.
BTC/USDT 1-week chart
Bitcoin price to bounce back, but temporarily
Bitcoin CME data (Chicago Mercantile Exchange) shows that there are gaps in its price action at multiple levels. These voids are often formed on the weekends when the CME stops trading but the crypto markets continue.
Due to the inherent moves in the spot prices, the CME data for BTC produces these gaps, which are filled at a later date as Bitcoin price trades into them. Sometimes, these gaps serve as a self-fulfilling prophecy.
As of this writing, there are three gaps that are worth noting - $19,080 to $18,415 to $19080, $26,535 to $23,795 and $35,180 to $34,445.
While the first range fits perfectly with the technicals discussed in the macro perspective above, the remaining gaps are important from a short-term perspective. Although BTC dipped into the $26,535 to $23,795 gap, the bulls seem to be stepping in.
As a result, Bitcoin price has kick-started its relief rally. If this bullish outlook remains, there is a good chance for the uptrend to fill the gap to the north first. Interestingly, the macro support-flipped-resistance level at $34,752 is also present in this range. Therefore, the upside is capped at around $35,000.
In total, the minor run-up would constitute a 15% ascent in the coming hours or days.
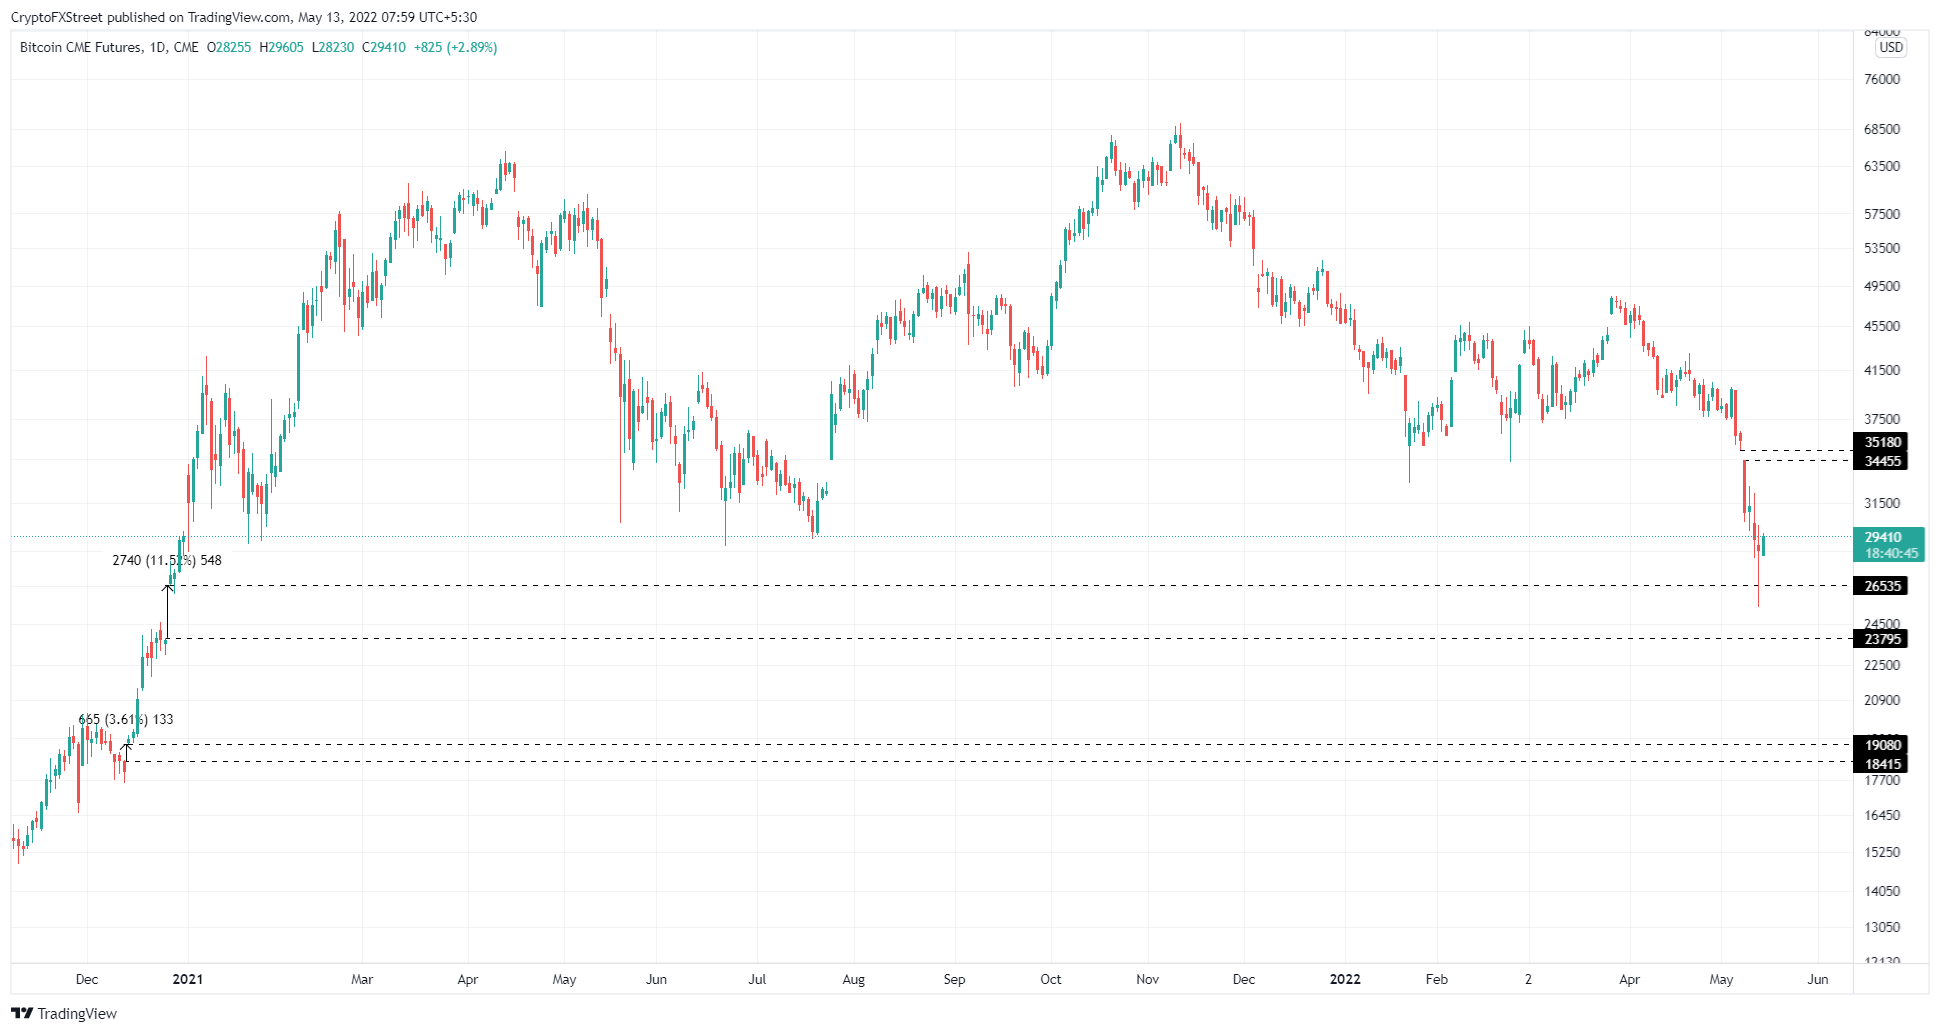
BTC/USD CME 1-day chart
While things are looking up for Bitcoin price from a short-term perspective, the confluence of the target from the bear flag, the volume profile outlook and the CME data all point that a further crash in Bitcoin price is likely.
Therefore, investors need to exercise caution and not get euphoric if BTC or altcoins start rallying. Moreover, if the Bitcoin price produces a weekly close above $35,000, things could start to turn around prematurely.
However, an invalidation of the bearish thesis will occur only after a weekly candlestick close above $52,000. This move would produce a higher high from a macro perspective and hint that the bulls are back.
In such a case, Bitcoin price will make a run at the $60,000 psychological level and eventually its all-time high at $69,000.