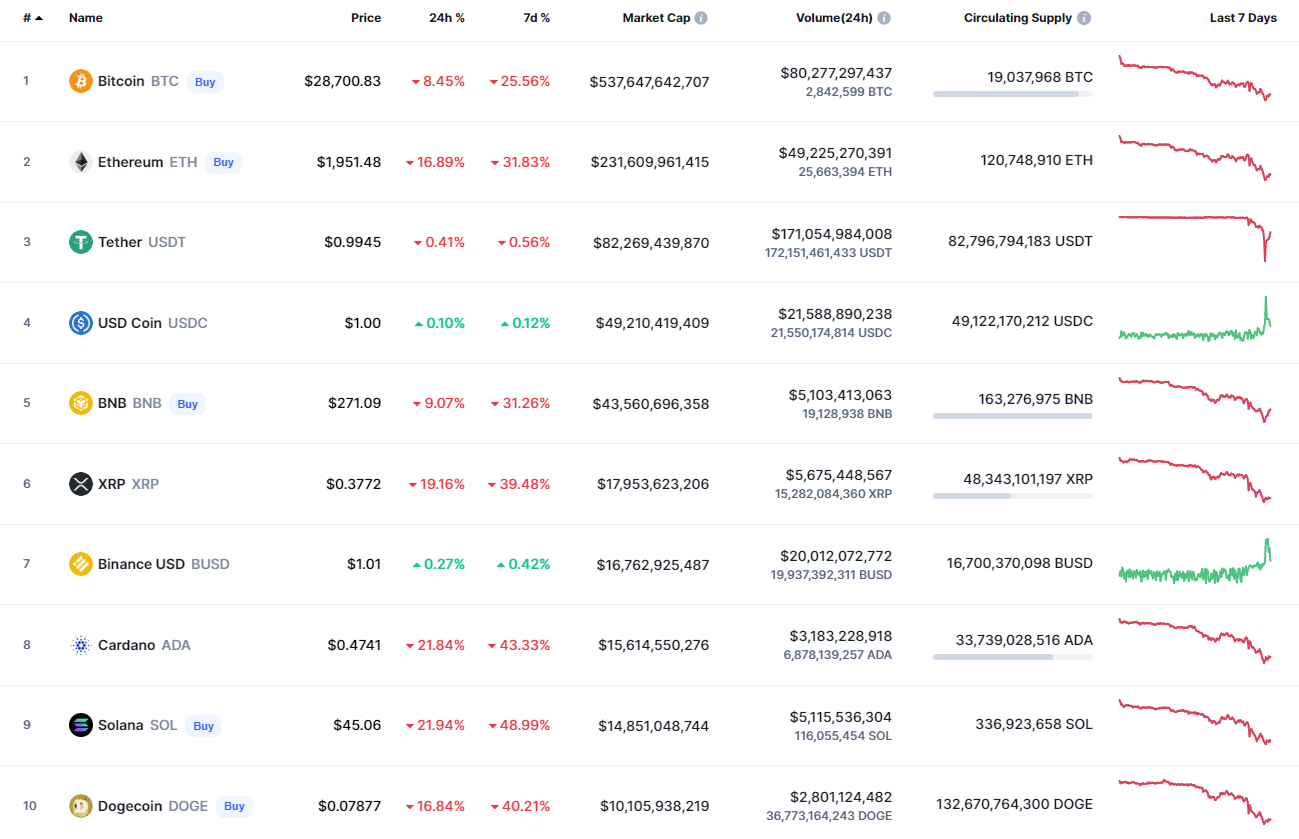
Bulls could not seize the initiative today, and the rates of cryptocurrencies have continued going down. Solana (SOL) is the biggest loser among the top 10 coins, falling by almost 22%.
BTC/USD
Bitcoin (BTC) has fallen the least today, declining by 8.45% over the last 24 hours.
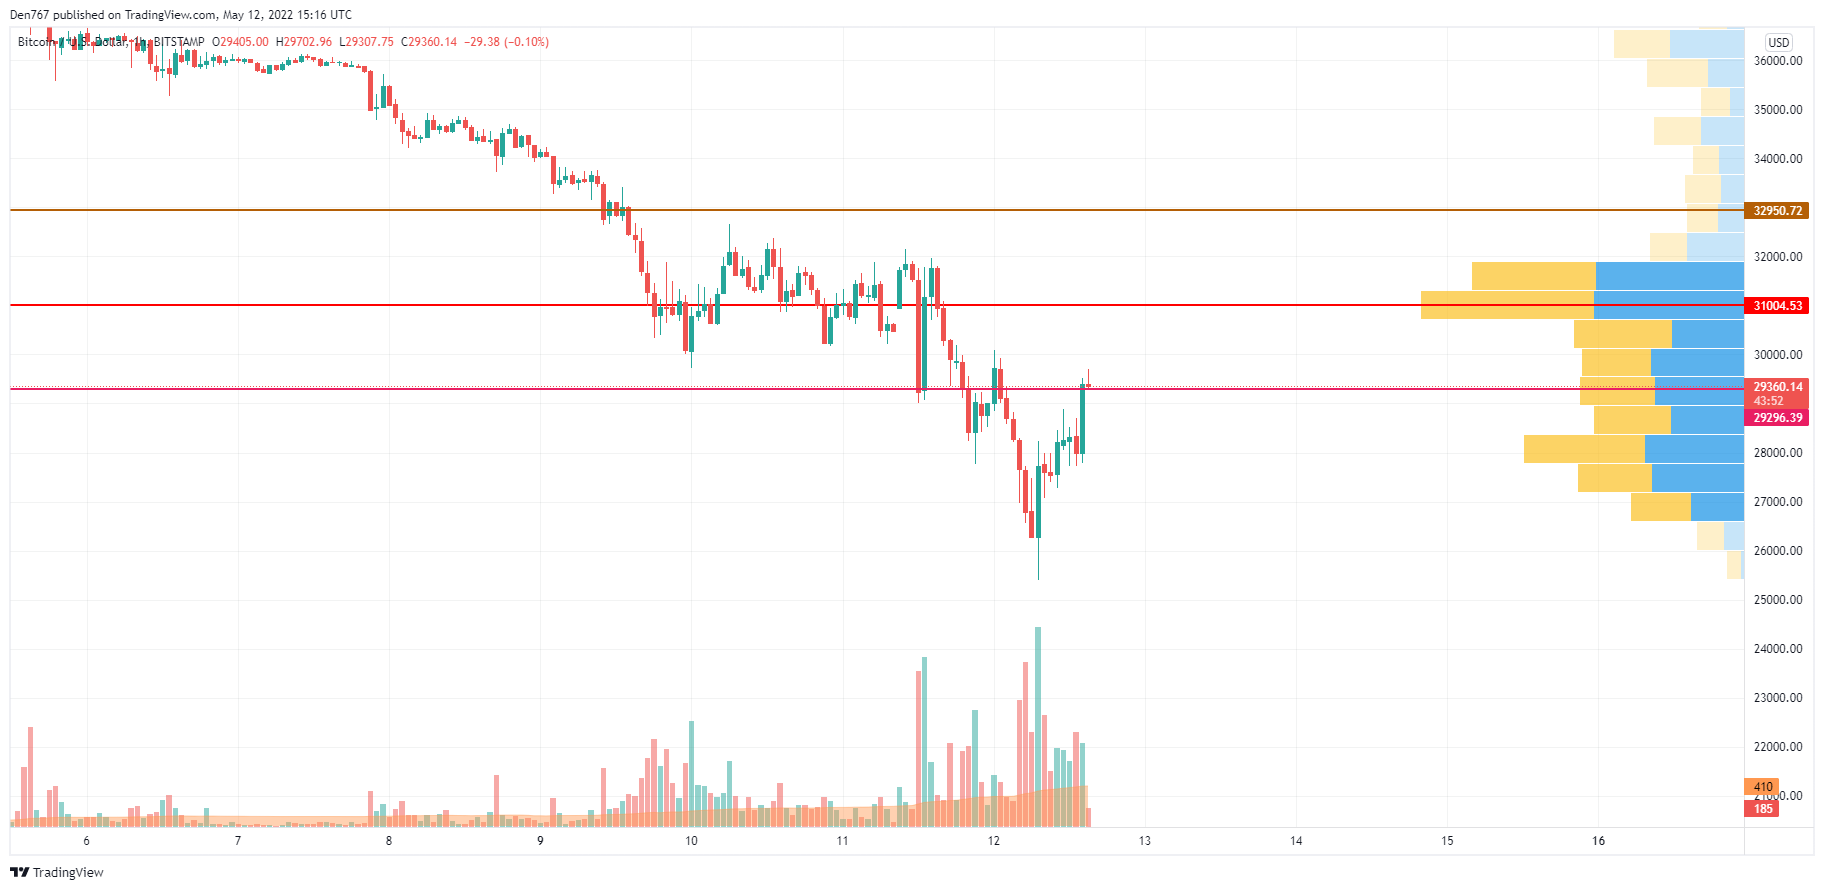
On the hourly chart, Bitcoin (BTC) has broken the local level at $29,283 and is trying to fix above. If buyers succeed, the upward move can continue to the vital zone around $30,000.
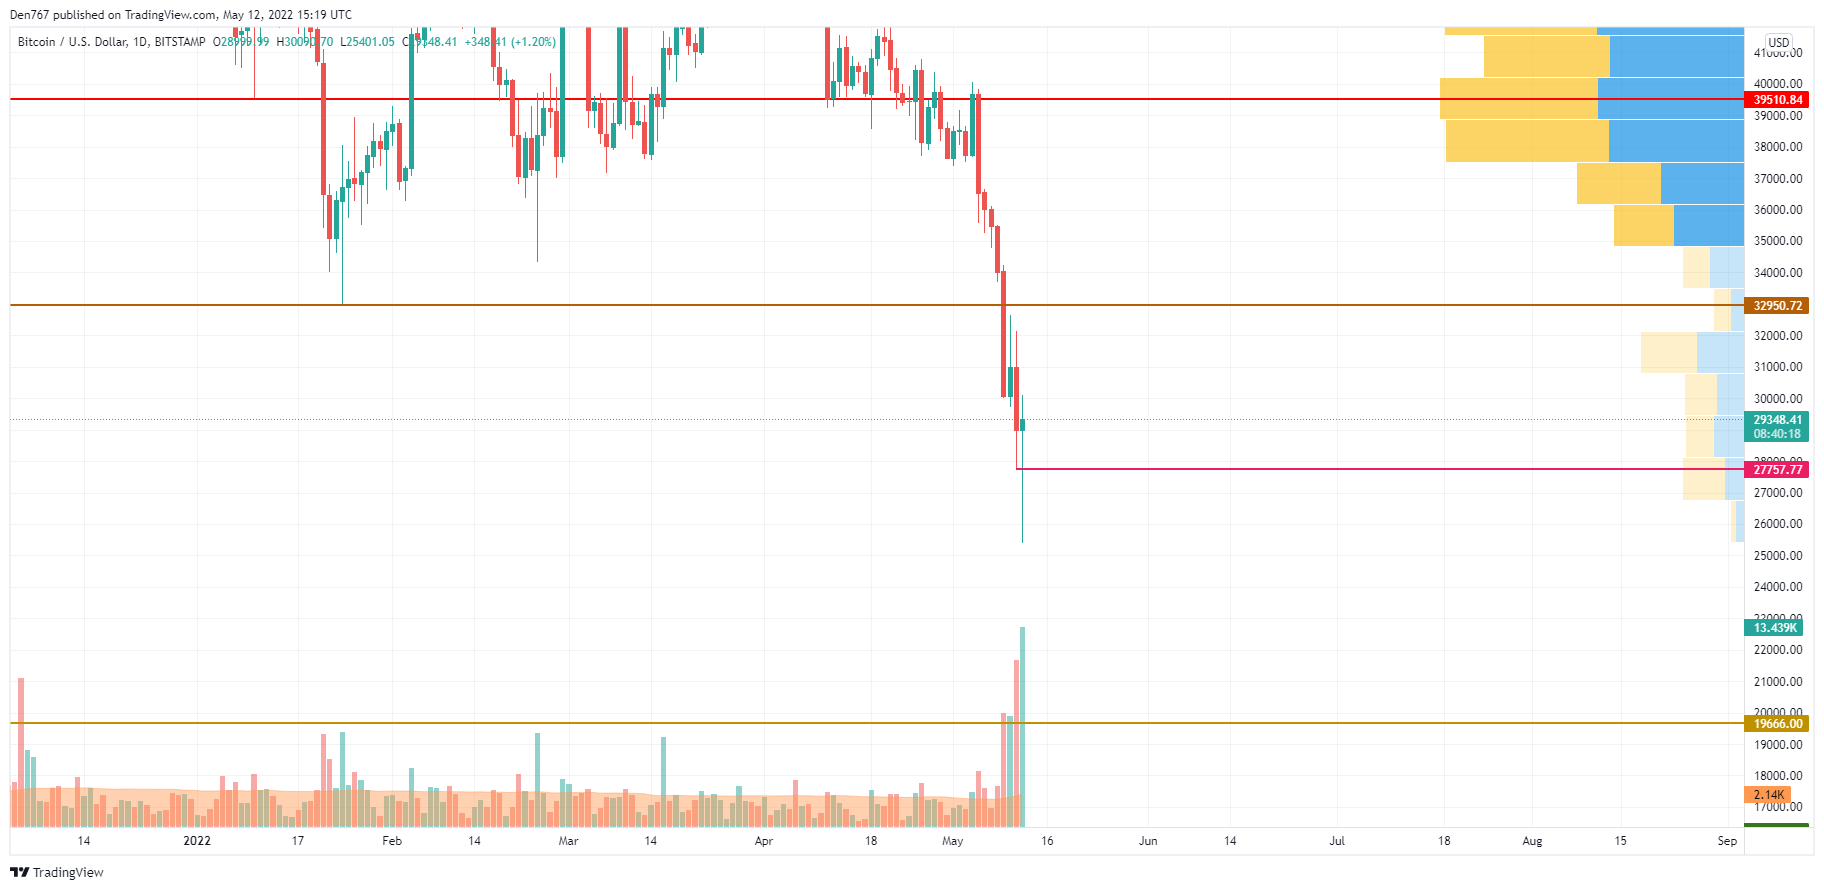
On the daily time frame, Bitcoin (BTC) has made a false breakout of the level of $27,757.
If the buying volume keeps rising, the upward move can continue above the vital $30,000 mark.
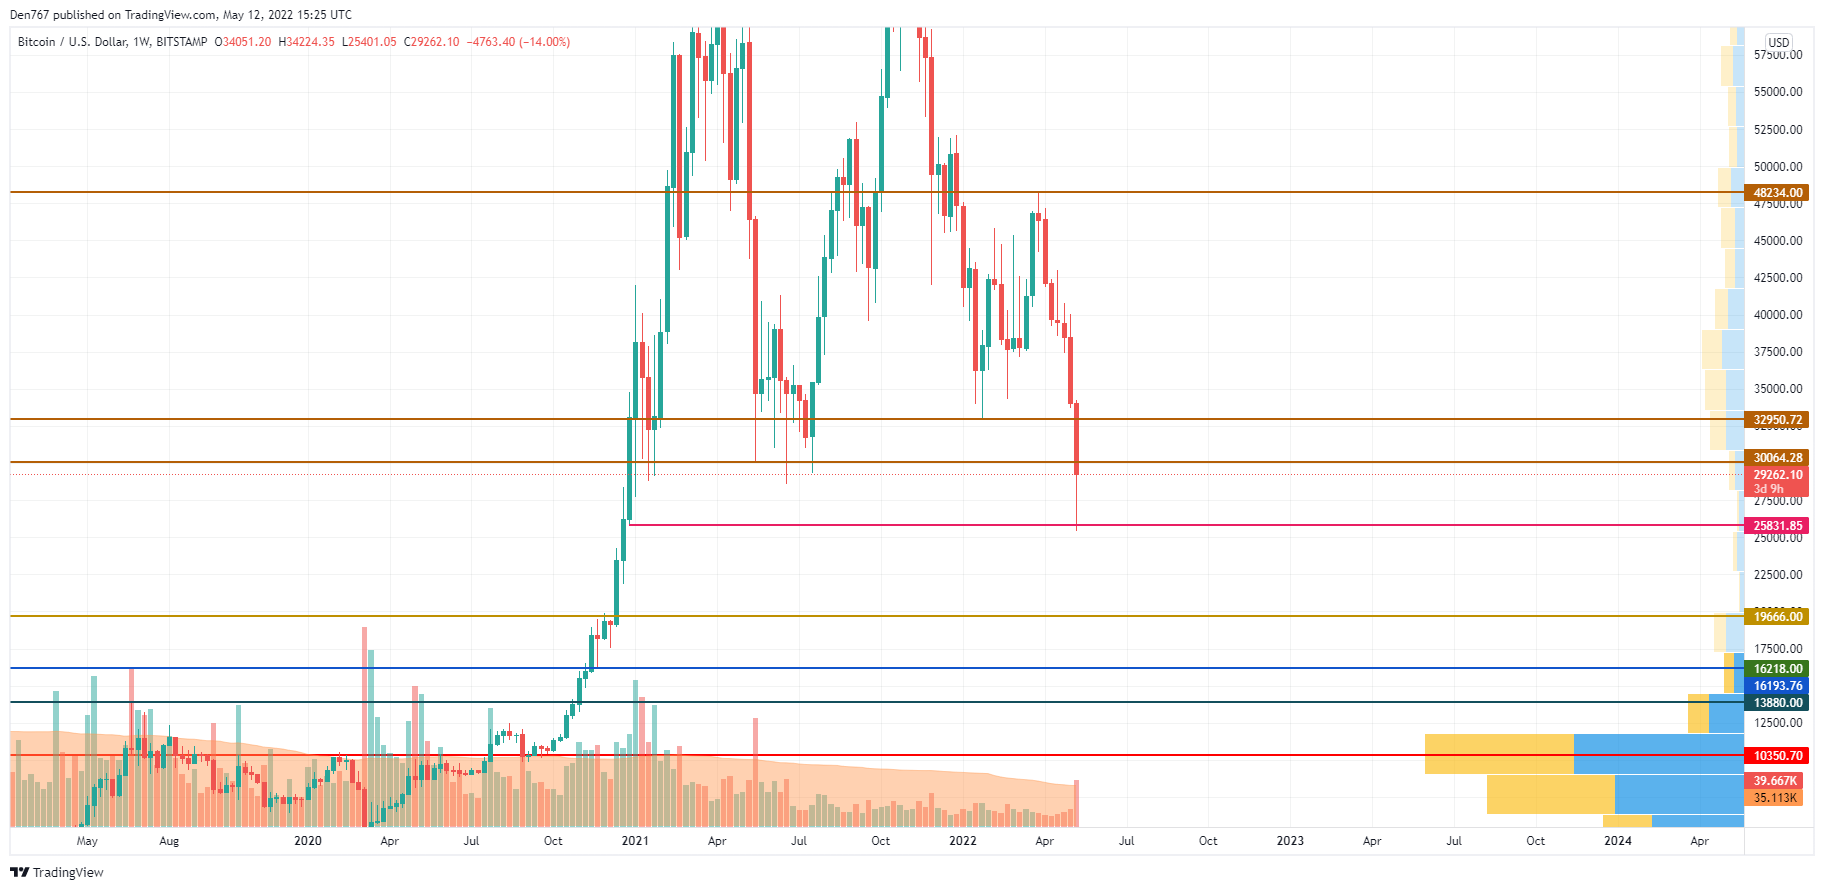
On the weekly chart, Bitcoin (BTC) has also made a false breakout of the old level at $25,831. The selling trading volume remains high, which means that bears are not going to give up. However, if the weekly candle closes above the $30,000 mark, the upcoming week might be bullish for the leading cryptocurrency.
Bitcoin is trading at $29,203 at press time.