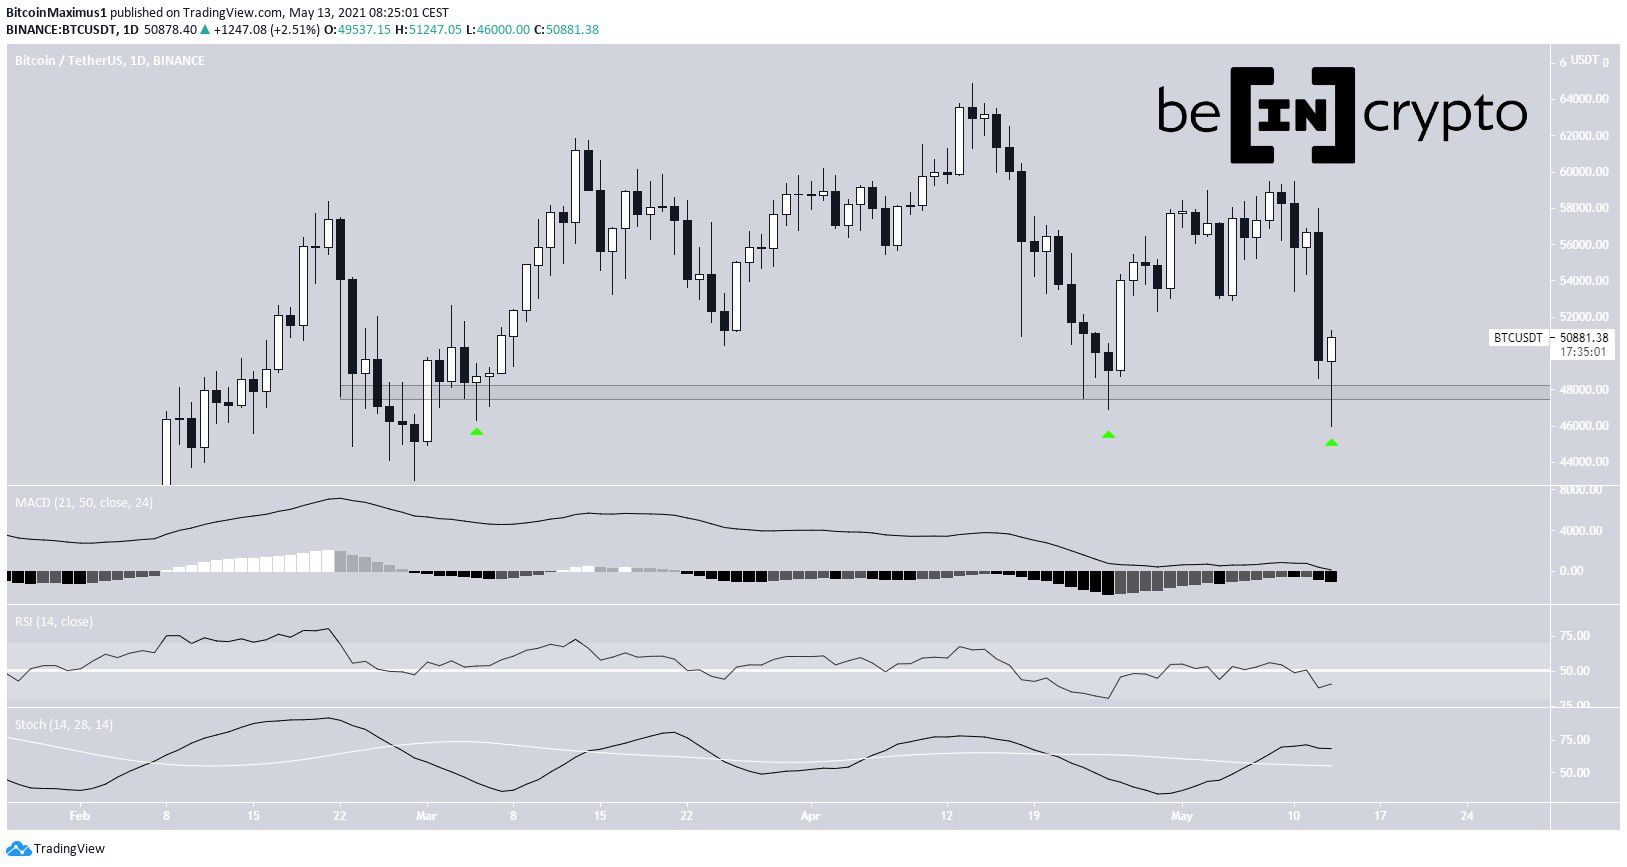
Bitcoin (BTC) decreased considerably on May 12. While it resumed its downward movement in the early hours of May 13, it has since bounced back above the $48,000 support area.
The drop came shortly after Tesla announced that it had stopped accepting BTC as a payment option.
Significant BTC drop
BTC decreased considerably yesterday, falling from a high of $58,000 all the way to a low of $48,600. The decrease continued in the early hours of the morning until a low of $46,000 was reached. The $48,000 support area has been in place since the beginning of March 2021.
However, BTC has rebounded to a high of $51,247 and is in the process of creating a bullish hammer candlestick.
Despite the drop, technical indicators can still be considered bullish. Even though the RSI has crossed below 50, the MACD is still positive. If it were to cross into negative territory, it would be the first time it has done so since October 2020.
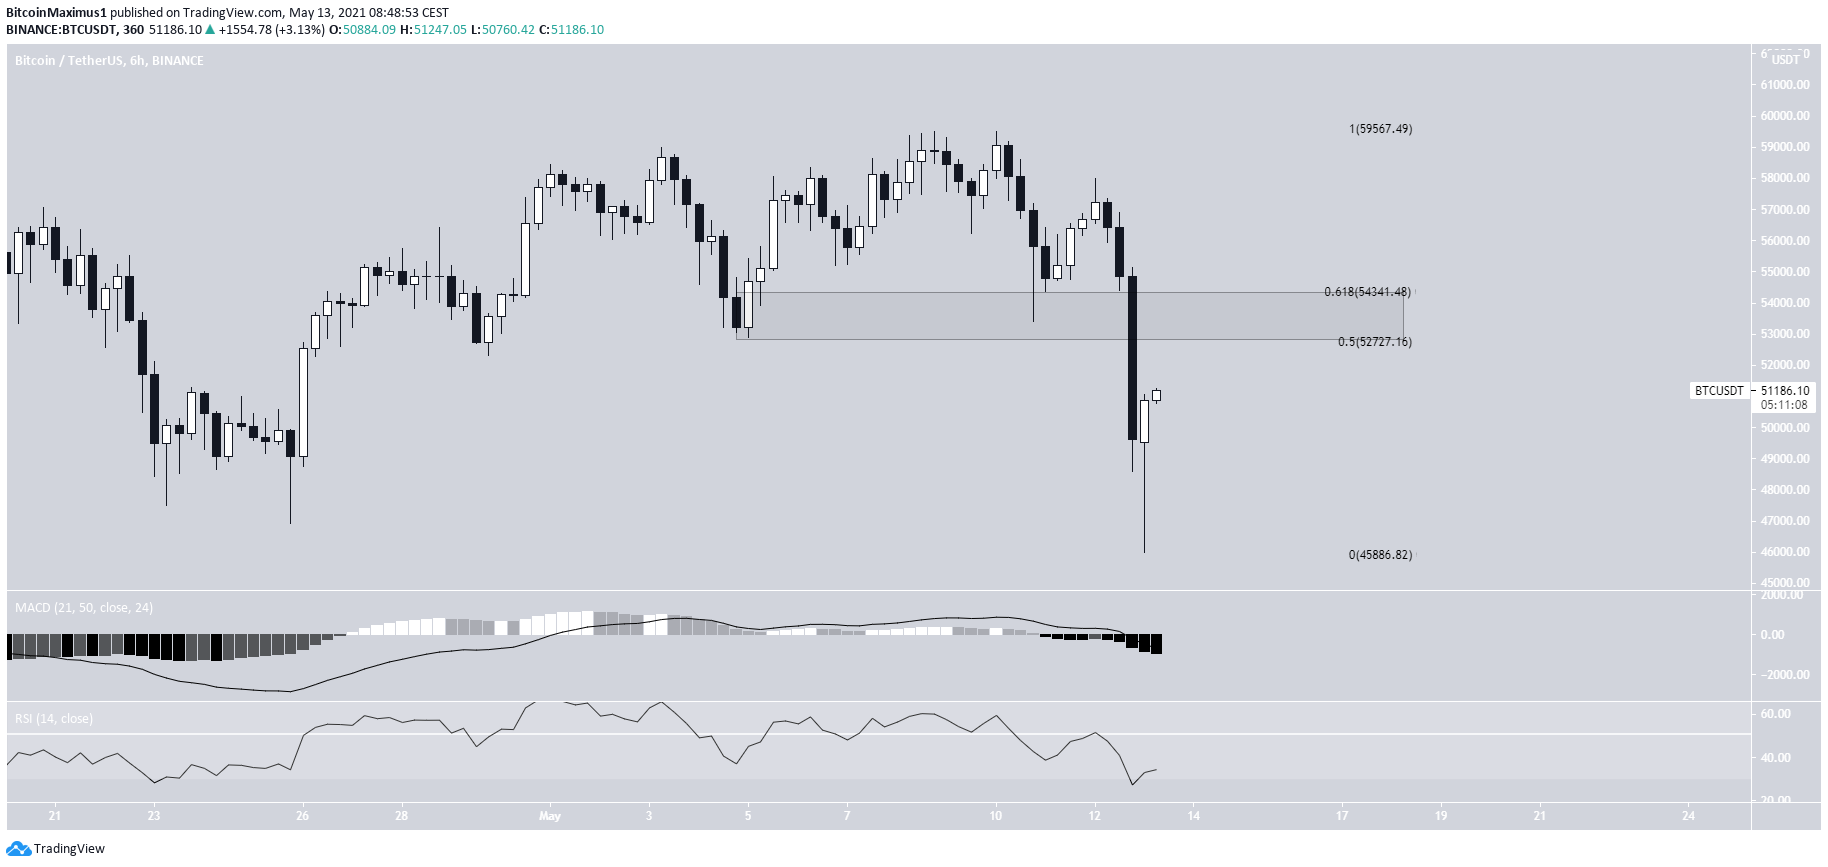
Ongoing Retracement
The six-hour chart already shows a bullish hammer in place.
However, there is a very significant resistance area found between $52,730 and $54,340 this created by the 0.5-0.618 Fib retracement level. It’s also a horizontal resistance area.
Therefore, until BTC manages to break through the $52,730-$54,340 resistance zone, the trend cannot be considered bullish.
In addition, both the RSI and MACD are still falling, failing to provide any bullish reversal signs.
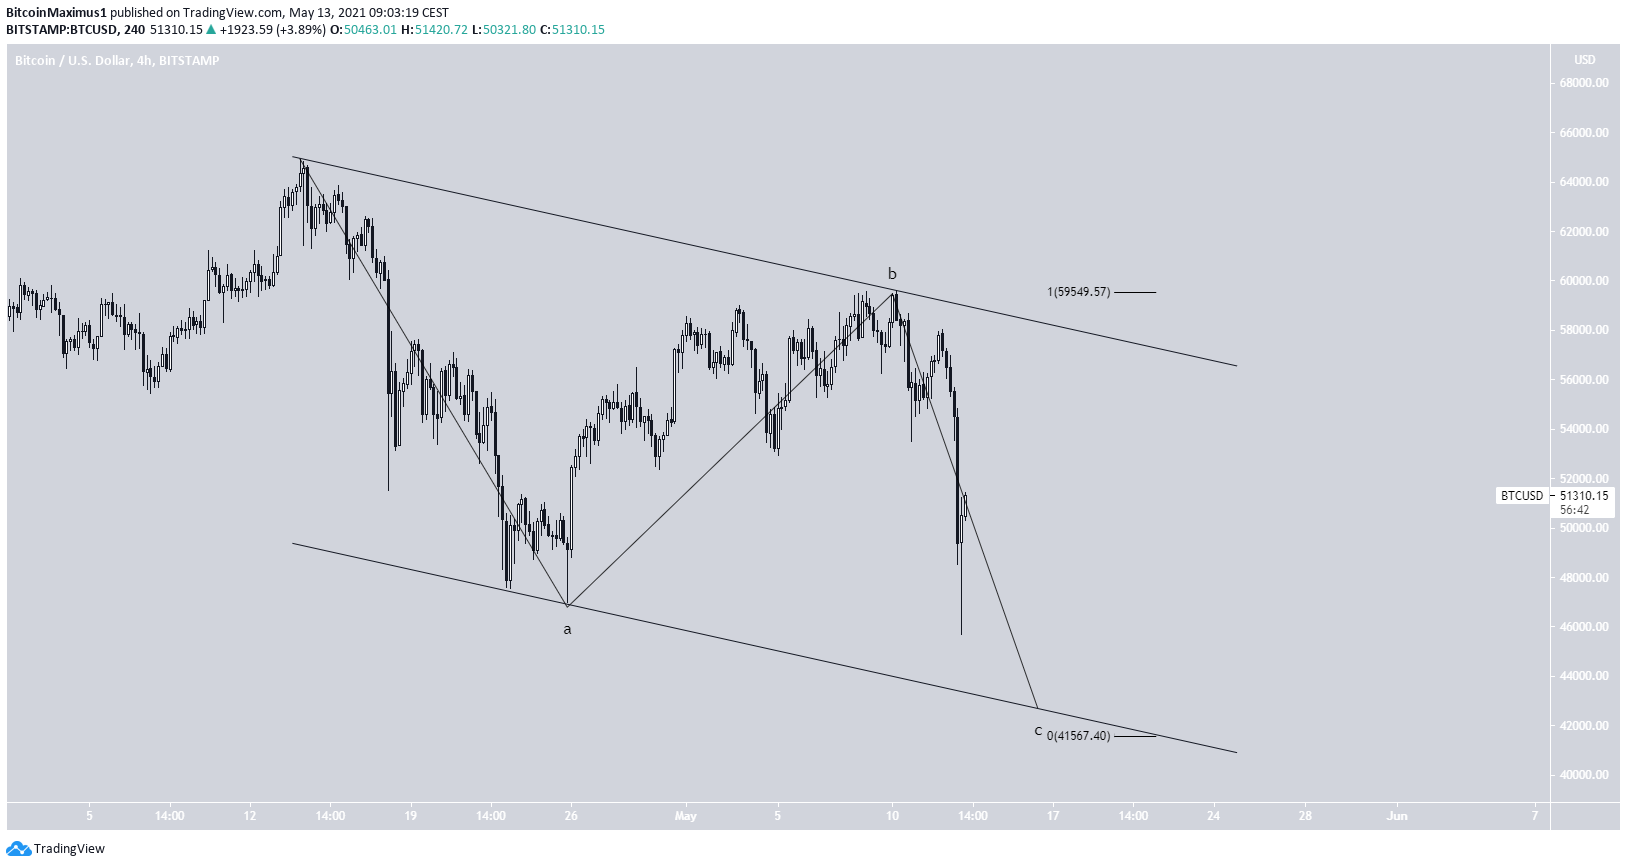
BTC Wave Count
Yesterday’s drop invalidated the possibility that a bullish impulse began on April 25. Therefore, the most likely scenario suggests that this is a zig-zag correction in which BTC is currently in the C wave.
A potential target for the bottom of the movement is found at $41,567. This aligns with the support line of a descending parallel channel.
Following this, a move to the upside is expected.
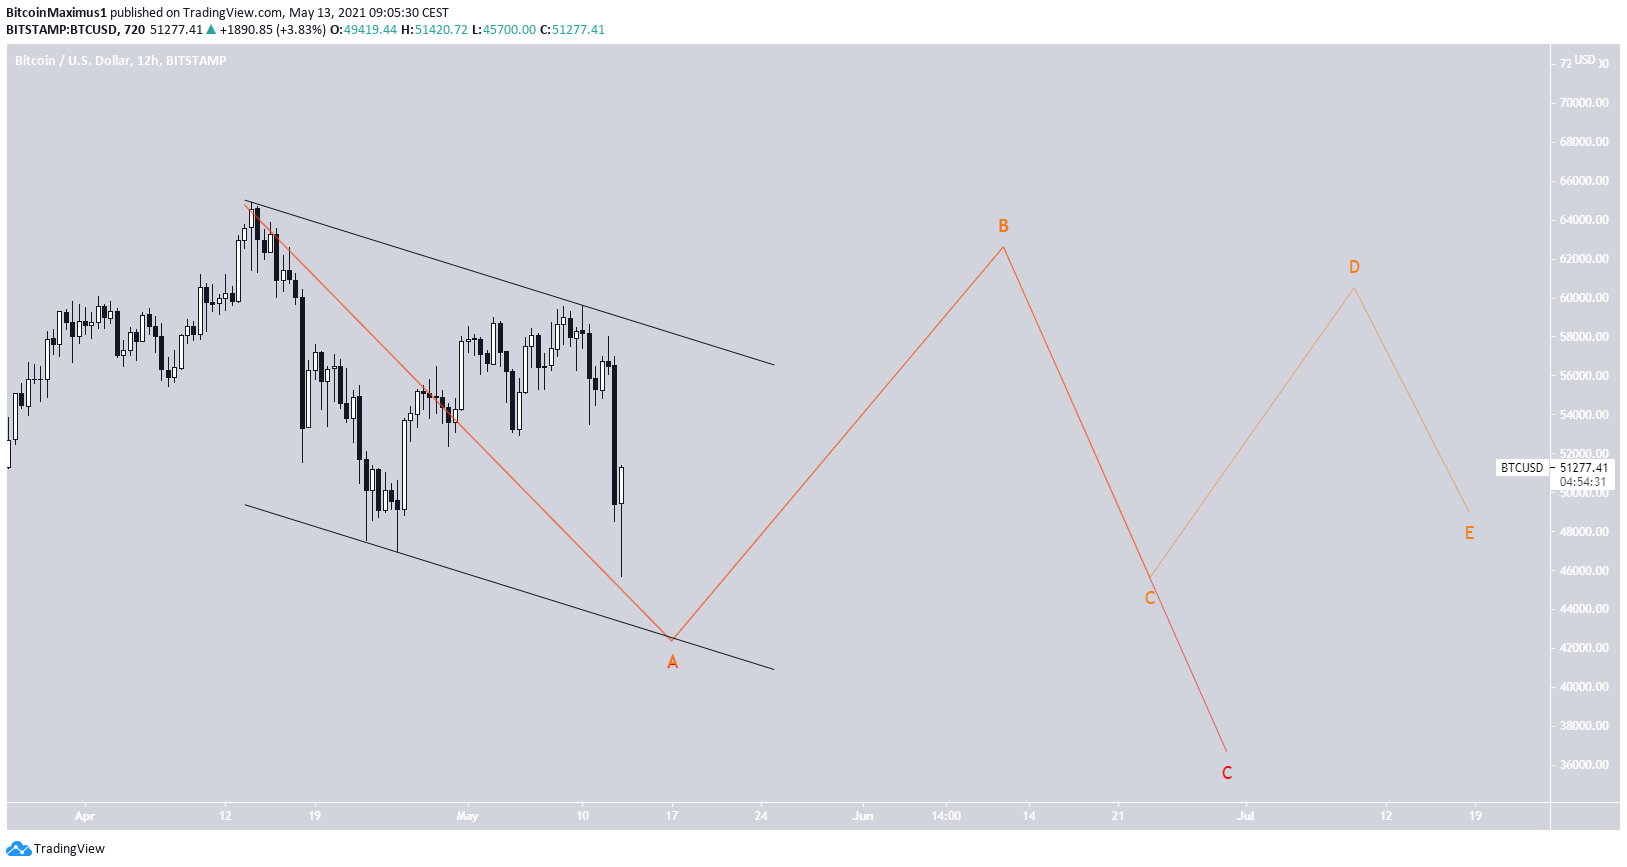
In the longer term, this is presumably the A wave of either a long-term flat correction (red) or a fourth wave triangle (orange).
At present, it cannot be determined which pattern will transpire.
After the entire pattern is complete, another upward move towards a new all-time could still occur.
Conclusion
While another short-term drop could occur within the next few days, it’s not likely that this is the top of the greater upward movement for bitcoin.