The bitcoin (BTC) price has been decreasing over the past two days, breaking down from a short-term ascending support line.
Despite the decrease, BTC has found support at the 0.5 Fib retracement support level at $53,000 and began the ongoing bounce.
BTC retraces
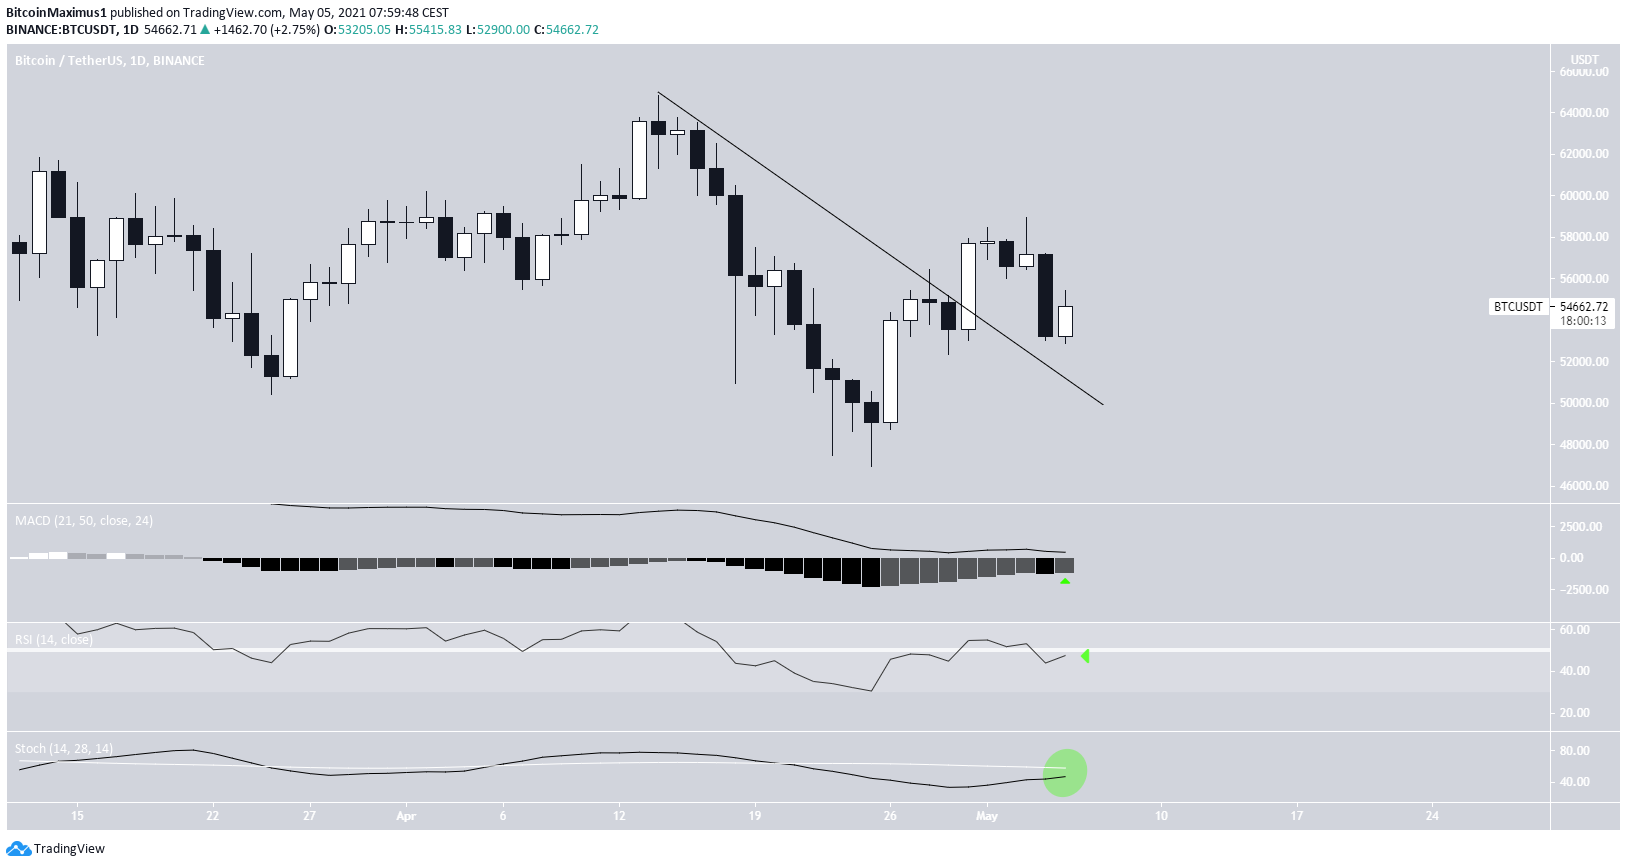
Bitcoin decreased considerably yesterday, creating a bearish engulfing candlestick. It fell from a high of $57,200 to a low of $53,046, amounting to a total decrease of 7%.
It’s possible that the drop occurred in order to validate the descending resistance line from which BTC broke out prior.
Despite the decrease, technical indicators are still bullish. The MACD is increasing and the Stochastic oscillator is still on track to make a bullish cross.
BTC bounces at support
The short-term chart shows that the price has been moving downwards over the past two days. This led to a breakdown from an ascending support line, which had previously been in place since the April 26 low.
The decrease is still ongoing and has taken BTC to the $53,000 support area. This is the 0.5 Fib retracement level of the entire upward move and a horizontal support area. Once it got there, the price began moving upwards
In addition, technical indicators are turning bullish. The RSI has generated a bullish divergence and the MACD has given a bullish reversal signal. Therefore, it’s likely that the price continues to increase in the short term.
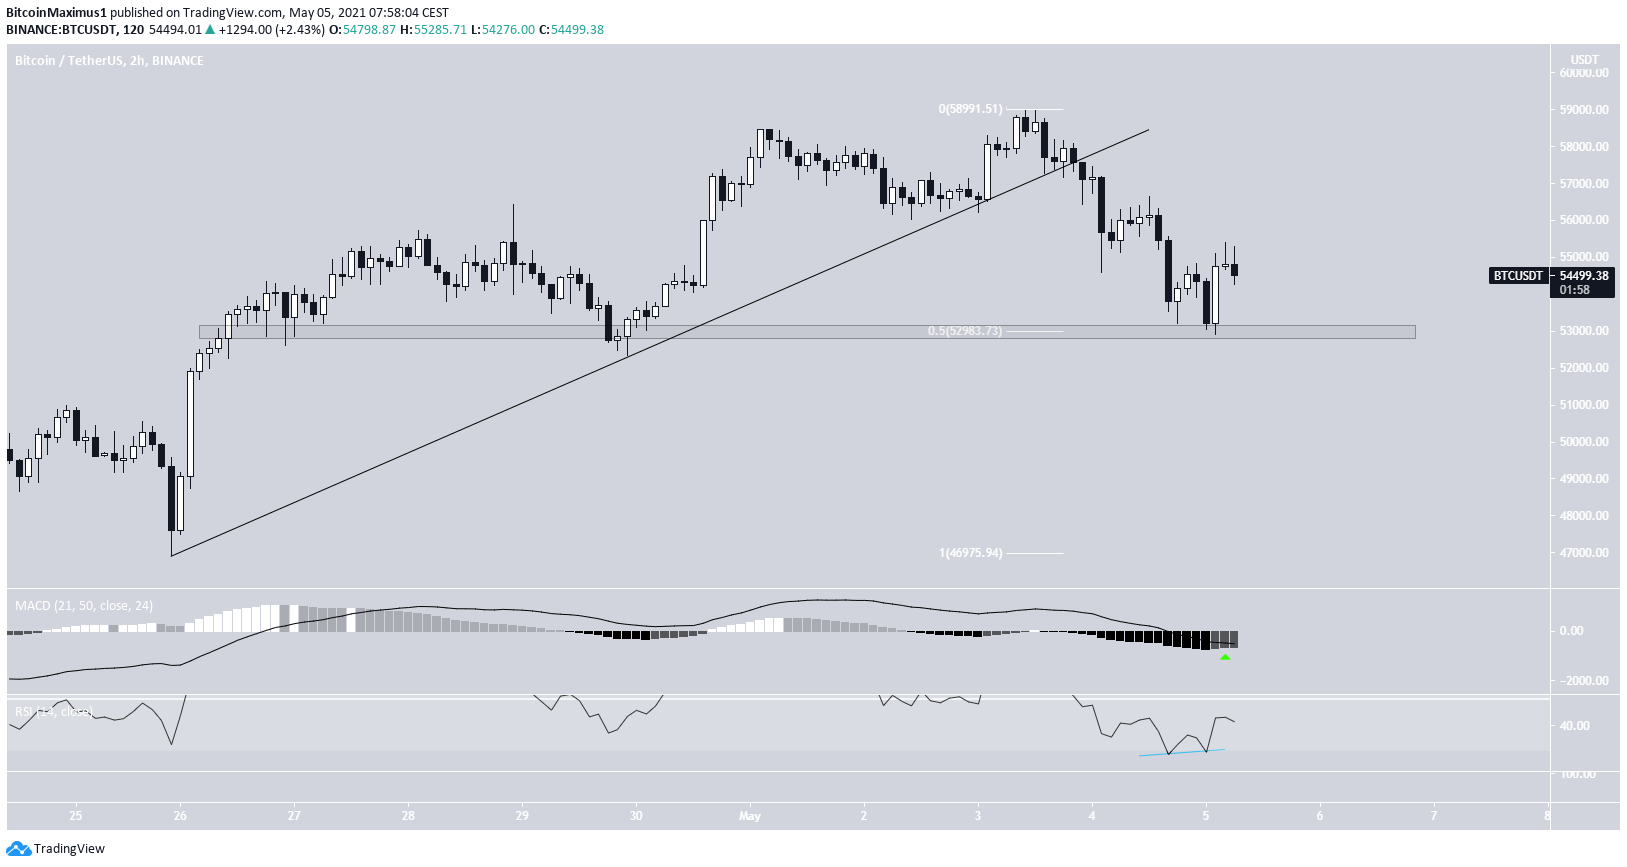
If it does, the main resistance area is found between $56,000-$56,700. This target range is the respective 0.5-0.618 Fib retracement levels of the downward movement.
A breakout and retest of this level would confirm that the short-term trend is bullish.
Wave Count
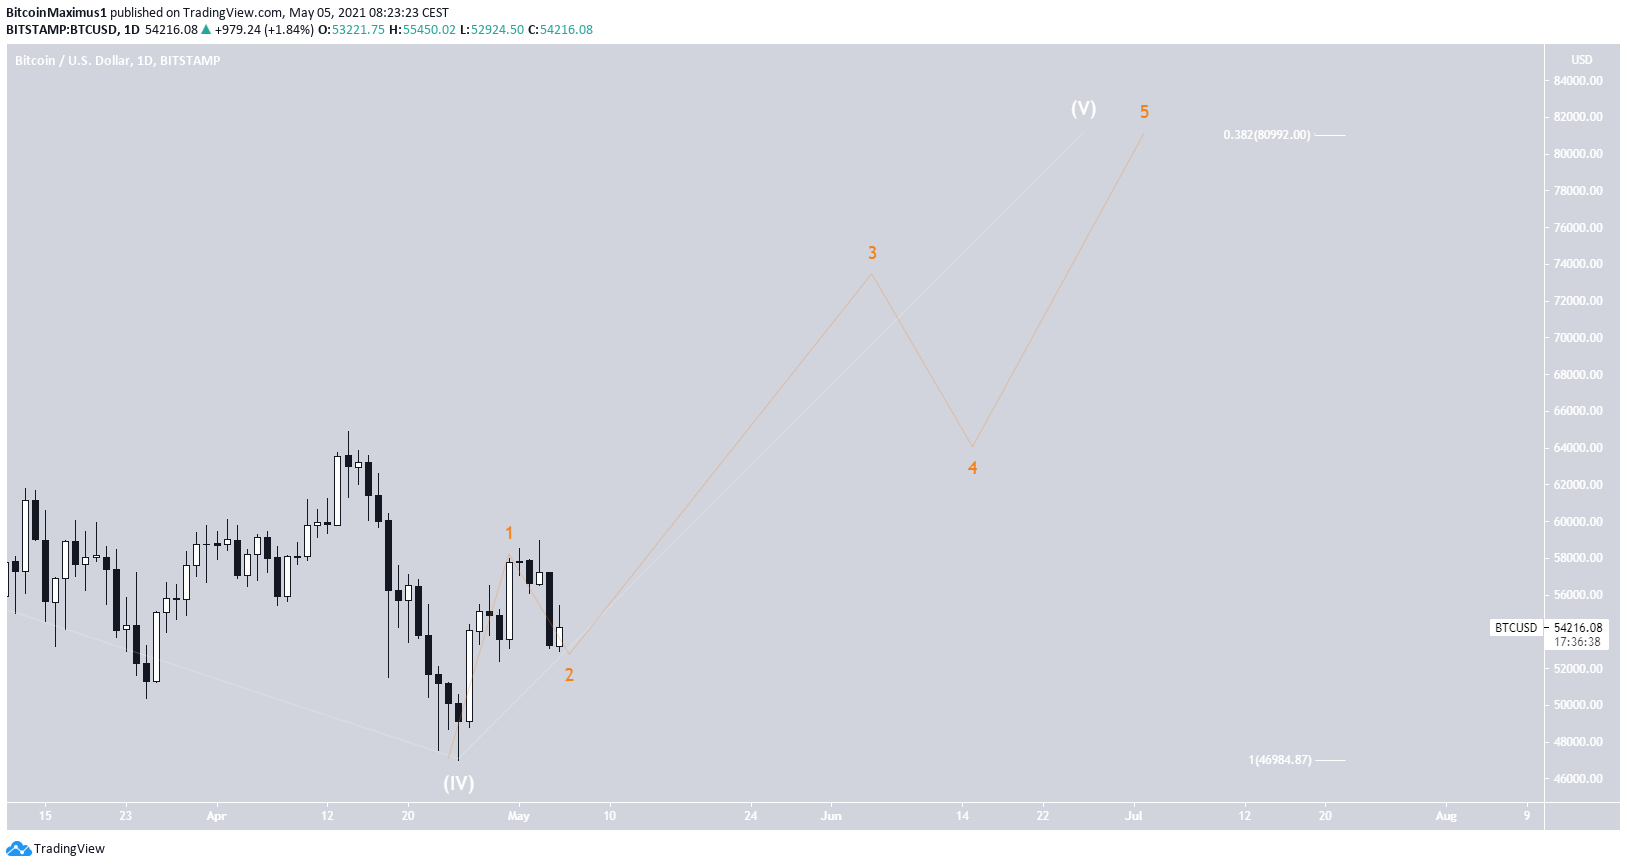
The wave count suggests that BTC is in wave five (white) of a long-term bullish impulse.
The two most likely targets for the top of this upward move are located at $81,300 and $102,300. These targets are found by using a Fib projection on waves 1-3.
The sub-wave count is shown in orange. It suggests that the price has completed sub-waves one and two.
A decrease below the sub-wave one low of $47,004 would invalidate this particular wave count.
Conclusion
Bitcoin has likely found support at $53,000 and is expected to resume its trajectory to the range highs.