The benchmark cryptocurrency has chartered lower highs and lower lows (wedge) since the beginning of January, and a lack of strong market bias has both bears and bulls scraping for clues. As a result, the volatility represented by Bollinger Bands width—a technical tool represented by +2, -2 standard deviations of an asset’s moving average—has hit its late December levels.
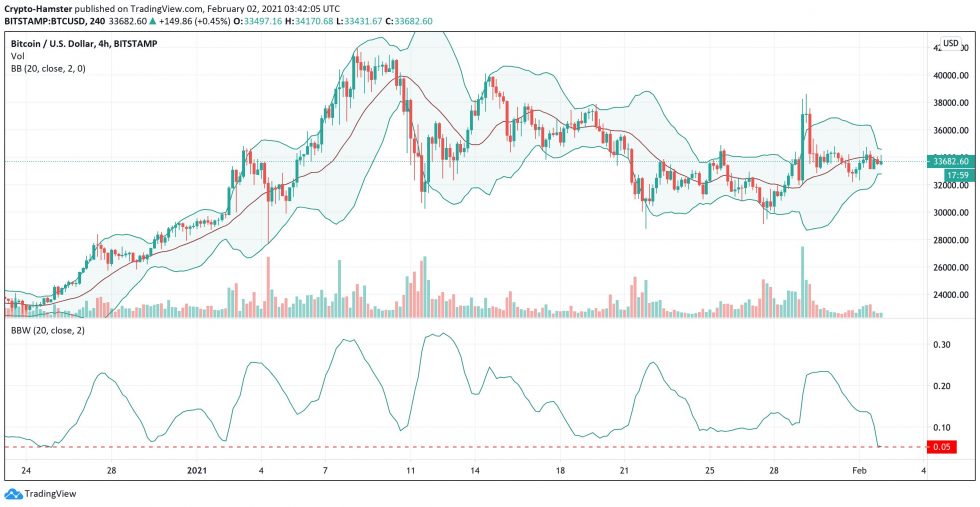
Bitcoin volatility dips amid its price correction from near $42,000-high, as represented by CryptoHamster. Source: BTCUSD on TradingView.com
It is worth highlighting that a prolonged period of low volatility typically paves the way for a stronger directional bias. That means Bitcoin could soon witness big price moves in either direction.
Bullish Confluence
Analysts at independent trading firm TradingShot believes the cryptocurrency would move to the upside, based on complimenting bullish signals brought forward by its 50-period moving average. The BTC/USD exchange recently closed above the said wave while recalling its ability to provide a backstop of wild bull runs.
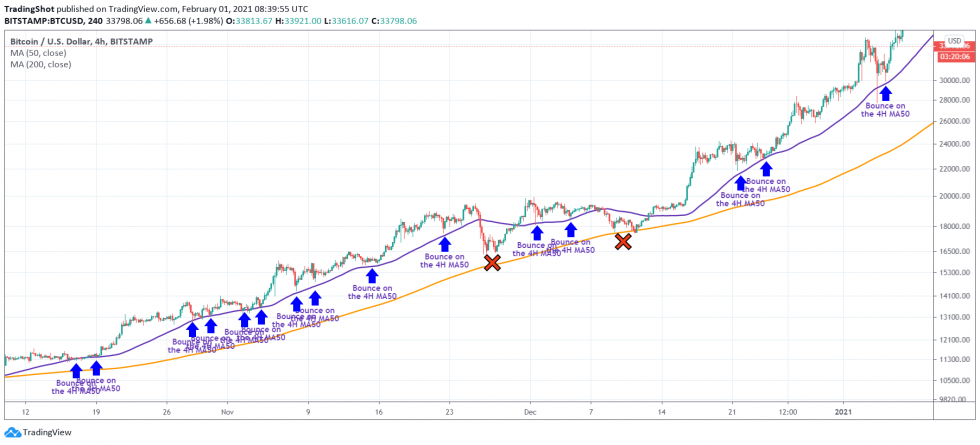
Bitcoin’s 4H 50-SMA through recent history. Source: BTCUSD on TradingView.com
TradingShot noted the same in its recent note, calling the 50-period moving average “an important short-term indicator.”
“It has provided excellent support on Bitcoin’s late 2020 parabolic rise,” the analysts added. “In fact, as you see on the chart below, we can count 15 clear bounces since October 2020, and only 2 times it broke.”
They now expect Bitcoin to undergo “a sustainable uptrend” in February should the 50-period moving average holds strong. Meanwhile, TradingShot asserted that Bitcoin’s LMACD indicator alerts about a bullish crossover, which further increases the upside bias in the cryptocurrency market.
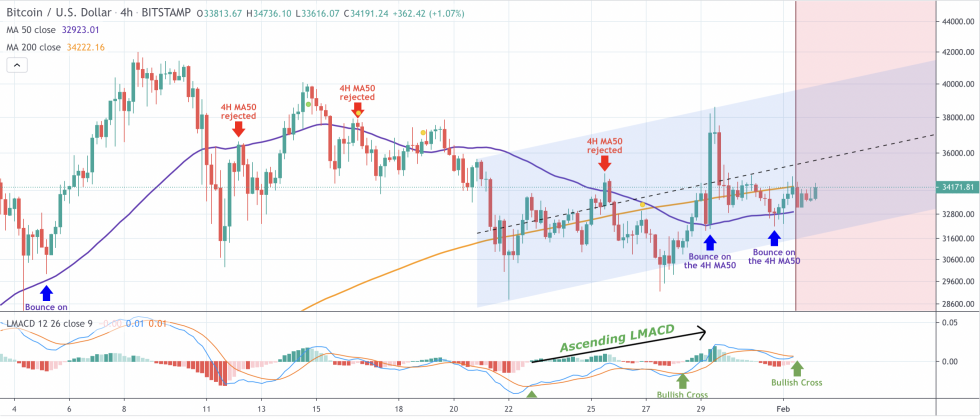
Bitcoin market setup, as presented by TradingShot. Source: BTCUSD on TradingView.com
Bitcoin is now attempting to close above its 200-period moving average wave (orange) to confirm its extended bullish bias. A successful breakout move would have bulls test levels above $40,000 as their primary targets—amid higher volatility.
Bitcoin 1-D Chart
Meanwhile, Bitcoin’s one-day chart shows the price attempting to break above its Bollinger Bands’ middle band, representing the 21-day moving average.
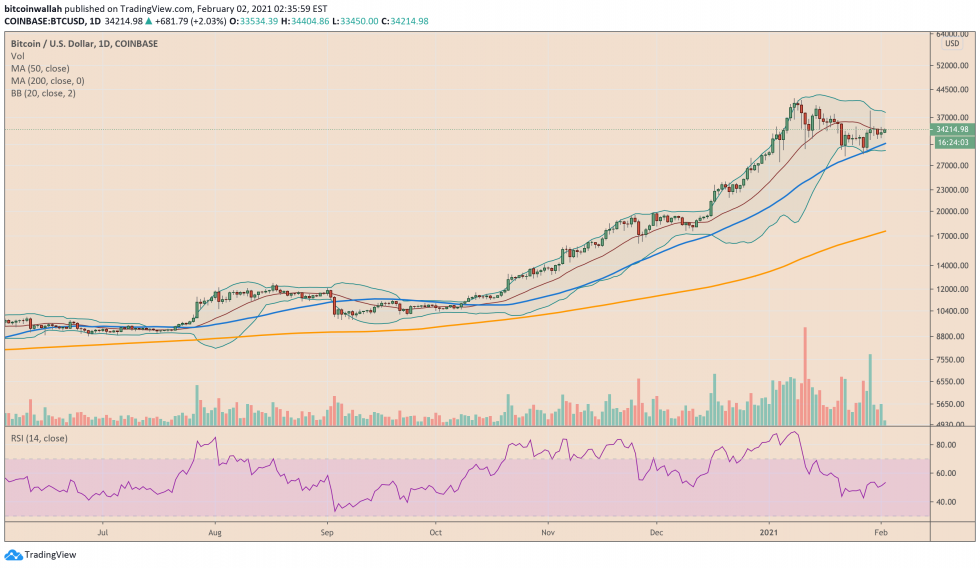
Bitcoin looks to close above its 21-day moving average. Source: BTCUSD on TradingView.com
A successful break above would have traders test the upper Bollinger Band as their short-term upside target. It is near $38,500. Conversely, a pullback from the middle band would risk sending the price back to the lower $31,000s.