The Bitcoin (BTC) price decreased significantly on Jan. 27. It reached a double bottom and bounced at the $29,000 support area.
Bitcoin is expected to resume its upward movement toward the $33,800 resistance area and could potentially move higher.
Bitcoin Bounces At Support
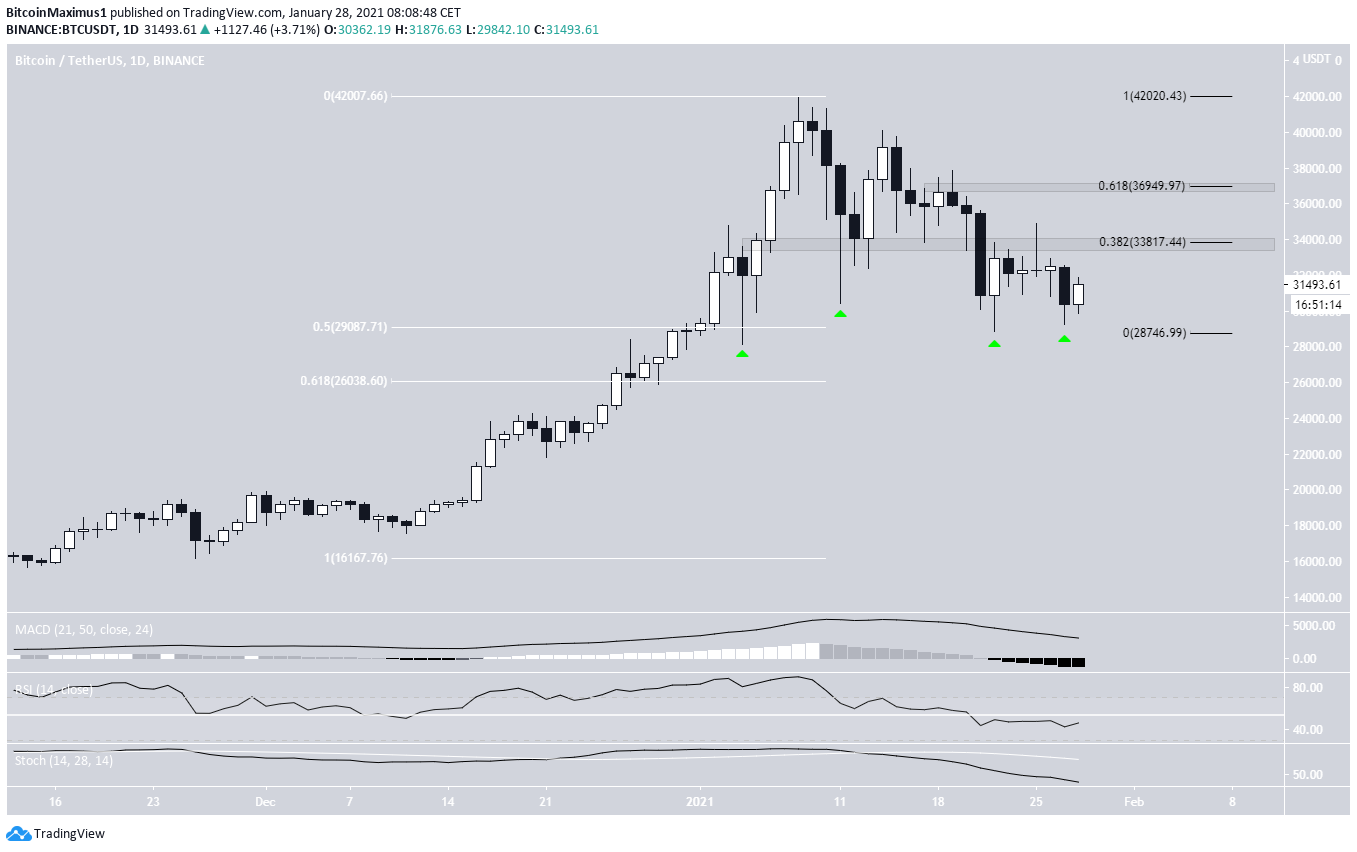
After the rejection from the $33,800 resistance area on Jan. 25, BTC resumed its descent with an accelerated drop on Jan. 27. It reached a low of $29,241 before bouncing.
The $29,000 level is extremely important as it’s the 0.5 Fib retracement level of the entire upward movement. Bitcoin has created long lower wicks each time it has been tested. However, the wicks and ensuing bounces have been weaker each time, a sign of dissipating strength.
Therefore, today’s close is extremely important, since a weaker bounce that fails to engulf yesterday’s candlestick would be a significant sign of weakness. If BTC moves higher, the closest resistance areas would likely be found at $33,800 and $36,950.
Nevertheless, technical indicators in the daily time-frame indicate that the trend is still bearish.
Double Bottom Pattern
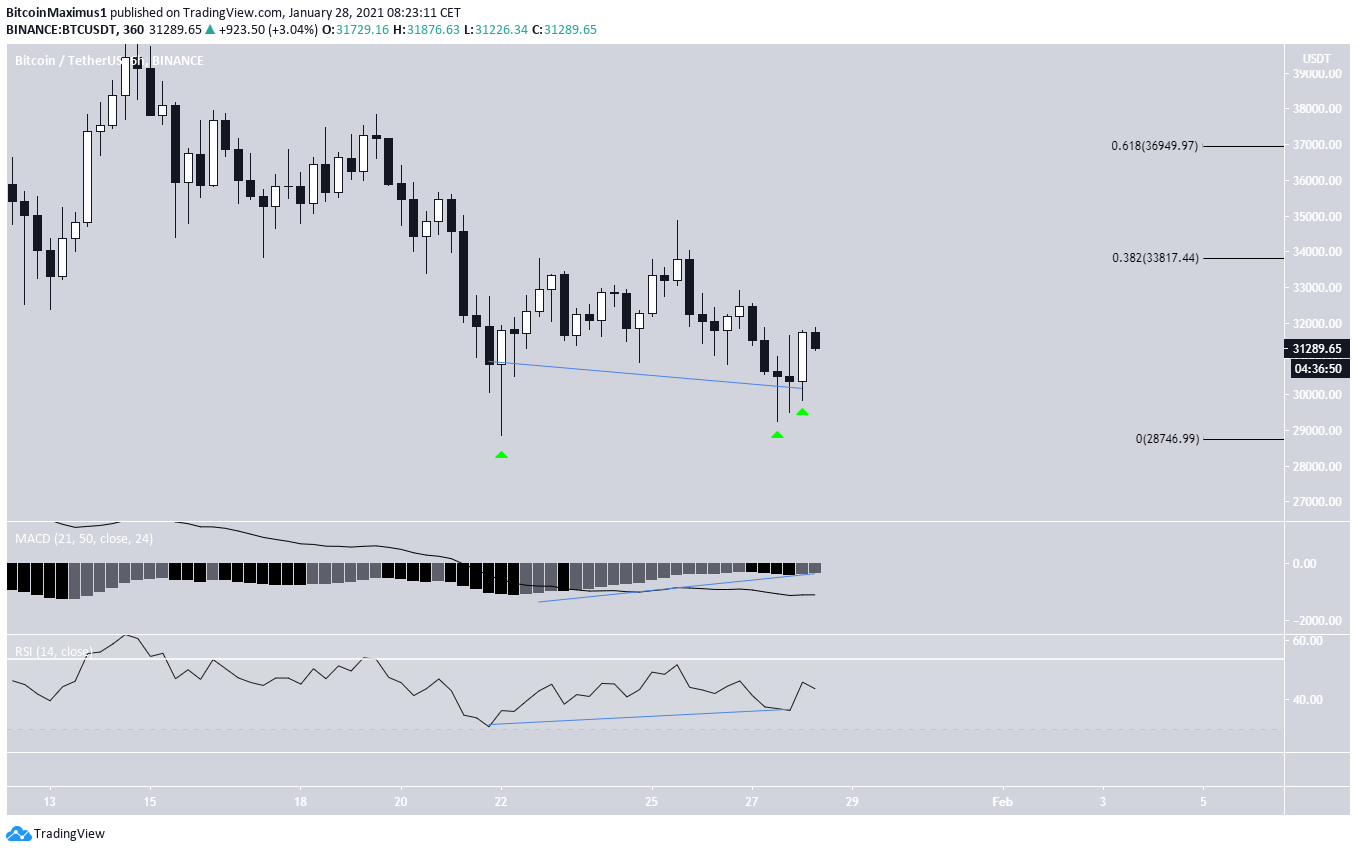
The six-hour chart shows a potential double bottom pattern, which has been combined with a bullish divergence in both the RSI and MACD.
The first bottom was characterized by a bullish hammer, while the second by a bullish engulfing candlestick — both bullish signs.
Readings from this time-frame support the possibility of a bounce.
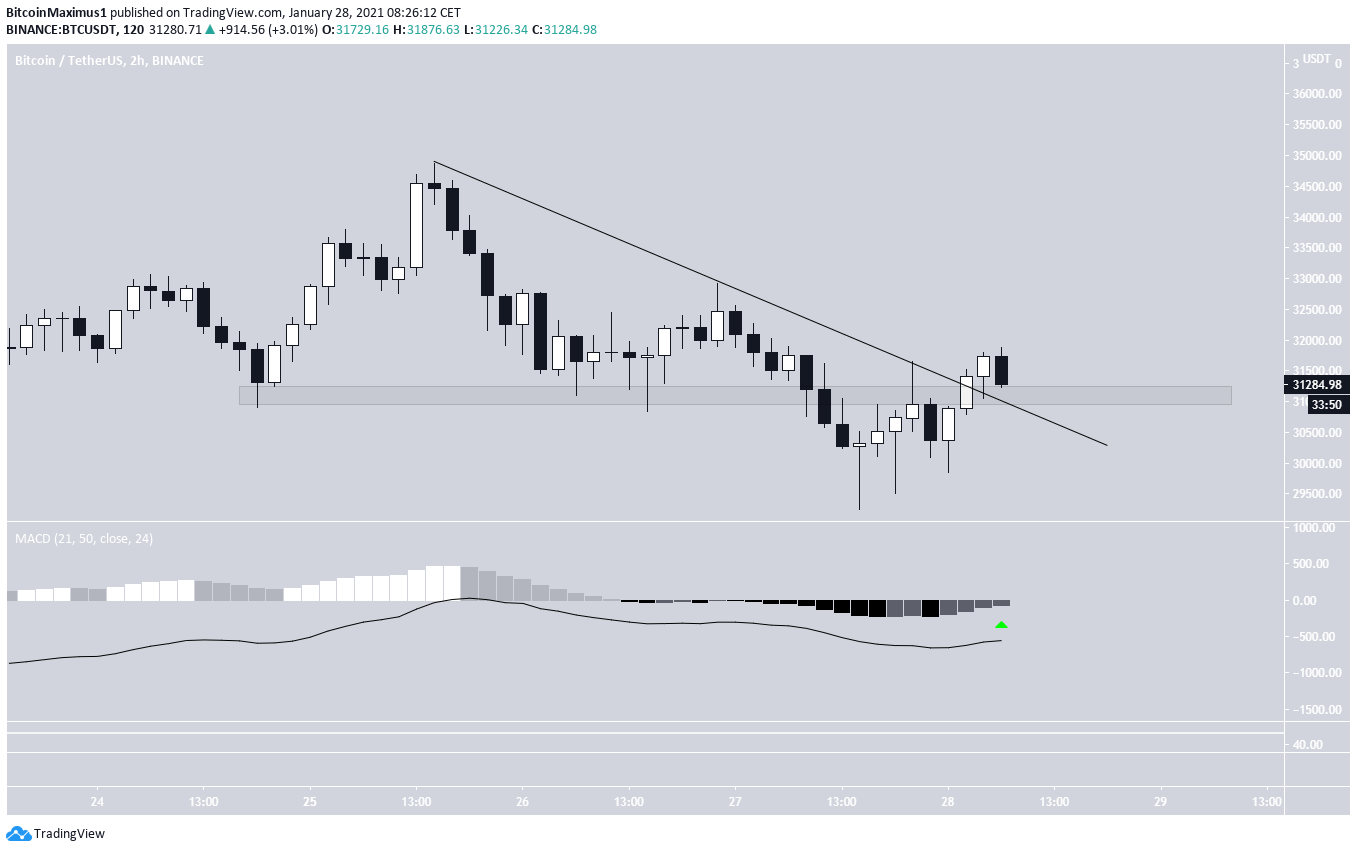
The same thing holds true when looking at the two-hour time-frame.
BTC has broken out from a descending resistance line, and is in the process of validating it as support alongside the horizontal $31,000 support area.
The MACD has also nearly turned positive. Therefore, BTC is expected to continue higher towards $33,800 and possibly $36,900.
Wave Count
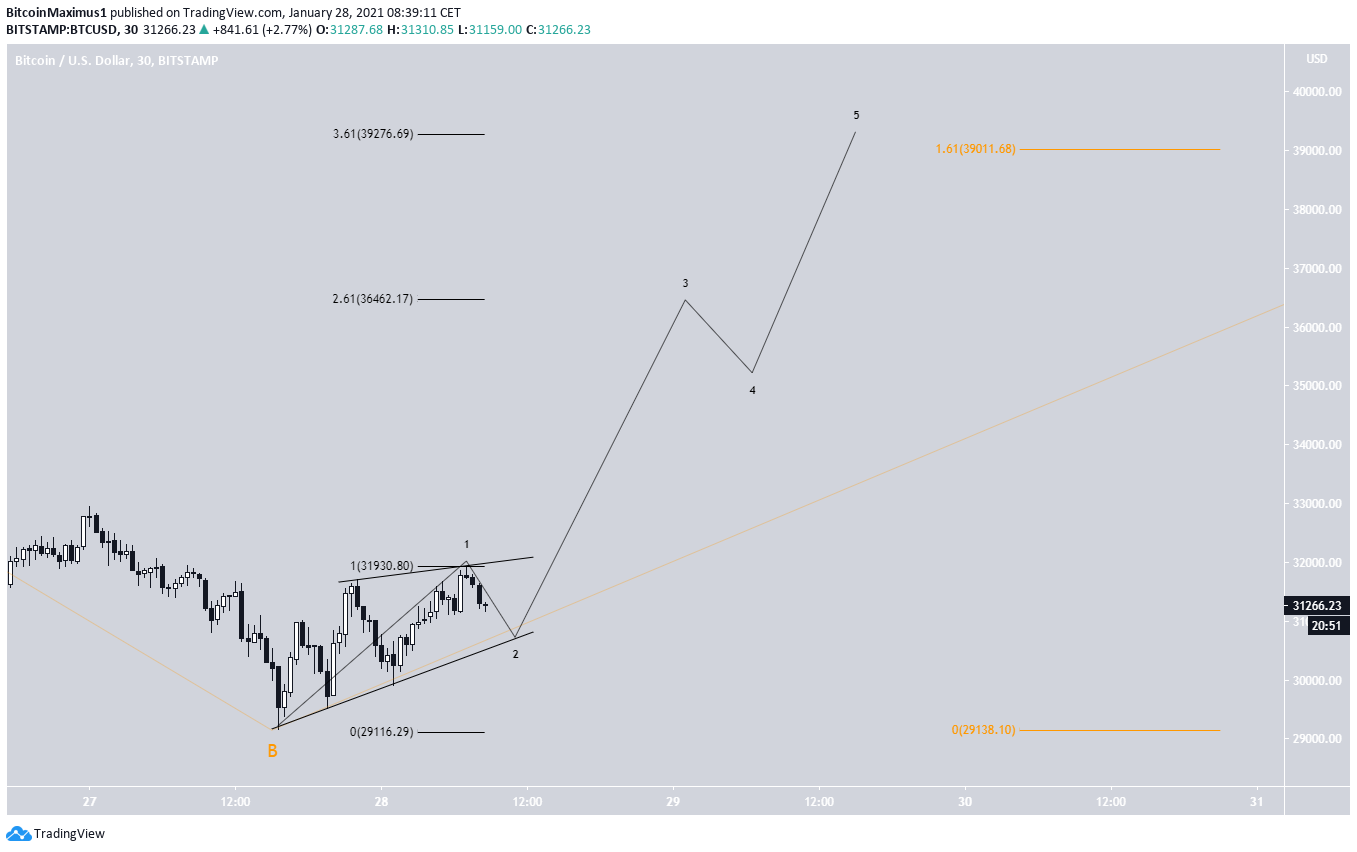
In yesterday’s BeInCrypto Bitcoin wave count article, we stated that
“Bitcoin is in the C wave of an A-B-C correction (orange), which is expected to end between $39,150-$40,108
The possible sub-wave count (black) for the C wave shows what is possibly a leading diagonal, which could end slightly at $39,276, fitting with the longer-term count.”
Nevertheless, this is an extremely short-term count which is bound to be speculative. While the $39,150-$40,108 range is likely to be reached, the outline presented in black could be different.
Conclusion
Bitcoin is expected to bounce and reach the $33,800 resistance area. It could potentially break out and move toward the target range of $39,150-$40,108.