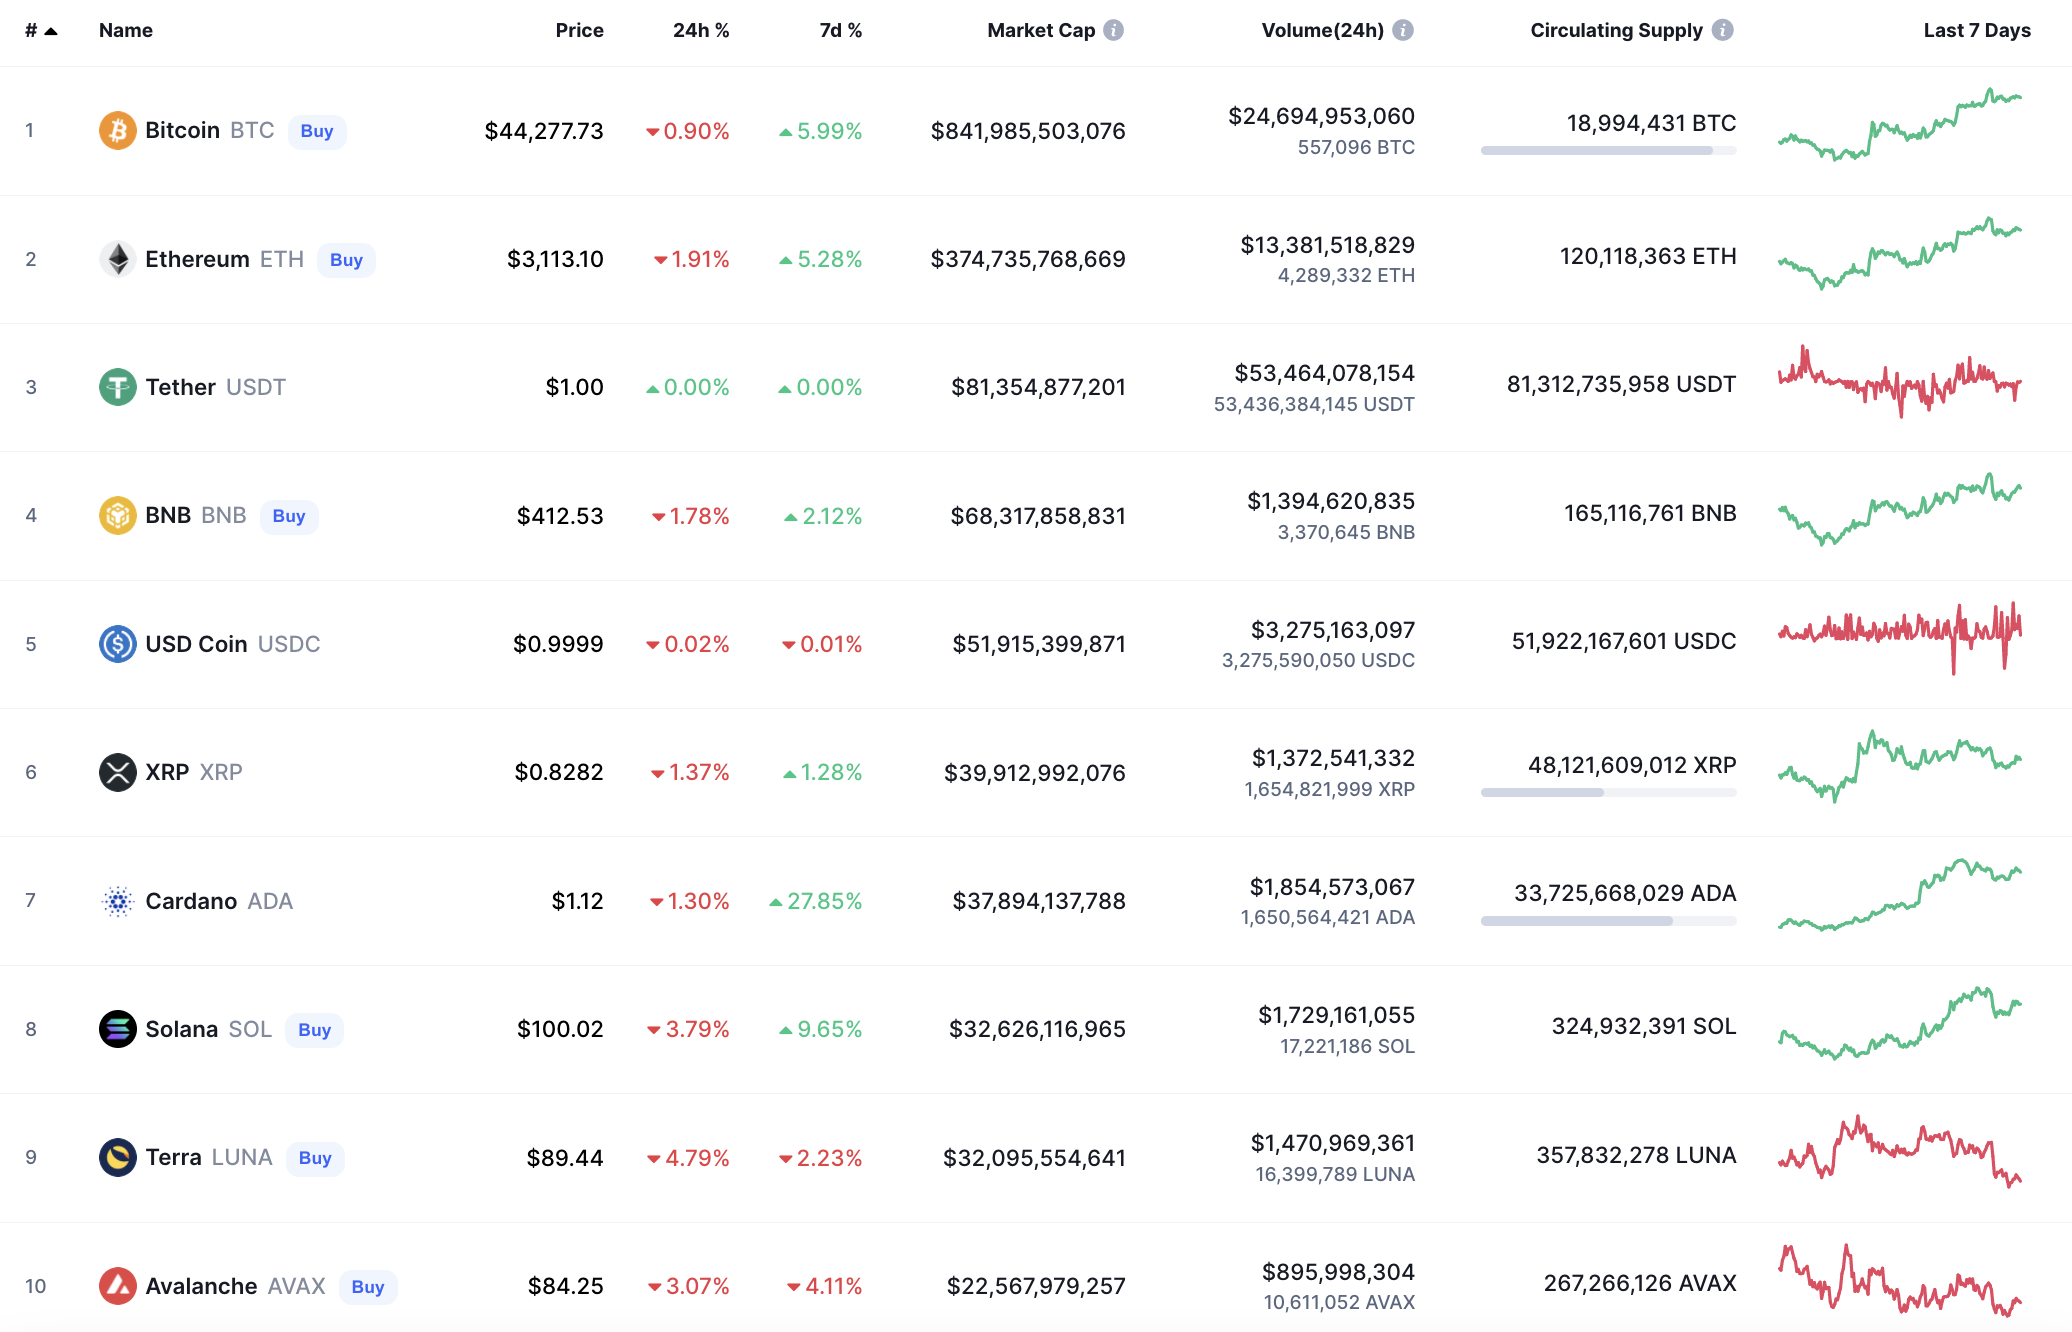
The weekend has begun with the continued correction of the cryptocurrency market as all of the top 10 coins are in the red zone.
BTC/USD
The rate of Bitcoin (BTC) has declined by around 1% over the last 24 hours.
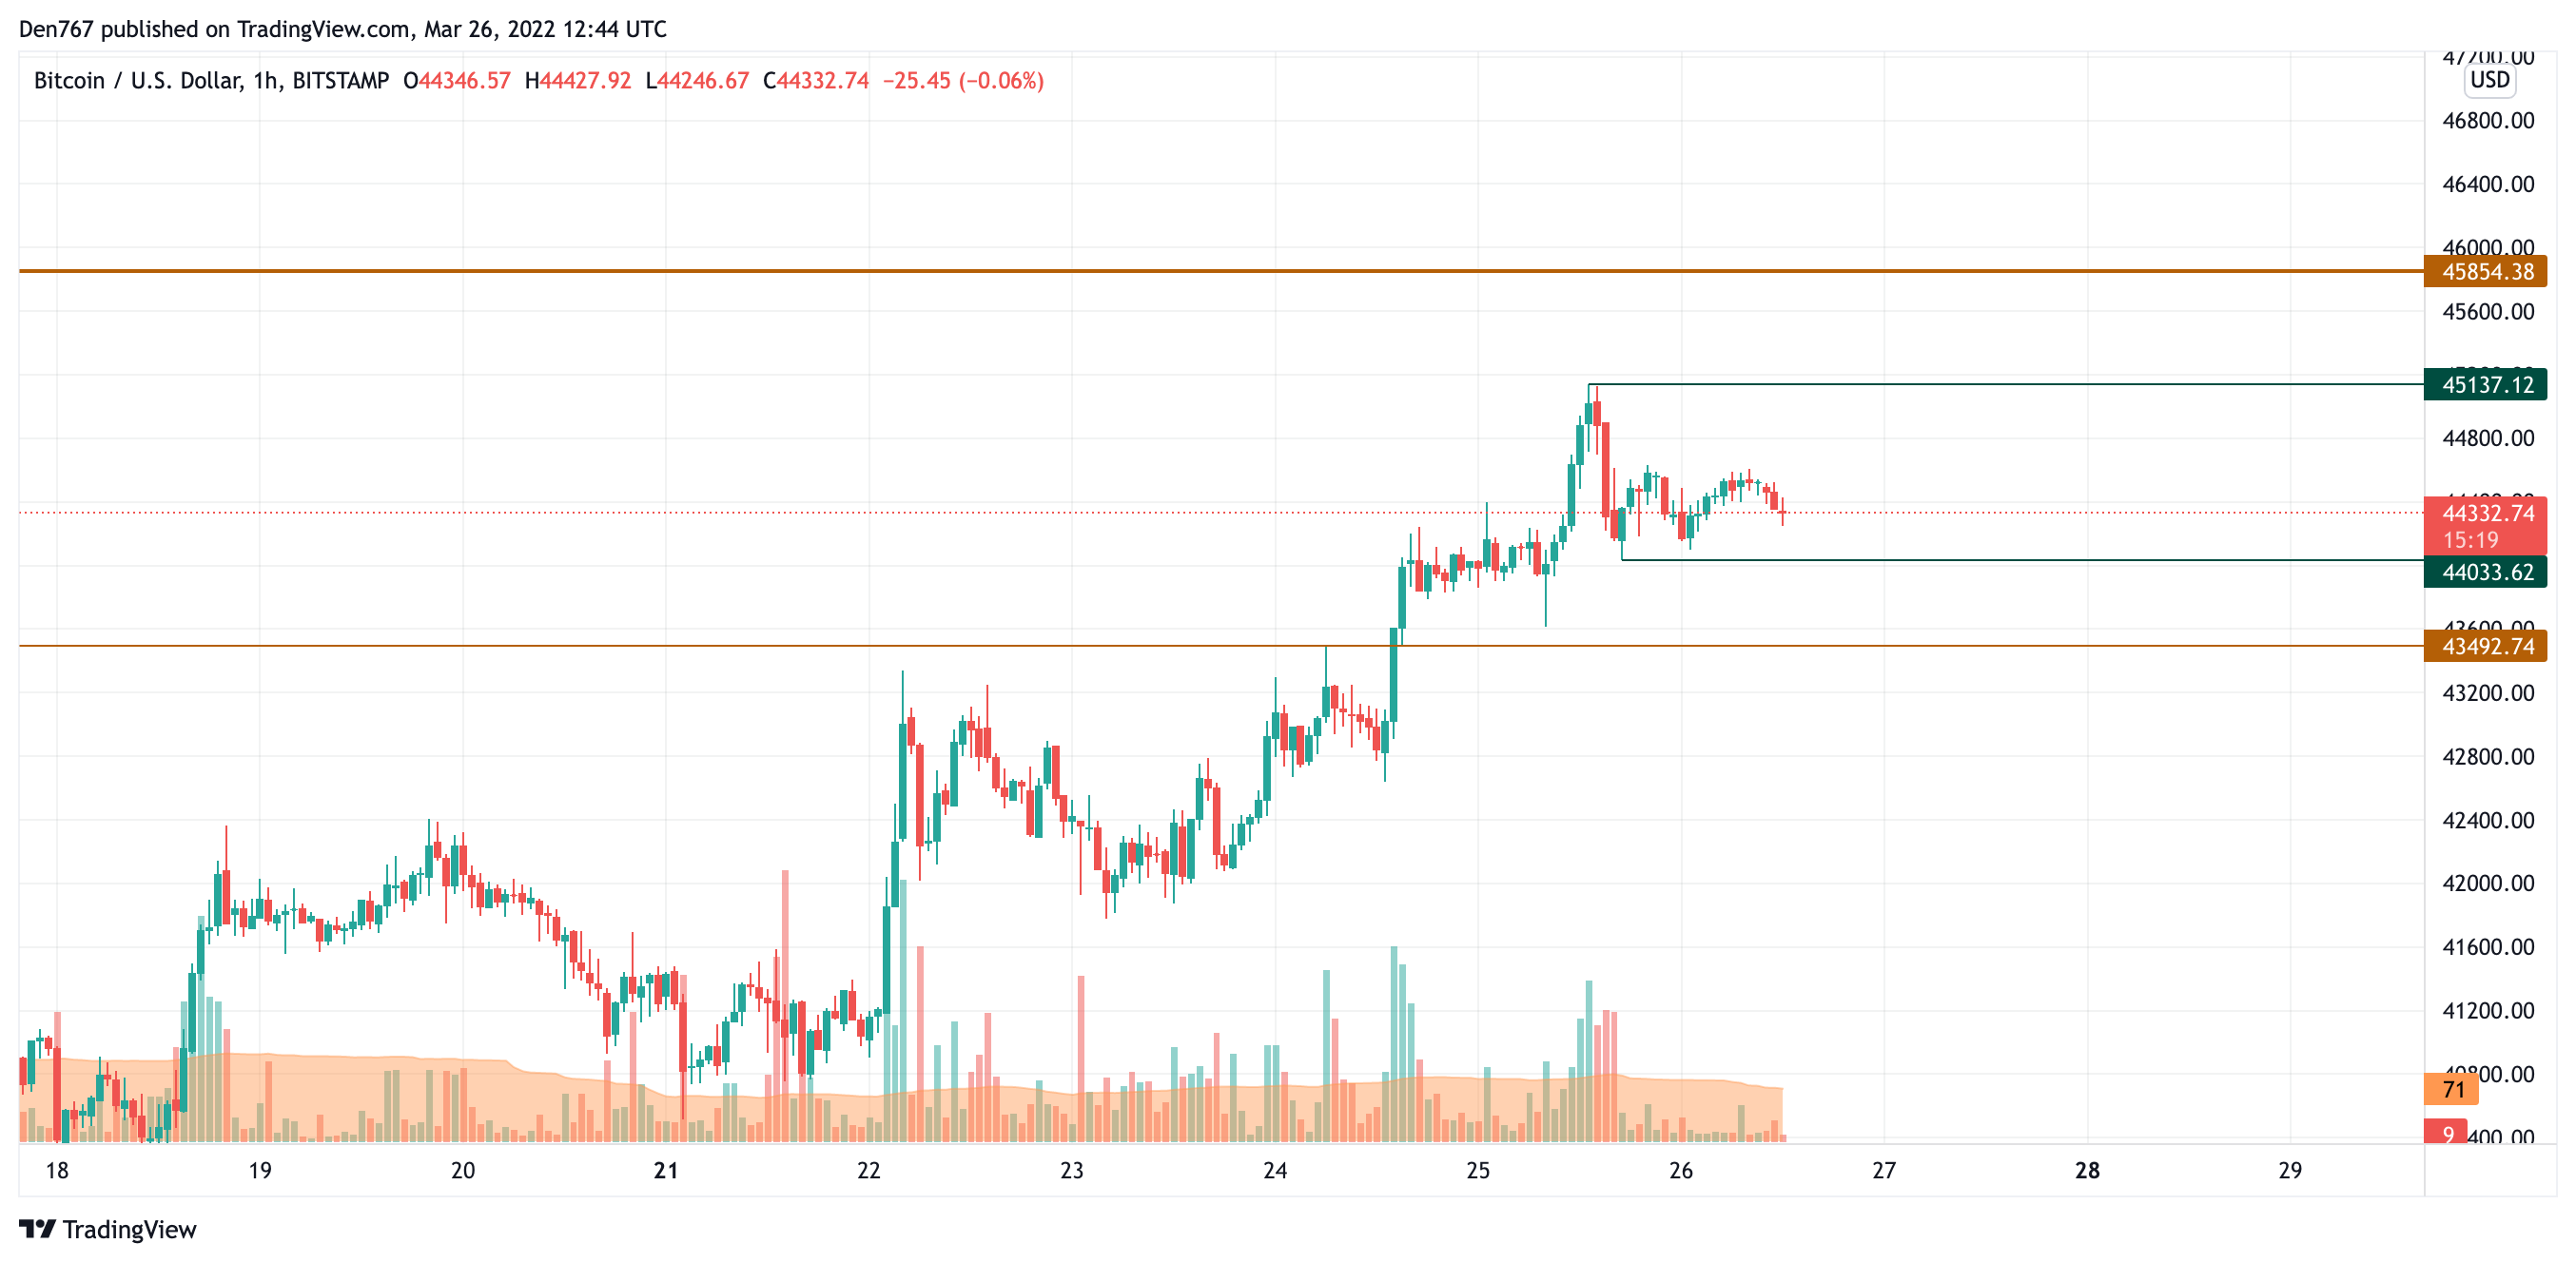
On the hourly chart, Bitcoin (BTC) could not overcome the $44,700 mark, followed by a slight decline. At the moment, one needs to pay close attention to the support level at $44,000. If buyers can hold it, there is a chance to see further growth.
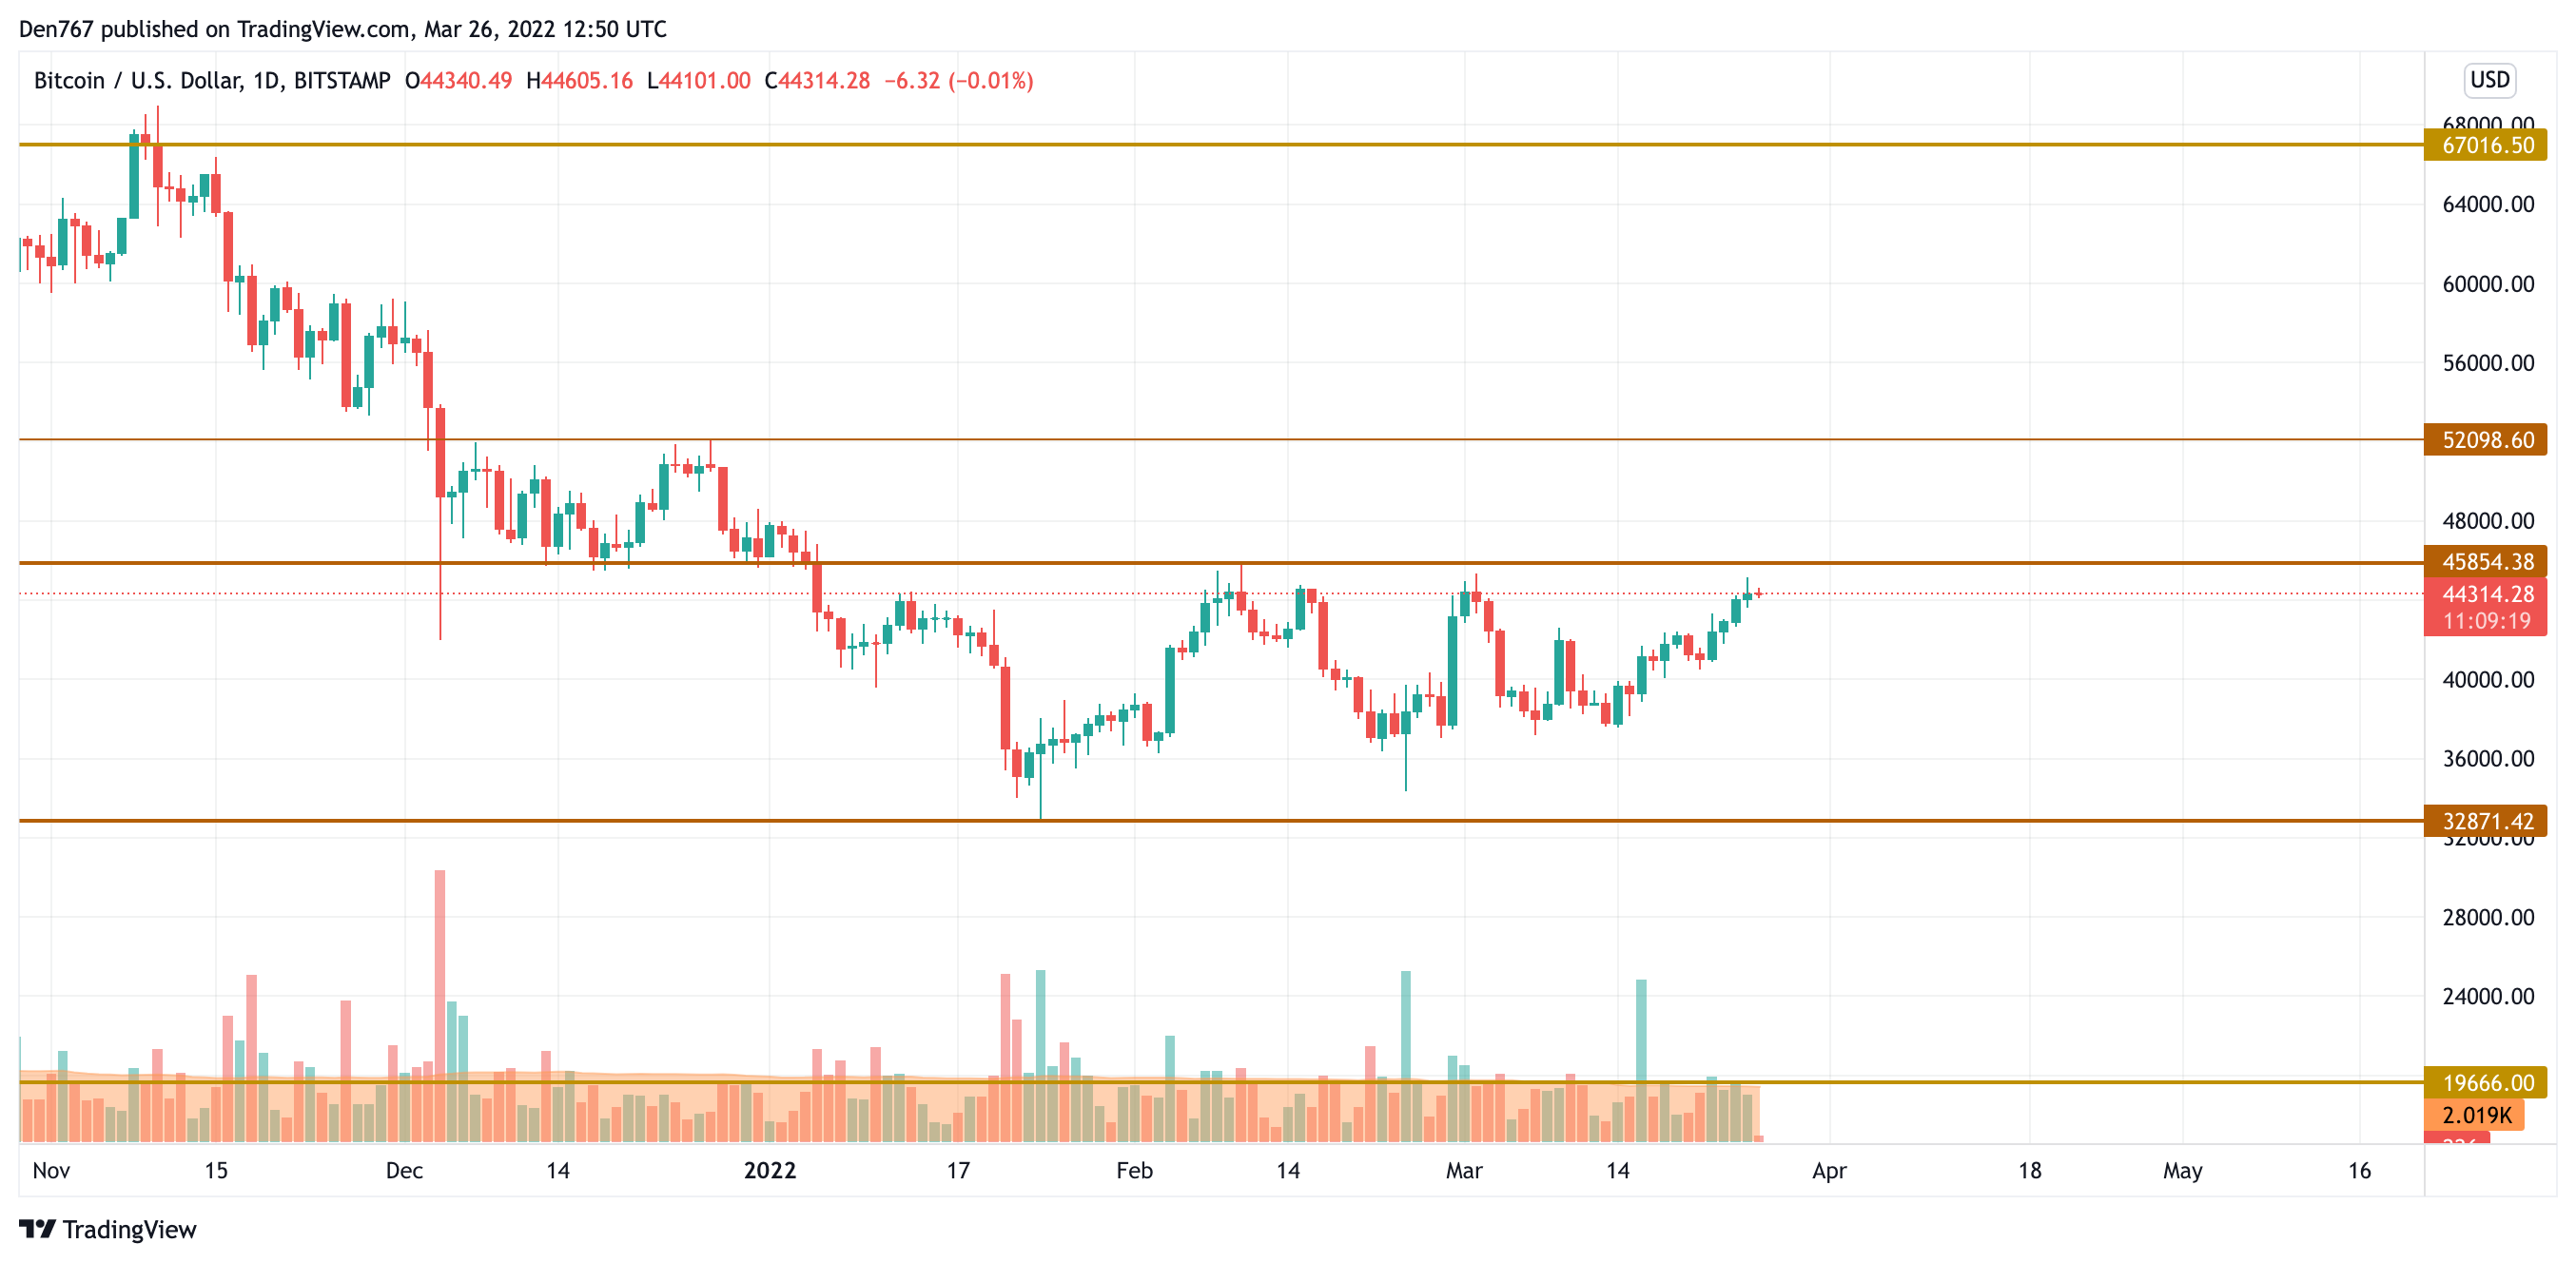
Bitcoin (BTC) has approached the resistance level at $45,854 and is currently trading near it. If the daily candle fixes around the zone of $44,000-$44,500, there is a high probability to expect a breakout next week.
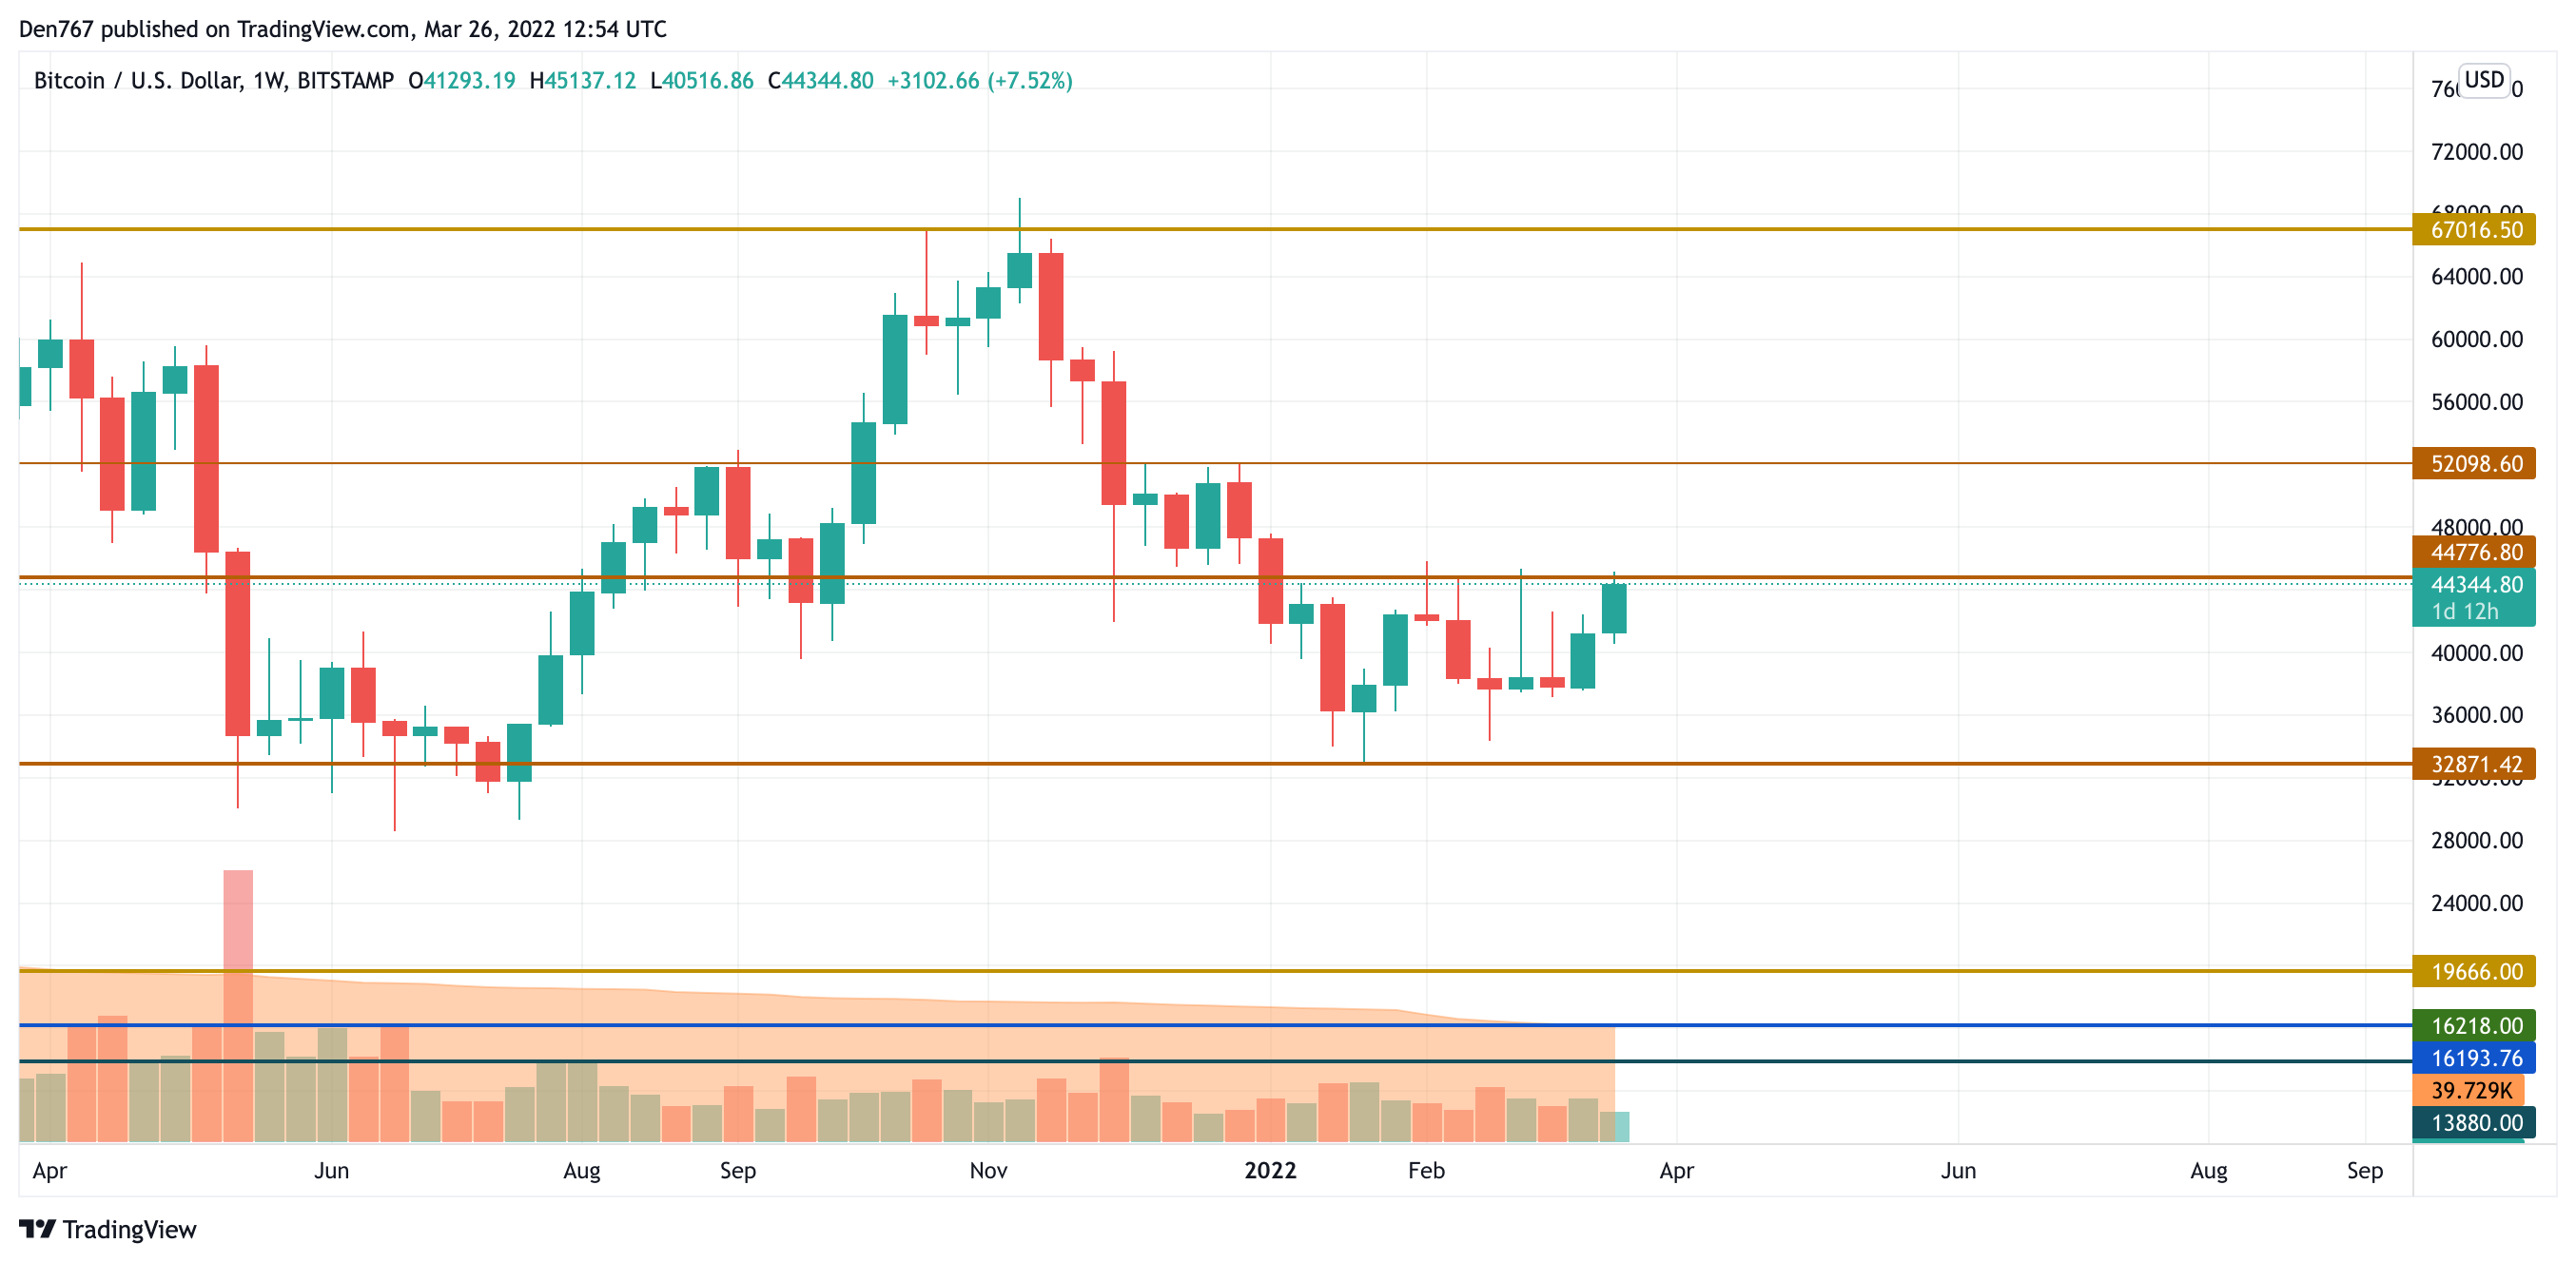
The weekly chart is looking bullish as the the rate has come close to the vital level of $44,776.
If the trading volume increases, a further upward move up to the $50,000 zone may happen by mid-April.
Bitcoin is trading at $44,344 at press time.