Bitcoin declined heavily from the $10,000 resistance against the US Dollar. BTC is currently correcting higher and it seems like the bulls are likely to push the price back above $9,000.
- Bitcoin found support above the key $8,200 and $8,000 pivot levels.
- A low is formed at $8,267 and the price is currently correcting higher.
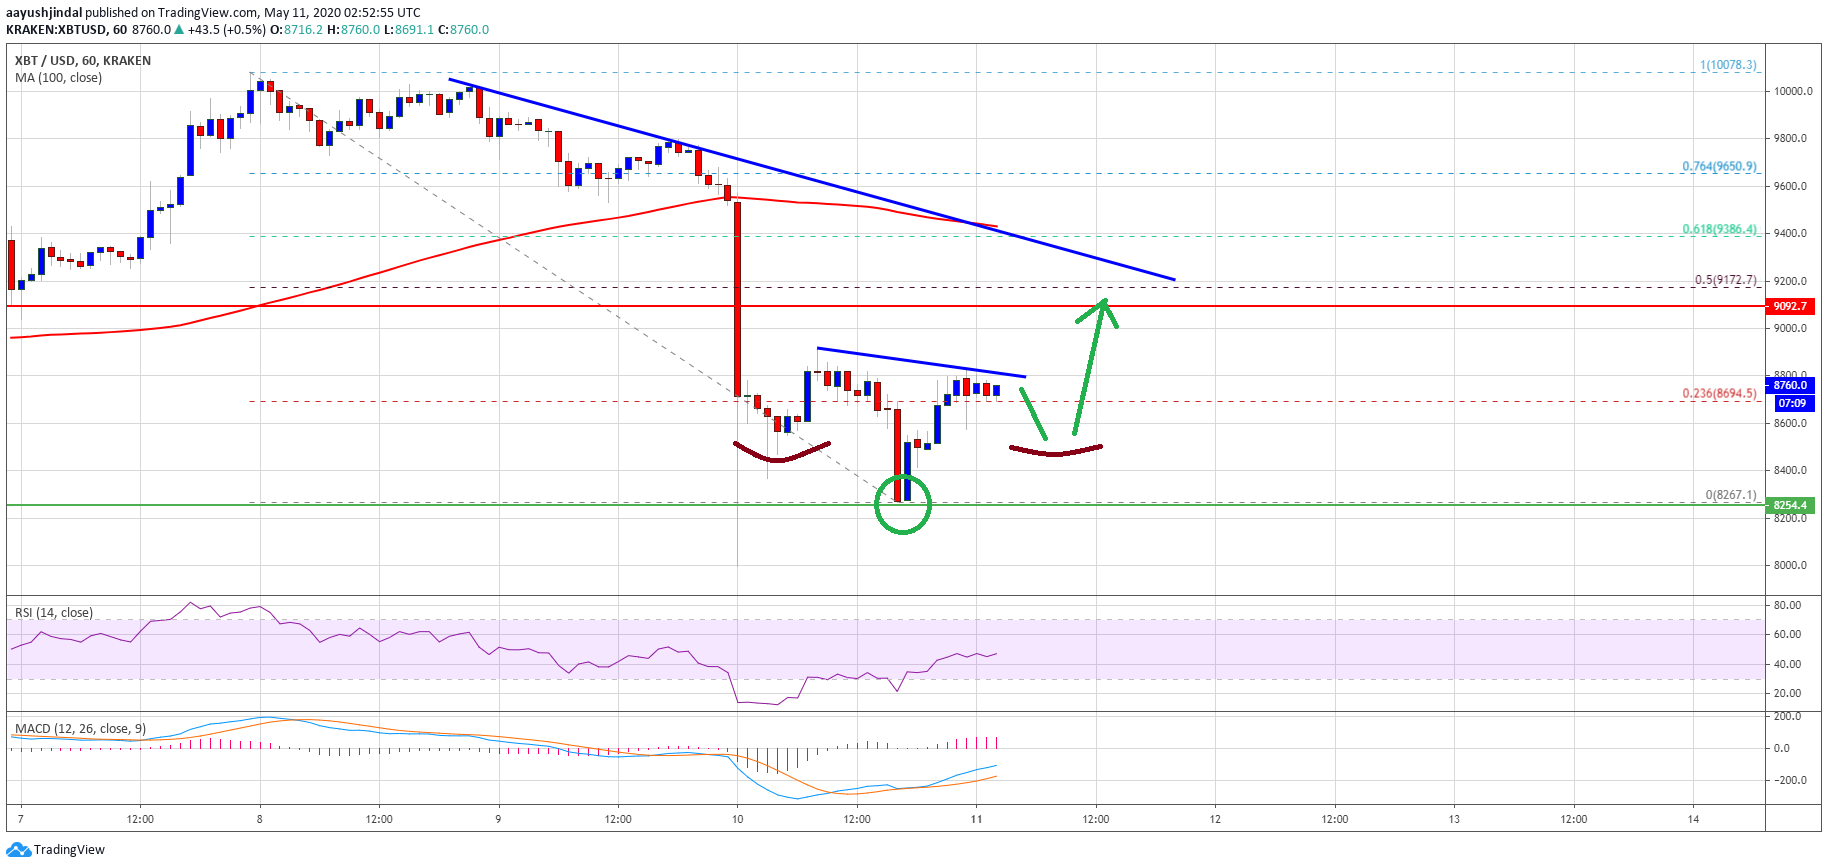
- There is a short term bearish trend line forming with resistance near $8,800 on the hourly chart of the BTC/USD pair (data feed from Kraken).
- It seems like there is an inverse head and shoulders pattern forming with resistance near $8,800.
Bitcoin Could Start Fresh Increase
After a strong rally, bitcoin price failed to settle above the $10,000 resistance against the US Dollar. BTC price started a nasty decline below the $9,000 support and the 100 hourly simple moving average.
The bears were able to push the price below the $8,500 support, but it found support above the key $8,200 and $8,000 pivot levels. A low is formed near the $8,267 level and the price is currently correcting higher.
There was a break above the $8,500 resistance level. Bitcoin is now trading above the 23.6% Fib retracement level of the downward move from the $10,078 high to $8,267 low. On the upside, the $8,800 level is acting as a major hurdle for more gains.
It seems like there is an inverse head and shoulders pattern forming with resistance near $8,800. More importantly, there is a short term bearish trend line forming with resistance near $8,800 on the hourly chart of the BTC/USD pair.
Bitcoin Price
In the short term, there could be a minor dip to form the right should properly near the $8,550 zone. To start a sustained upward move, the price must clear the trend line resistance at $8,800.
The next key resistance is near the $9,100 and $9,150 levels. The 50% Fib retracement level of the downward move from the $10,078 high to $8,267 low might also act as a hurdle near $9,175 in the near term.
Downside Continuation?
If bitcoin price fails to clear the $8,800 resistance, it could resume its decline below the $8,600 and $8,550 levels. The first key support is near the $8,200 level.
The next major support is waiting near the $8,000 level (as discussed in the weekly analysis). If there is a bearish close below $8,000, the price could start another significant decline towards $7,500.
Technical indicators:
Hourly MACD – The MACD is currently moving nicely in the bullish zone.
Hourly RSI (Relative Strength Index) – The RSI for BTC/USD is currently approaching the 50 level.
Major Support Levels – $8,600 followed by $8,550.
Major Resistance Levels – $8,800, $9,000 and $9,175.