
Bitcoin’s market performance on Nov. 12, 2025, painted a portrait of cautious optimism, highlighted by formidable resistance and a tug-of-war between momentum and hesitation. Priced at values between $104,779 to $105,153 over the last hour, bitcoin hovered near the top of its intraday range of $102,461 to $105,257, backed by a market cap of $2.09 trillion and $64.60 billion in 24-hour trading volume.
Bitcoin Chart Outlook
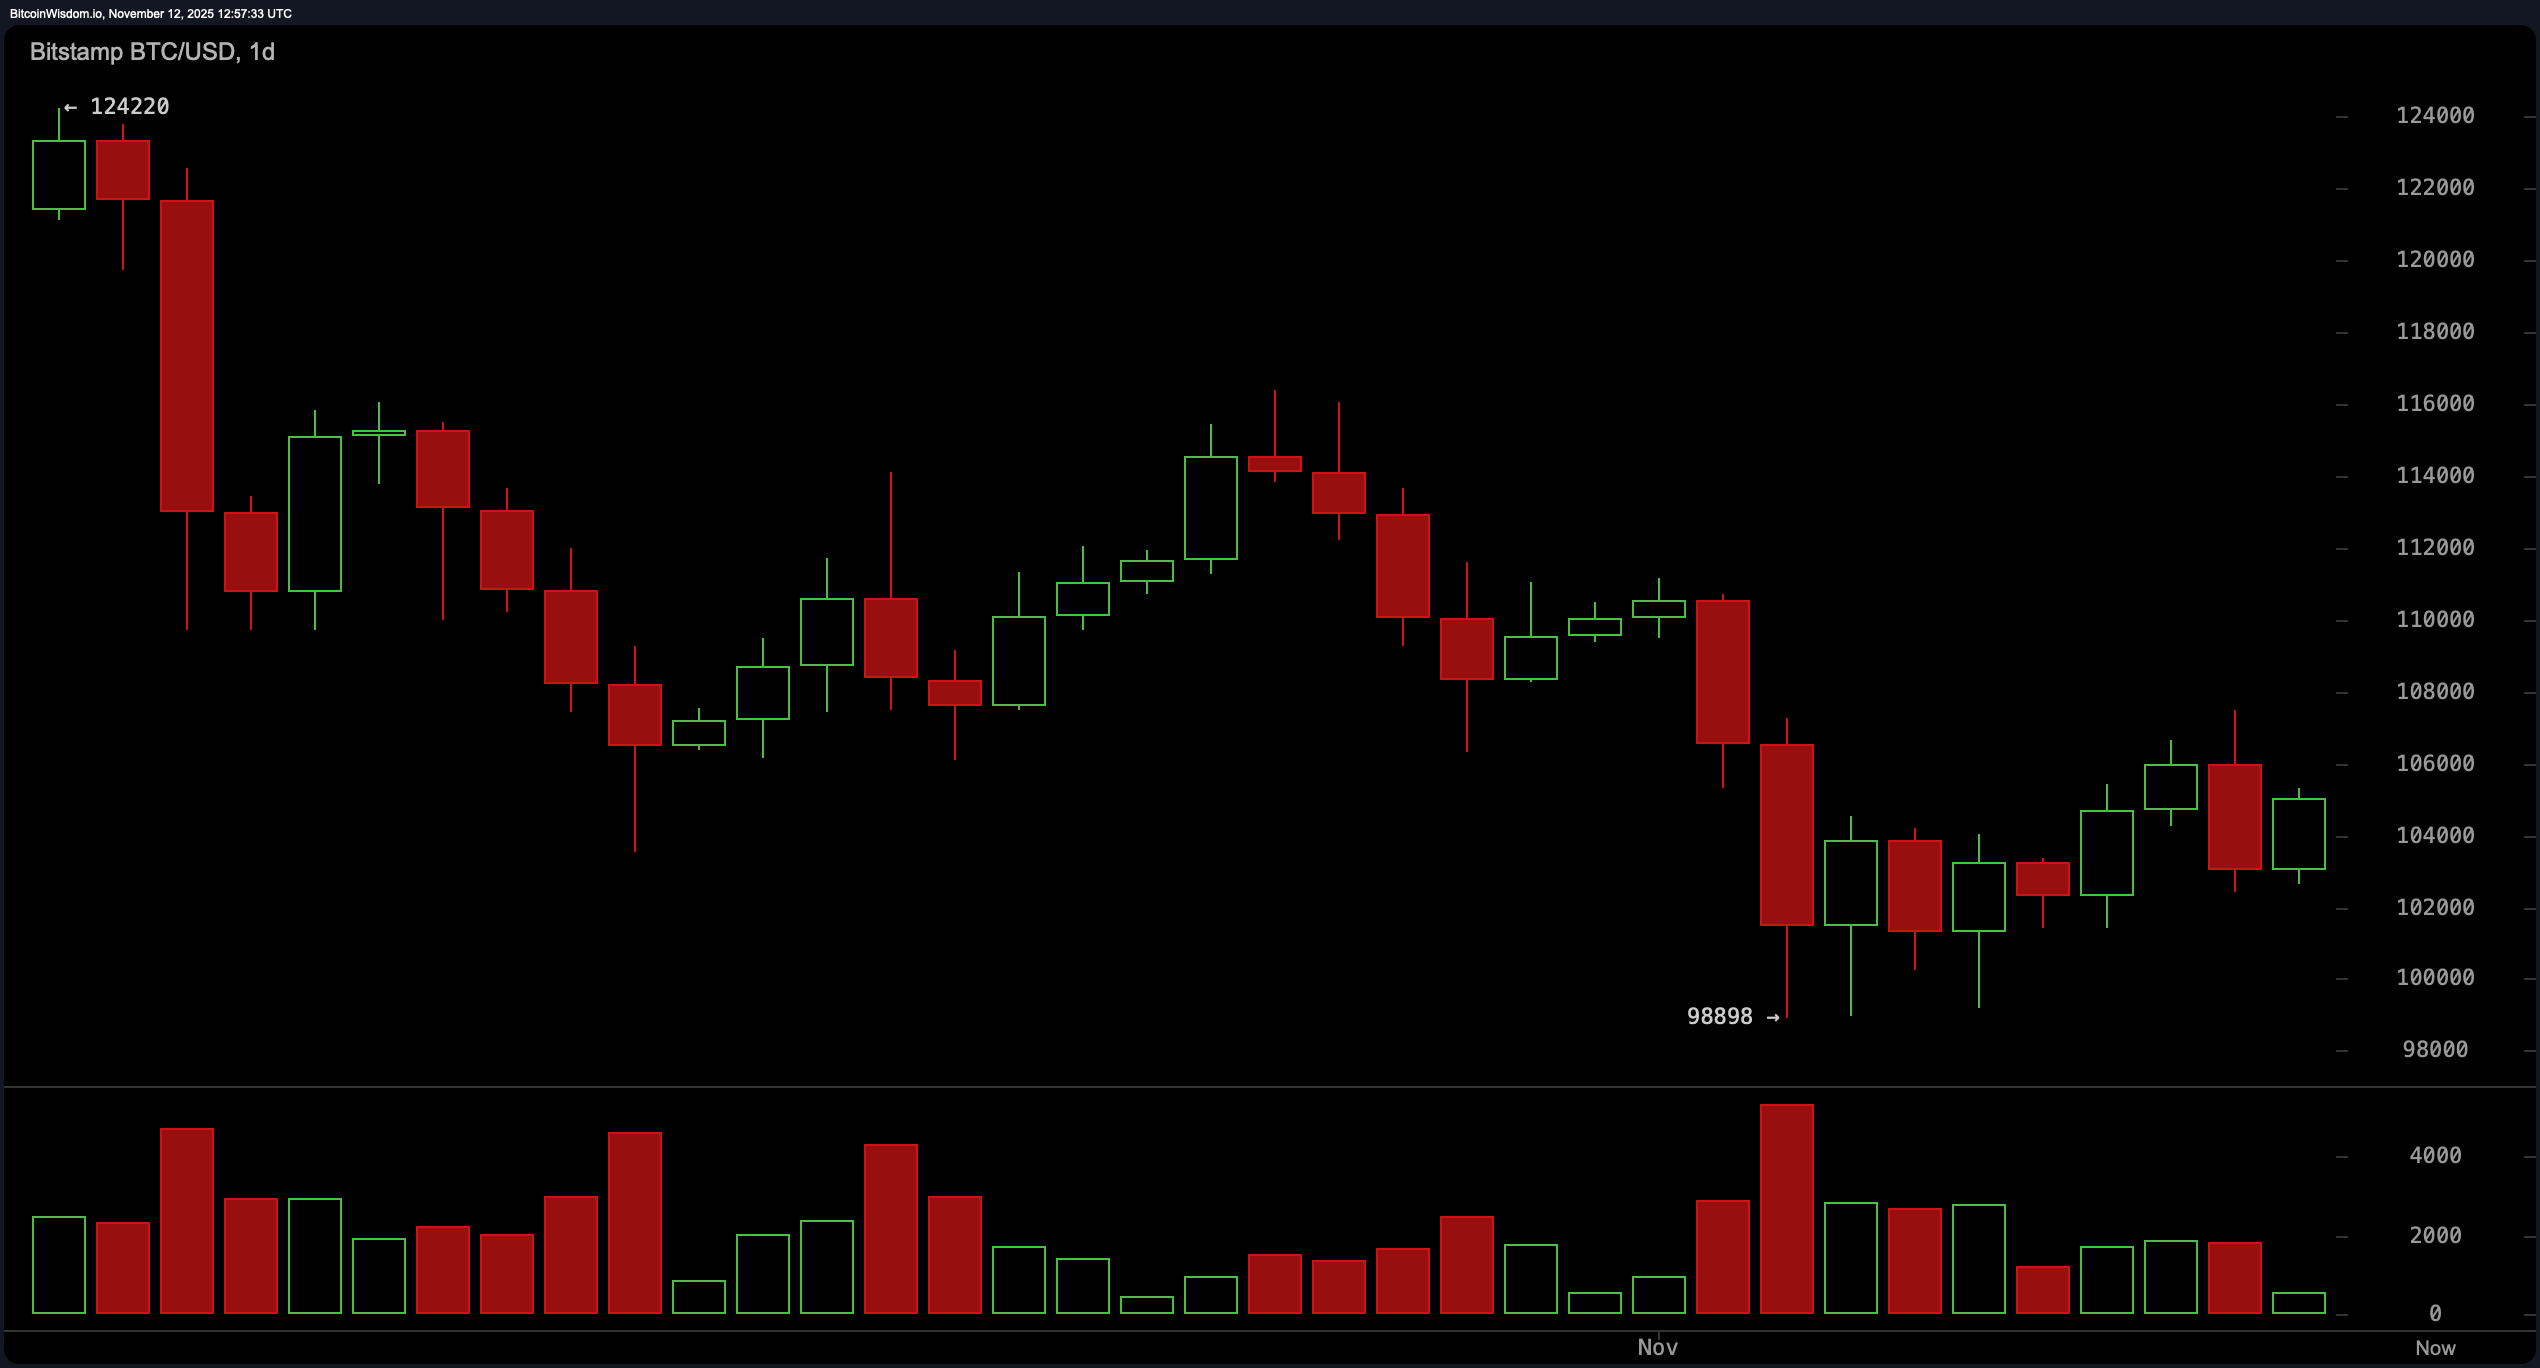
From a daily standpoint, bitcoin remains in a broader downtrend after cascading from its $124,220 high to a trough at $98,898. Recent price action shows a possible double bottom near the $99,000 support, with faint green candles signaling an attempted rebound.
However, the volume tells a more skeptical tale—waning enthusiasm as prices lift, which points to fragile bullish conviction. The $110,000 mark stands tall as macro resistance, and until bulls can muscle through it with volume, the ceiling remains solid.
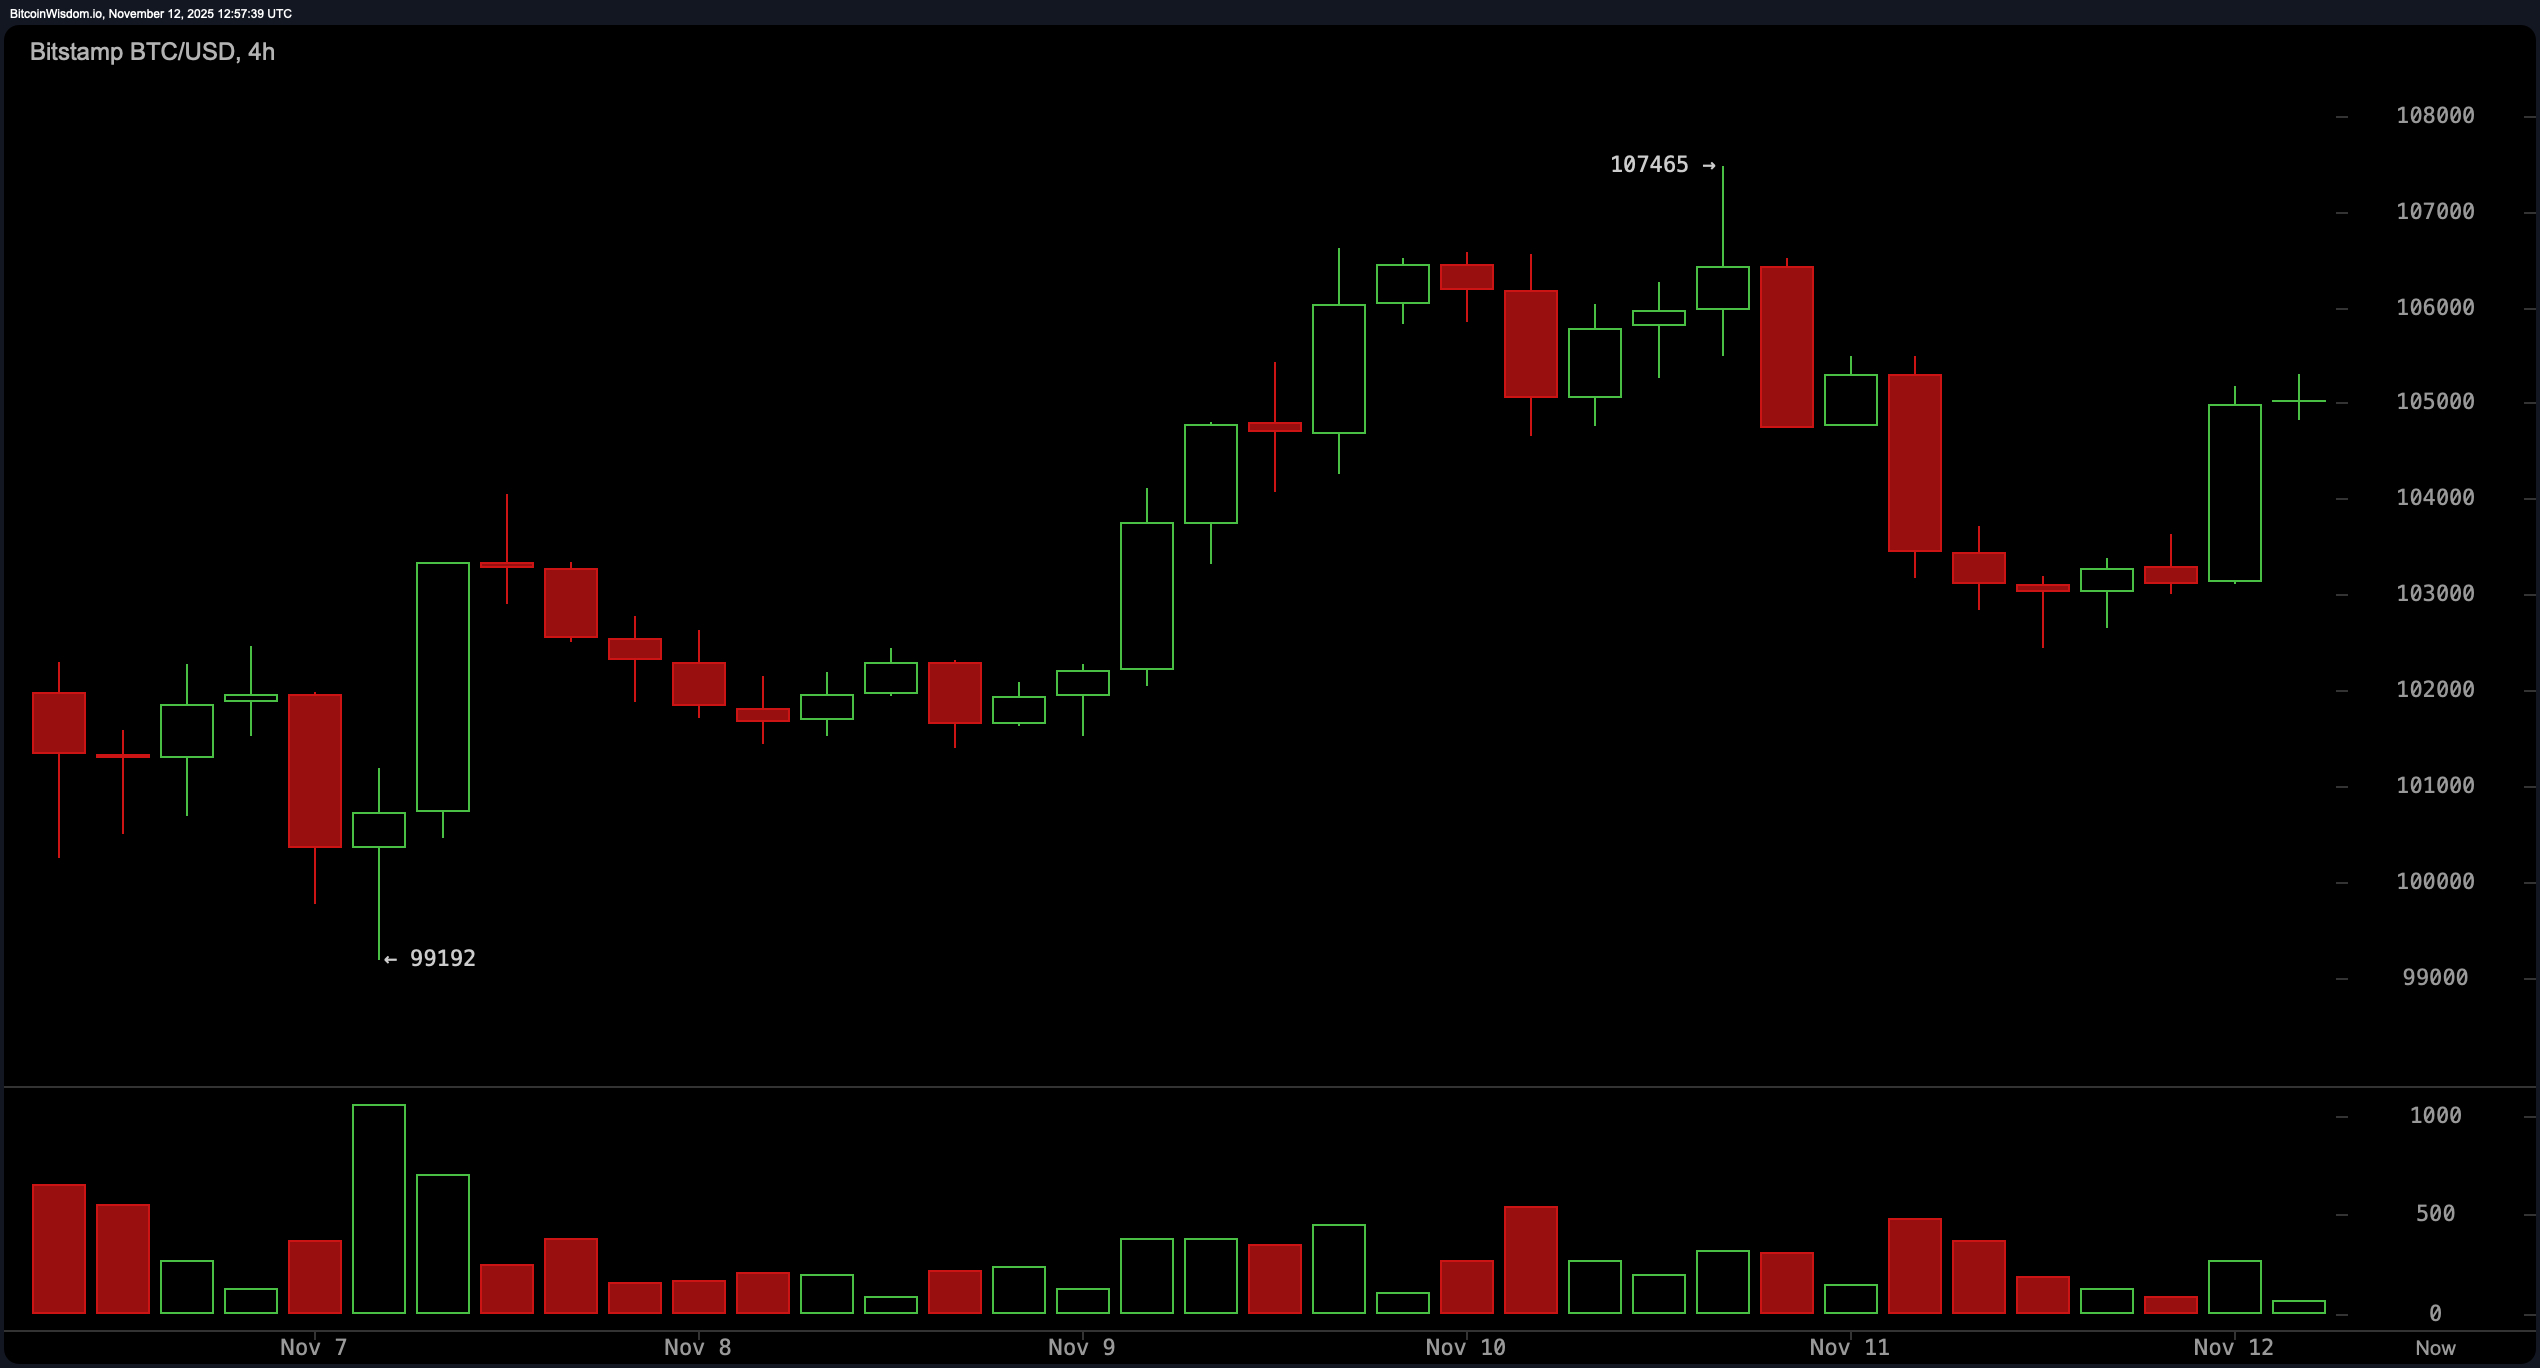
Zooming in on the 4-hour chart, the mood turns more constructive. Bitcoin has climbed from $99,192 to $107,465 in a steady formation of higher highs and higher lows. Despite a temporary stumble to $103,000, the swift recovery suggests dip-hunting traders are alive and kicking. The support zone at $103,000–$104,000 is holding the line well, but any close below that range would put the short-term uptrend in jeopardy faster than a caffeine crash at midnight.
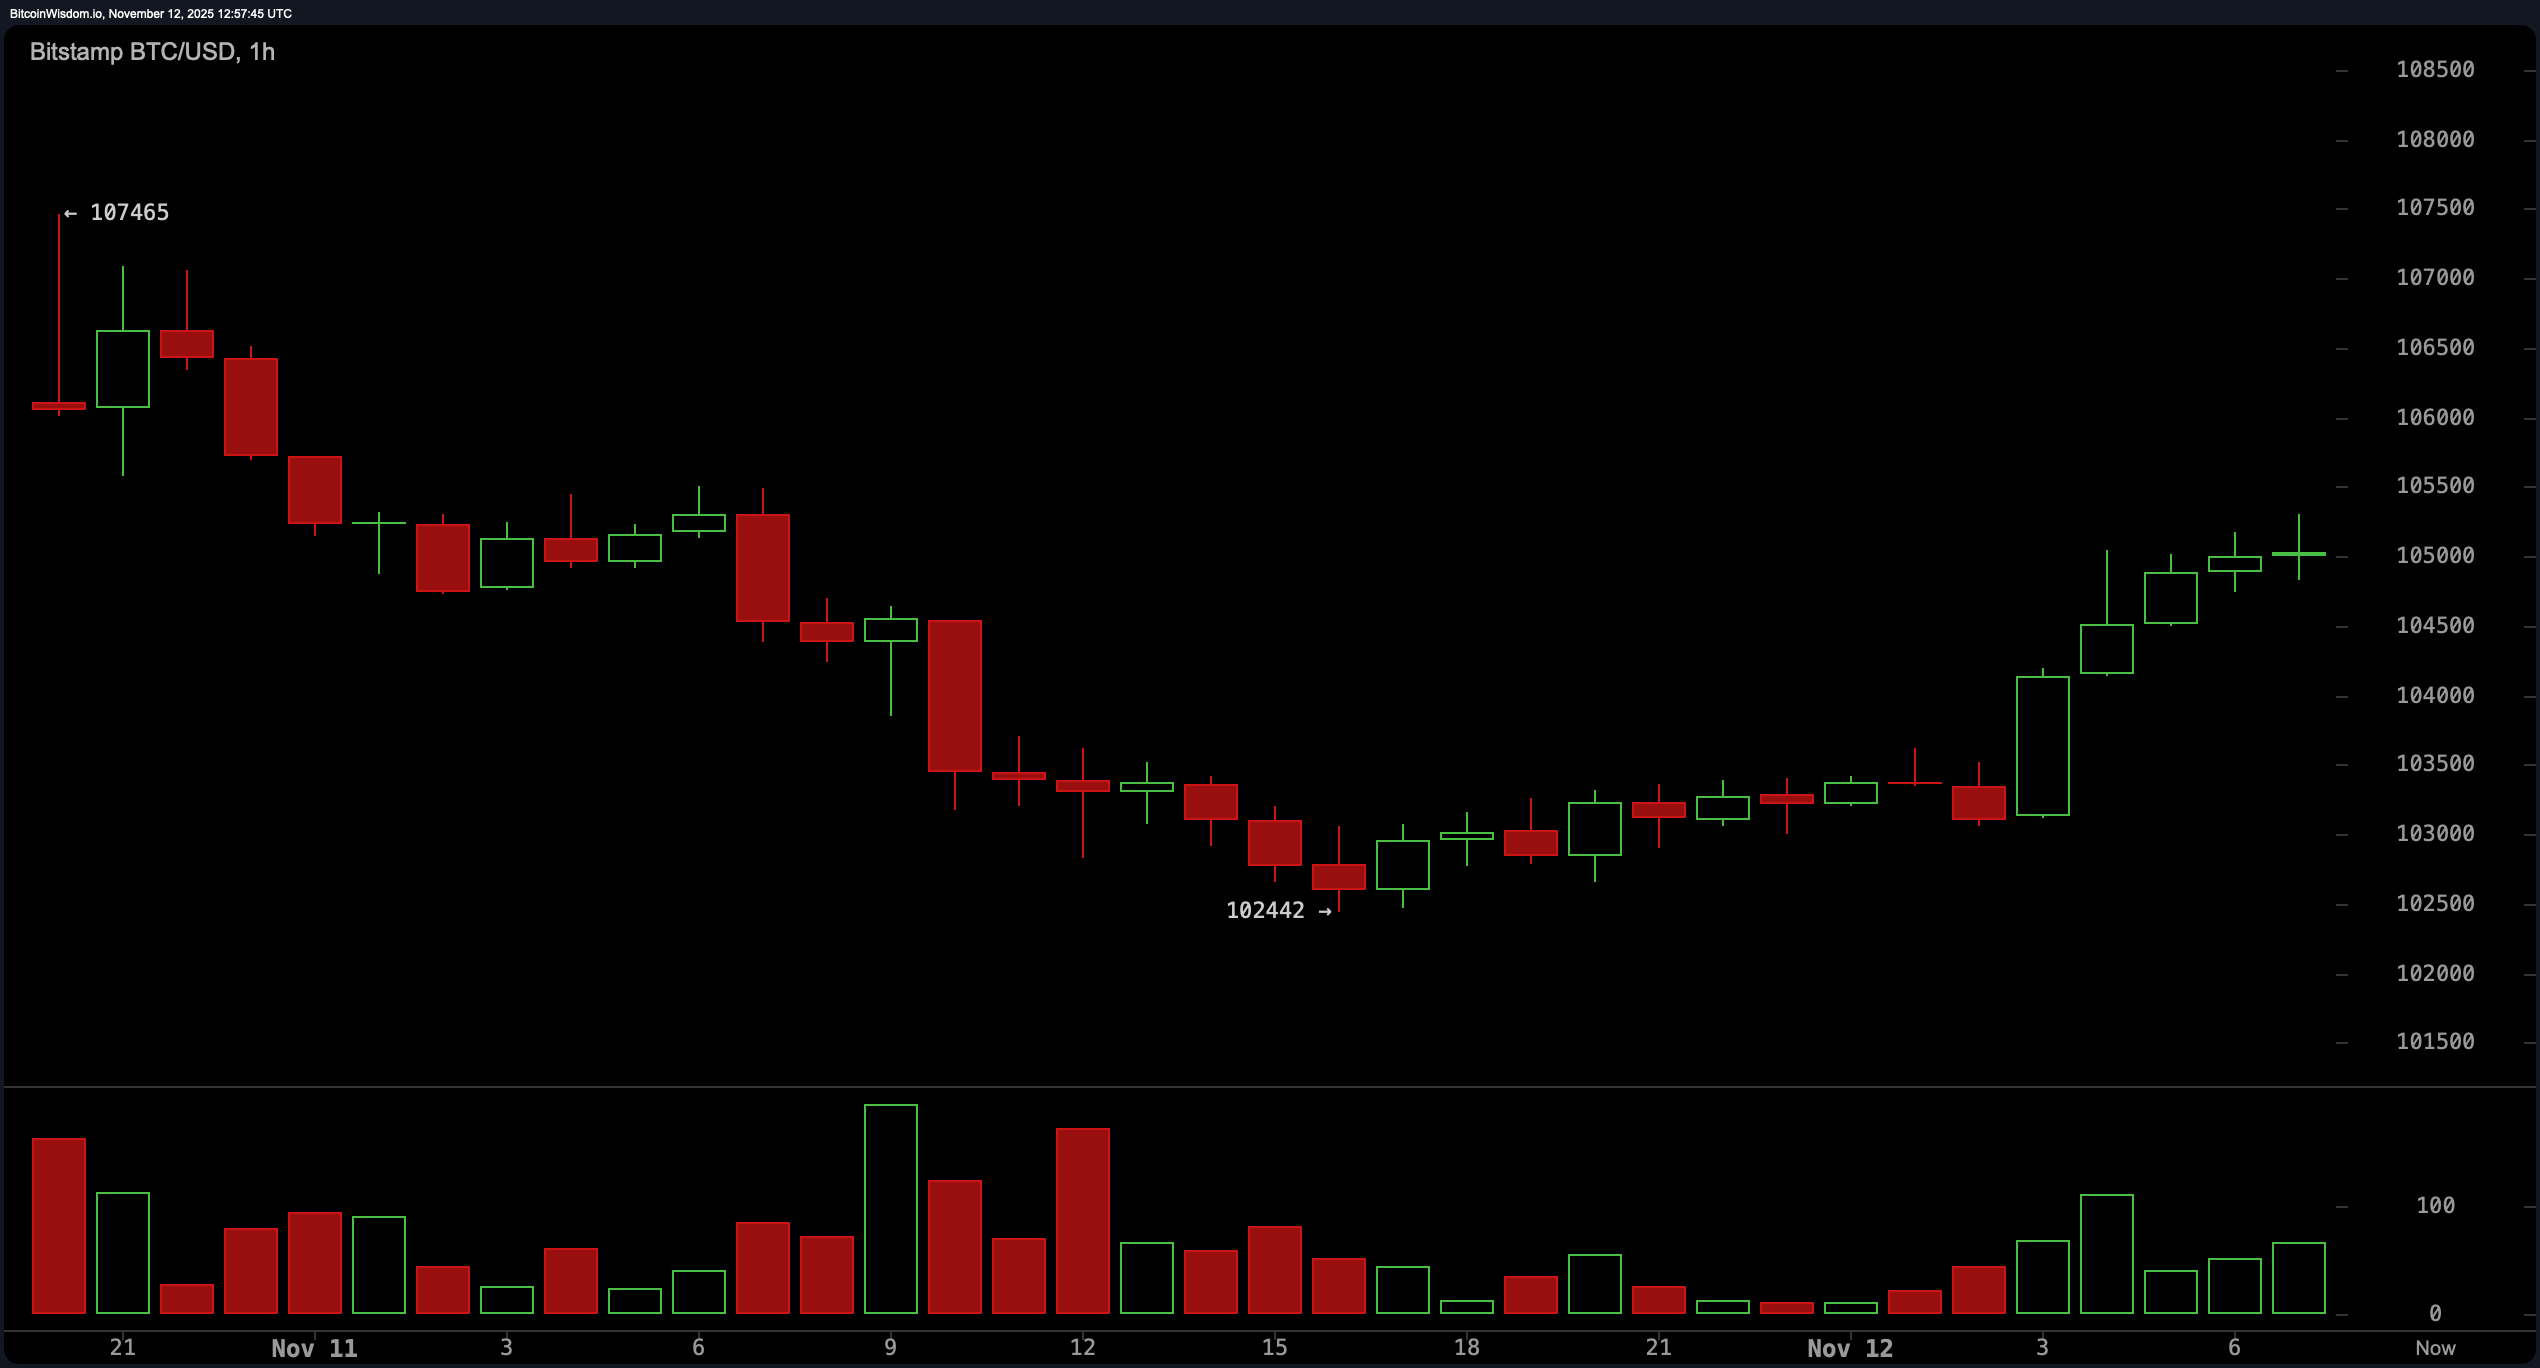
The hourly chart displays the most enthusiasm, reflecting a sharp rebound from $102,442 to a local high of $105,500. Green volume spikes support the bullish tone, hinting that lower-timeframe players are pressing their advantage. That said, the $105,500 resistance is acting like an overprotective bouncer at a velvet-rope club. Unless there’s a surge in volume to force the doors open, a pullback wouldn’t surprise anyone paying attention.
Oscillator indicators are collectively playing the middle ground. The relative strength index (RSI) at 45, stochastic at 39, commodity channel index (CCI) at -56, average directional index (ADX) at 26, and awesome oscillator at -4,800 all flash neutrality. Momentum alone offers an optimistic reading with a value of -5,506—indicating some directional bias—but the moving average convergence divergence (MACD) at -2,271 leans toward further weakness, underscoring indecision in the current setup.
The moving averages ensemble is singing a familiar song: short-term strength, longer-term skepticism. Both the 10-period exponential moving average (EMA) and simple moving average (SMA) hover near $104,000 and suggest support. However, from the 20-period through the 200-period, both exponential and simple moving averages lean downward, waving red flags above $106,000. Unless bitcoin stages a confident close above $110,000 with volume to match, the current trend remains vulnerable to turbulence.
Bull Verdict:
If bitcoin continues to defend the $103,000–$104,000 support zone and manages to break above $105,500 with conviction, there’s potential for a rally toward the $110,000 resistance. Sustained volume on upward moves and confirmation of the double bottom on the daily chart would set the stage for a shift in momentum, turning short-term optimism into a broader recovery attempt.
Bear Verdict:
Failure to hold above $103,000—especially with the weight of the long-term moving averages pressing downward—could open the door to a retest of $99,000 or lower. With momentum indicators still conflicted and volume fading on rebounds, the current bounce risks being nothing more than a dead-cat scamper unless bulls show stronger follow-through.
FAQ ❓
- What is bitcoin’s price today? Bitcoin is trading between $104,779 to $105,153 as of Nov. 12, 2025 at 8:50 a.m. EST.
- What is the key resistance level for bitcoin now?The major resistance is near $110,000, a level bulls must clear to shift the trend.
- Where is bitcoin’s strongest support?The $103,000–$104,000 zone is acting as critical short-term support.
- Is bitcoin showing bullish or bearish signs?Short-term charts suggest bullish momentum, but broader trends remain bearish.