The falling wedge is characterized by converging downward trendlines that form as selling pressure wanes and the price consolidates in a tightening range. Historically, this pattern precedes upward breakouts, signaling a potential reversal from bearish momentum to renewed buying interest.
The appearance of this pattern in $BTC means that the ongoing correction that has spooked traders might be setting the stage for its next leg higher.
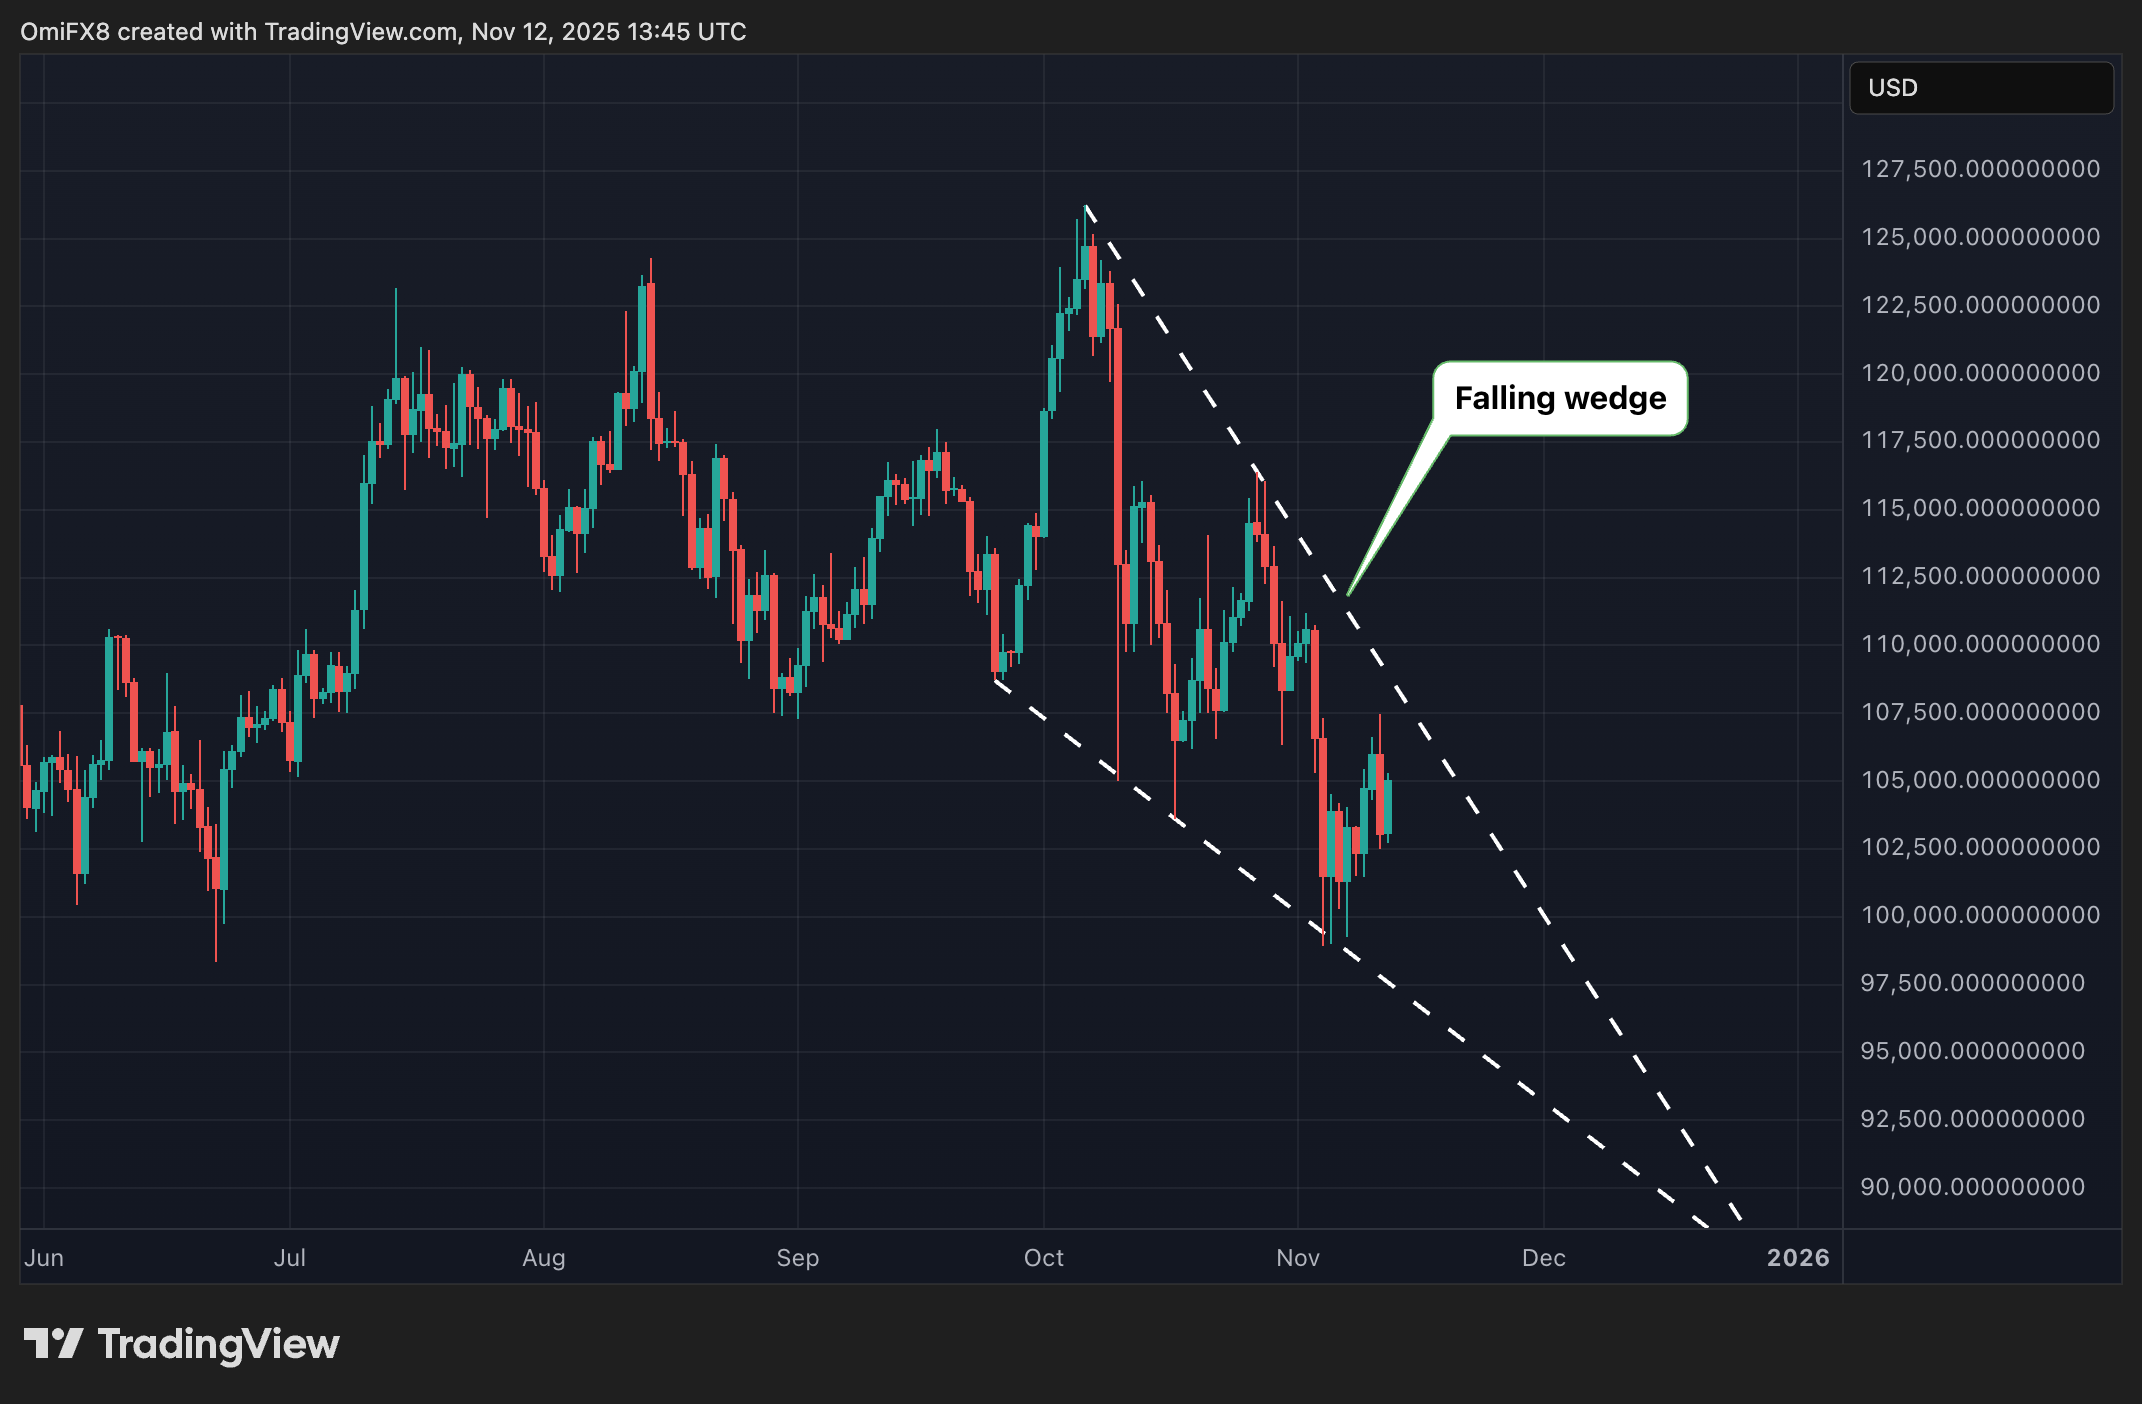
$BTC has carved out a bullish falling wedge pattern. (TradingView)
If prices rise past the upper boundary of this wedge, currently around $106,000-$107,000, it could confirm a bullish wedge breakout. Such a move would open the door for a rebound toward $126,000 and potentially new records, fueled by recovering momentum and improving market sentiment.
This bullish setup gains support by clear signs of demand resurgence in both the spot market and U.S.-listed spot ETFs.
That said, while falling wedge patterns have a strong historical success rate, they can and do fail. Traders, therefore, should remain vigilant, constantly monitoring price action and volume to confirm the pattern's development.
Further, a potential break below the pivotal $100,000 support level—an important on-chain threshold—since a sustained move below it could trigger a deeper correction, possibly pushing prices toward the next support near $90,000.

 coindesk.com




