As Bitcoin’s halving approaches, market participants appear to have mixed feelings about where the flagship cryptocurrency is headed next. Some of the most prominent analysts in the industry believe that BTC is poised to correct. But, there are others who expect a “face-melting” upswing.
Regardless of the ambiguity that the pioneer cryptocurrency presents, on-chain metrics reveal key support and resistance levels that may help determine the direction of the trend.
Bitcoin Is Rising Through Uncertainty
Since the market meltdown in mid-March, Bitcoin has gone up nearly 140%. The bellwether cryptocurrency rose from a low of $4,000 to recently hitting a high of $9,440.
The substantial bullish impulse that Bitcoin has experienced over the last two months makes it reasonable to believe that a steep correction is underway. However, the pioneer cryptocurrency has shrugged off all the bearish signs and continues climbing.
On May 1, for instance, the Tom Demark (TD) Sequential indicator presented a sell signal in the form of a green nine candlestick. The bearish formation suggested that a retracement was on Bitcoin’s horizon.
Although this technical index was able to predict the most significant exhaustion points on BTC’s 1-day chart over the last three months, the most recent bearish signal was invalidated. Subsequently, the flagship cryptocurrency pushed for another swing high.
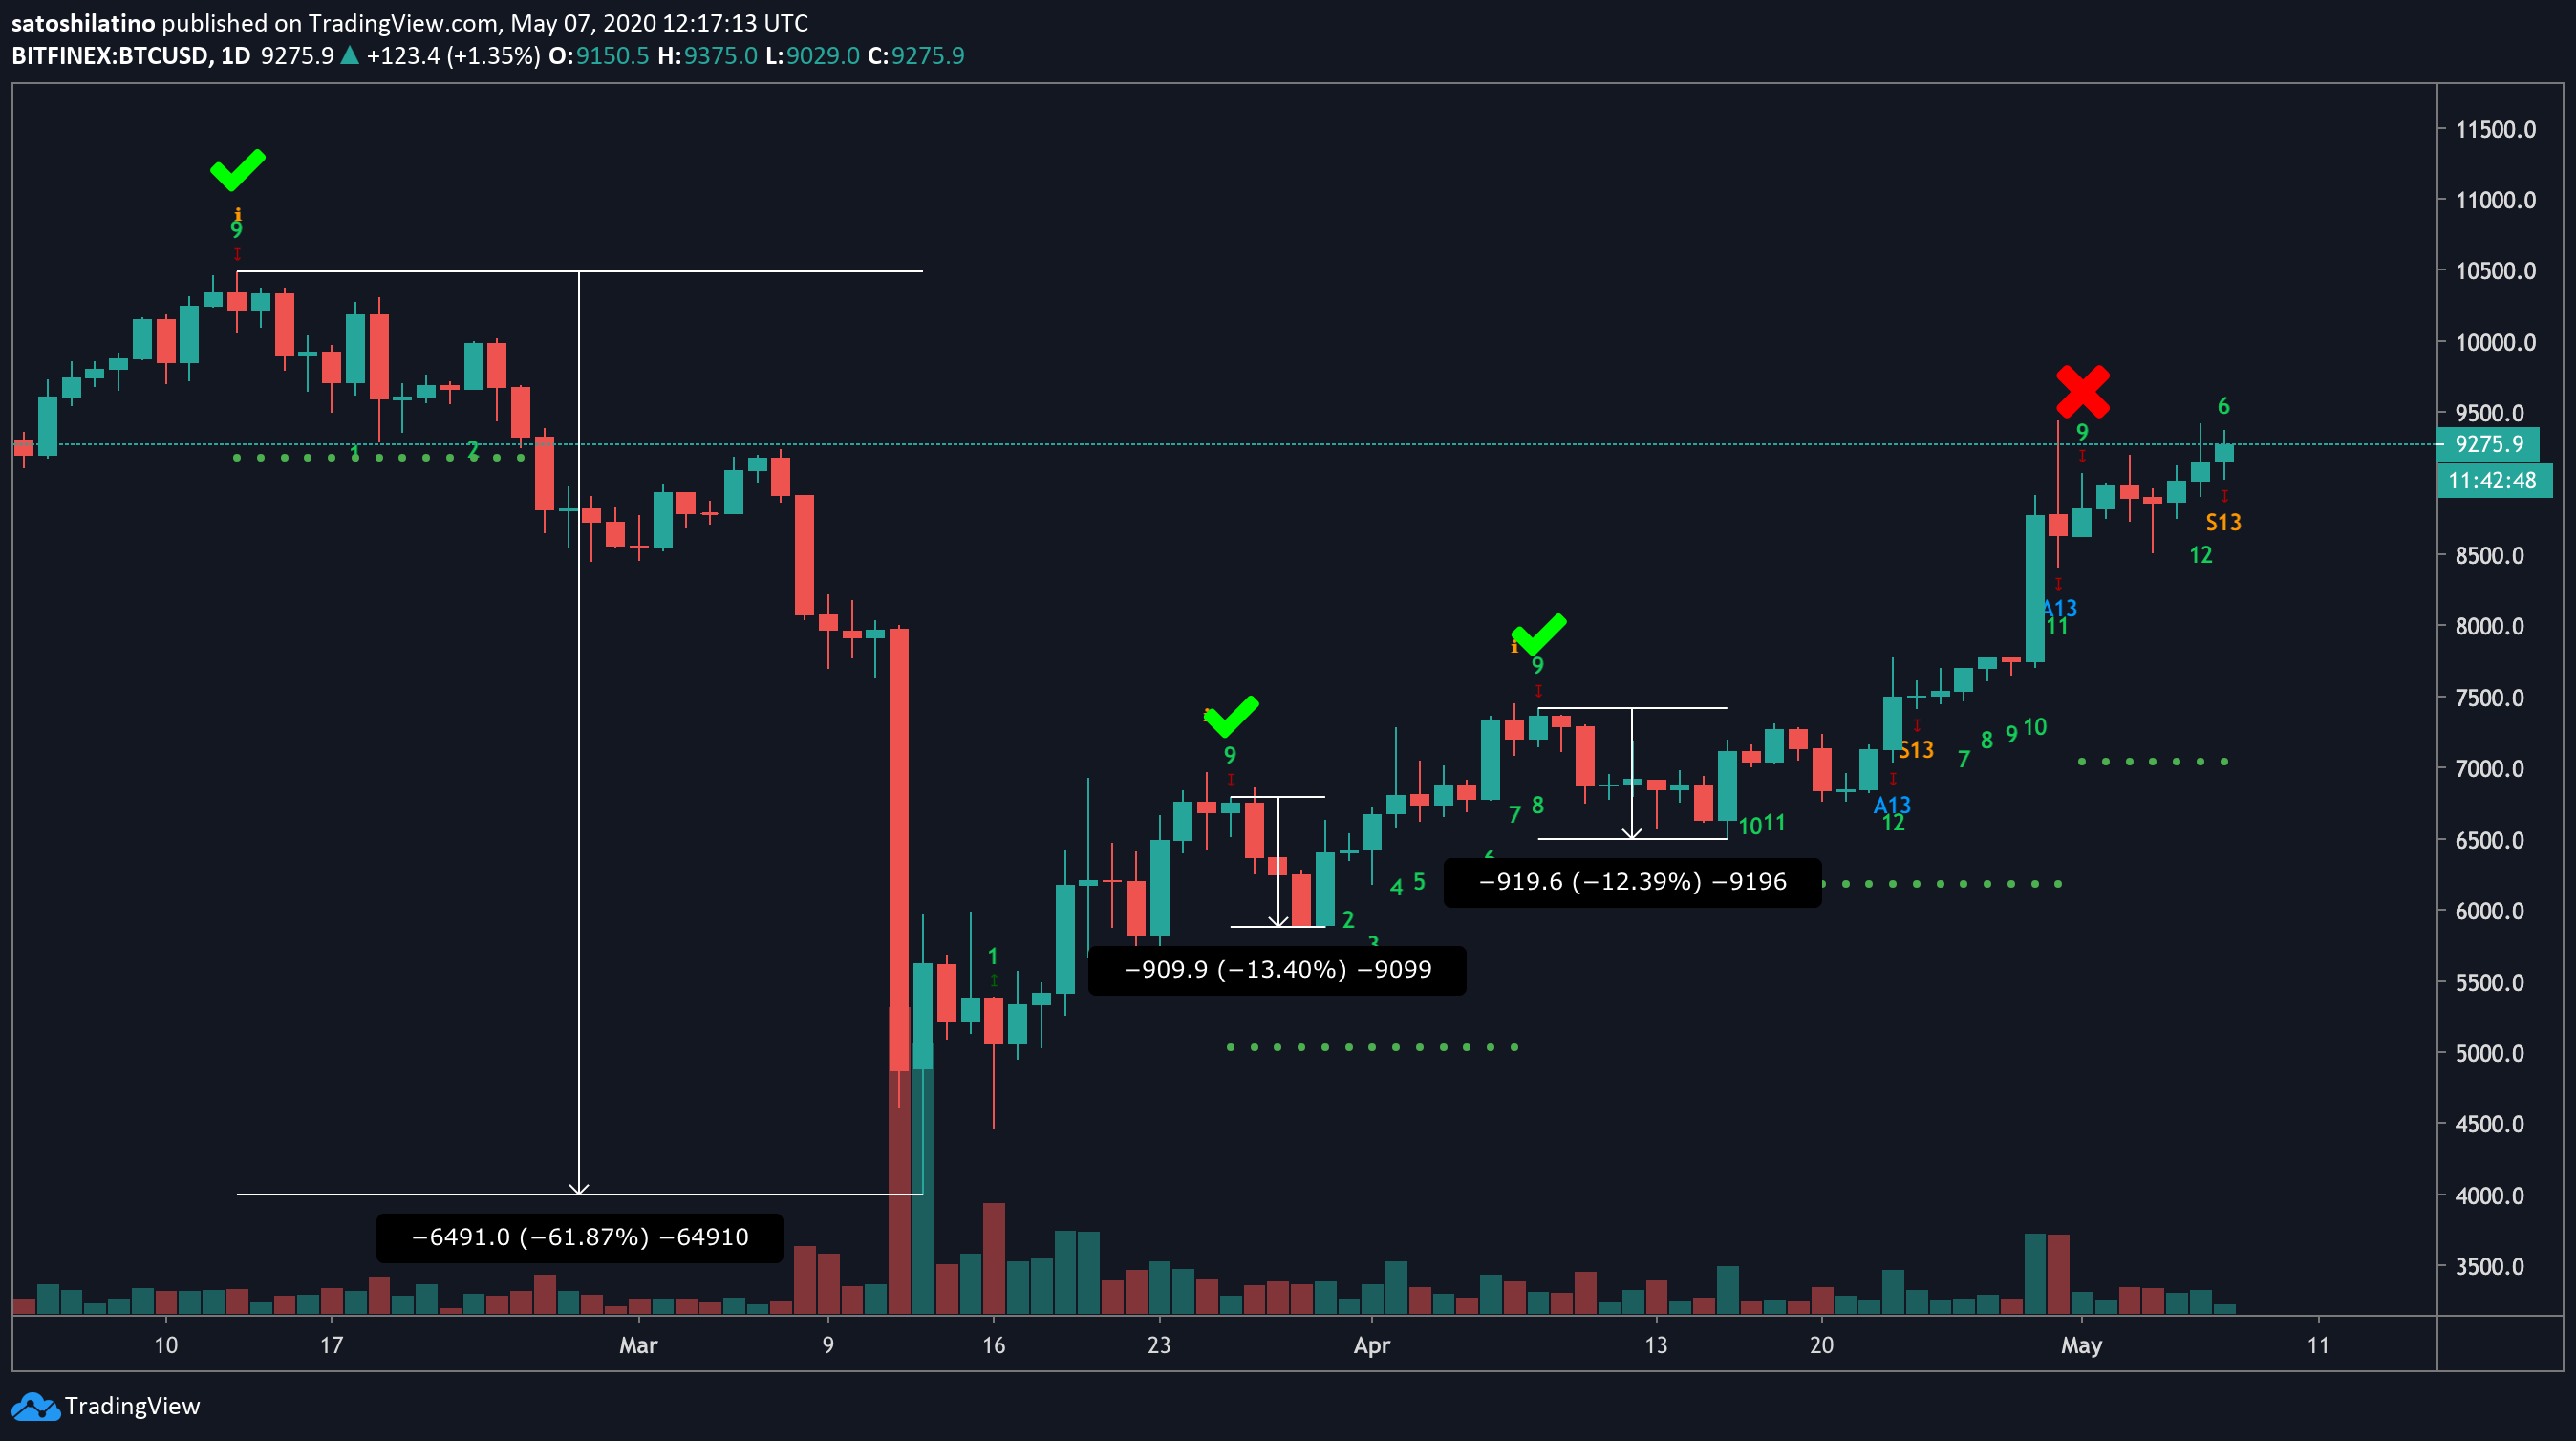
Bitcoin Invalidates Recent Sell Signal by the TD Setup. (Source: TradingView)
Now that Bitcoin has managed to re-claim the $9,200 level as support, machine learning firm IntoTheBlock estimates that there is a massive demand and supply wall ahead.
Strong Support and Resistance Ahead
In a recent tweet, IntoTheBlock said that its “In/Out of the Money Around Price” (IOMAP) model reveals that the pioneer cryptocurrency is sitting at a pivotal point. This area is defined by the $8,900 support and the $9,600 resistance level.
A glimpse at the levels of support shows that 1.5 million addresses bought over 975,000 BTC at an average price of $8,877. Such a significant demand barrier could prevent Bitcoin from a further decline in the event of a correction.
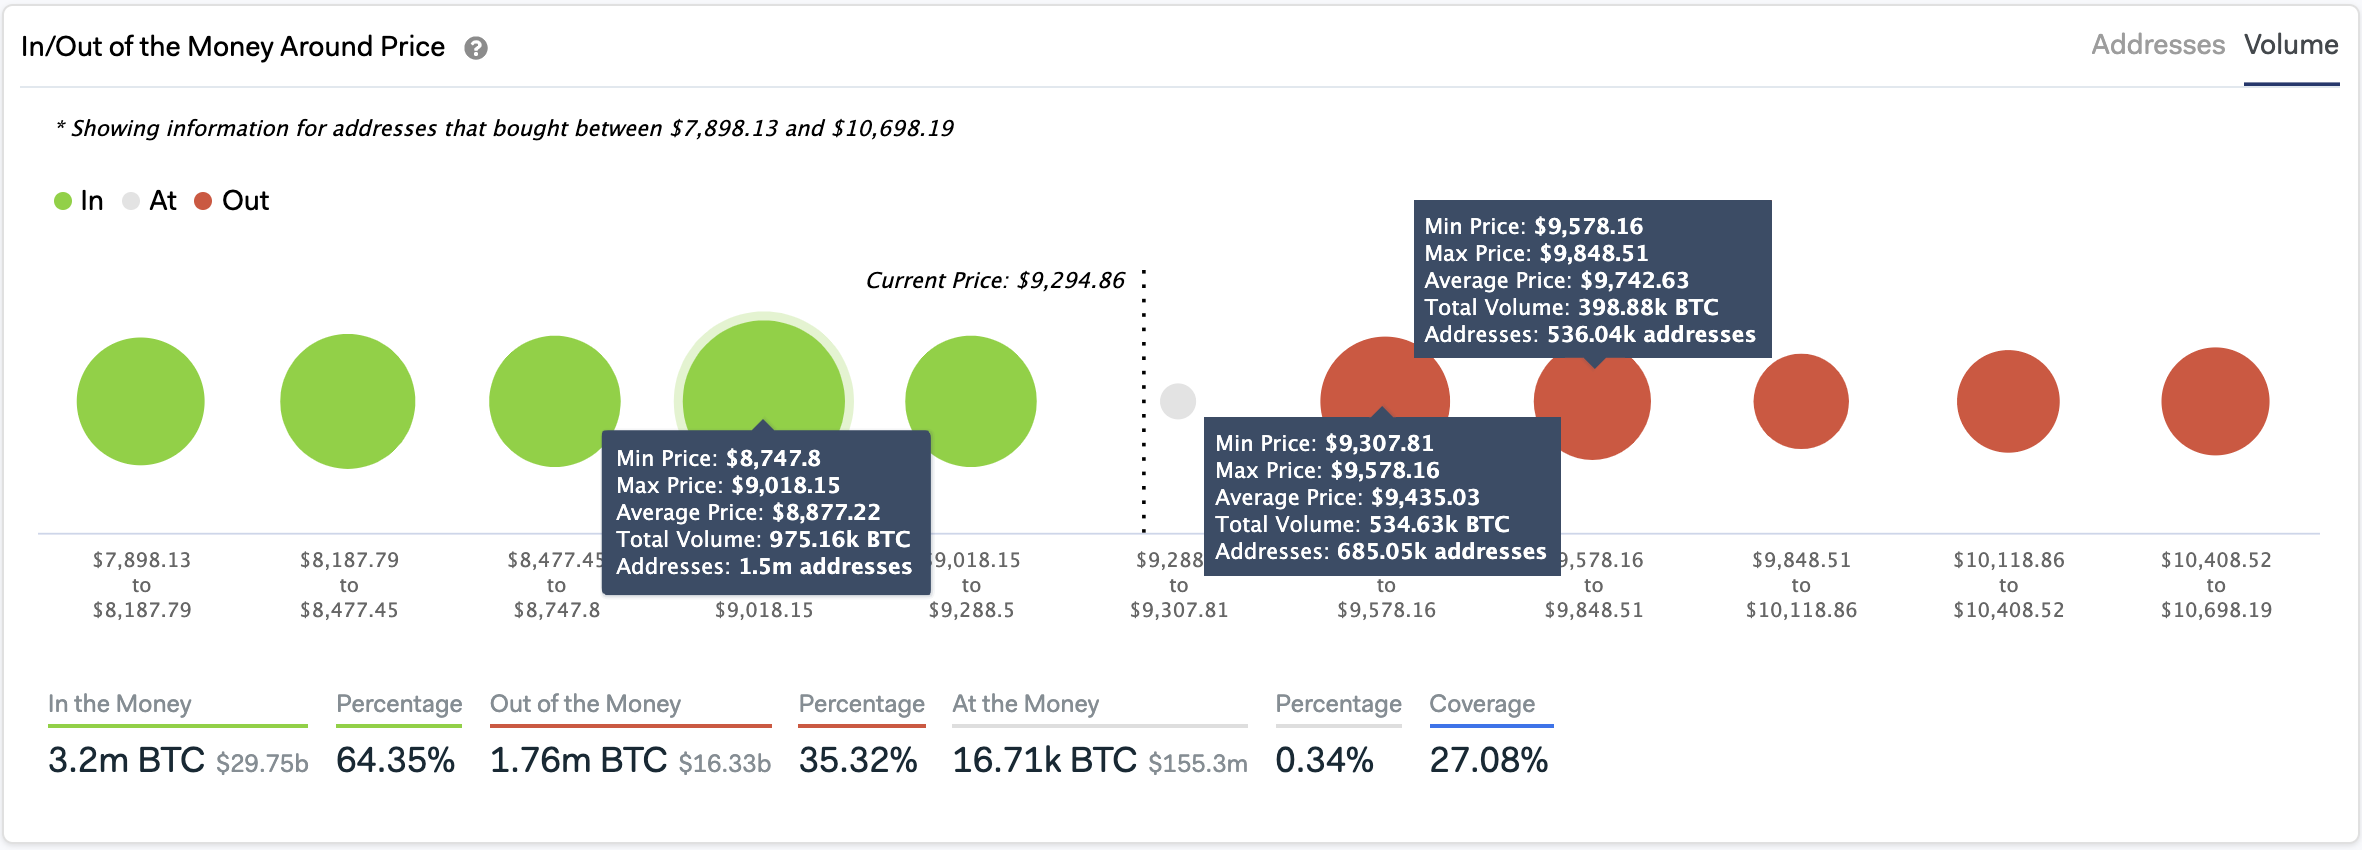
Bitcoin In/Out of the Money Around Price. Source: (IntoTheBlock)
On the upside, however, the most significant resistance level lies at exactly $9,578. The IOMAP estimates that more than 1.2 million addresses bought over 933,000 BTC around this price. This massive hurdle could put a stop to Bitcoin’s uprising.
From a technical perspective, these support and resistance levels suggest that while Bitcoin is contained within it, this area is a reasonable no-trade zone.
The unpredictability of the crypto market makes it impossible to determine whether BTC will break above or below this range. And, as the volatility rises in proximity to the upcoming block rewards reduction event, it is best to wait for a breakout or break down before entering any trade to prevent adverse market conditions.
Featured Image from Unsplash