Bitcoin (BTC) indicators are showing several short-term bullish signals above a strong support level, making a breakout above resistance a likely scenario.
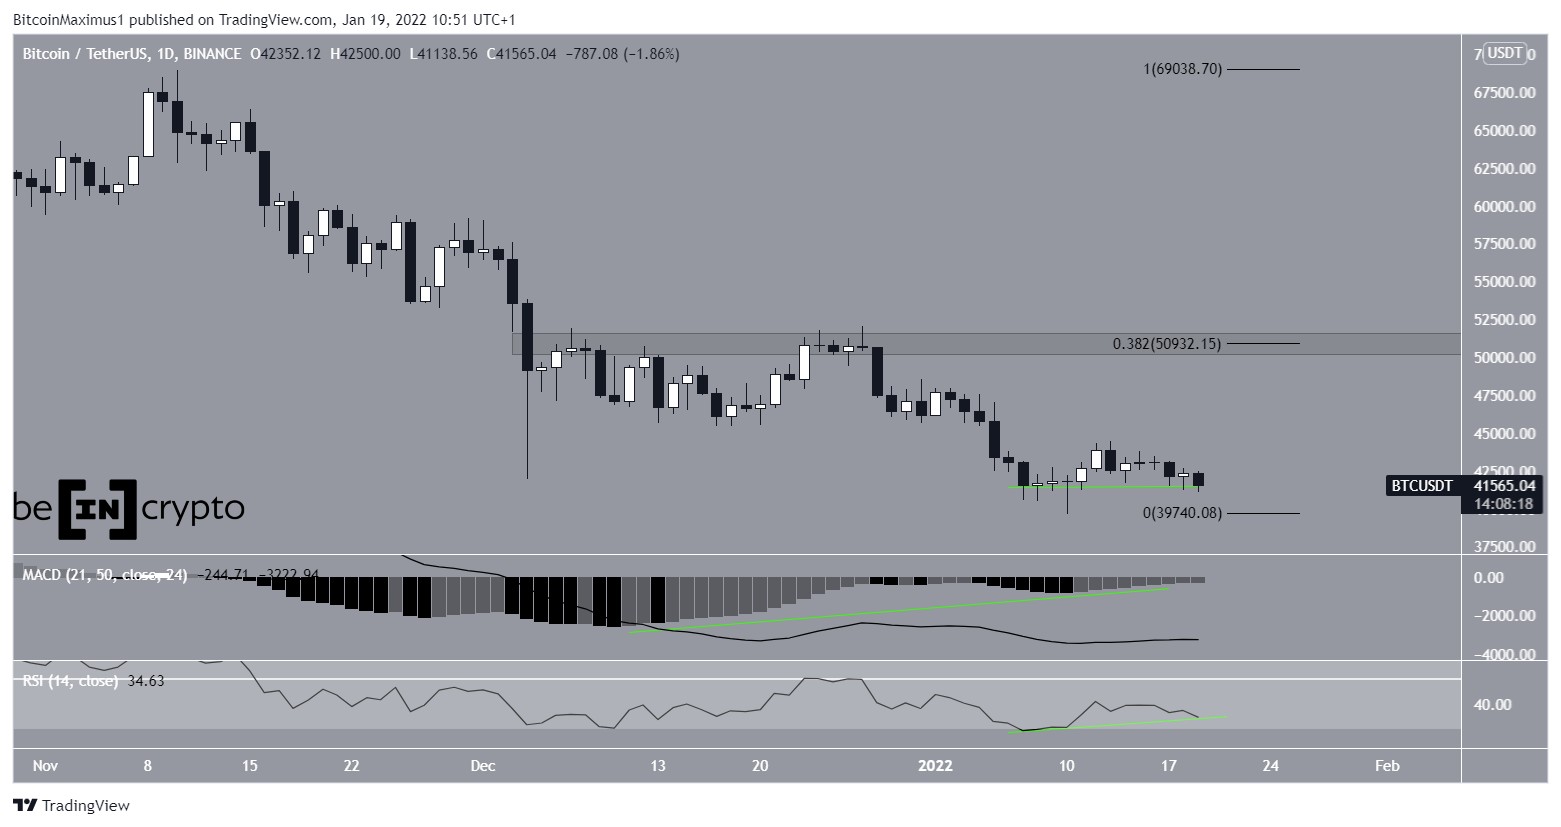
Since Jan 8, BTC has been trading slightly above the $41,500 mark. Despite slipping to a local low of $39,650 on Jan 10, it bounced immediately and created a very long lower wick. This shows a great deal of buying pressure at this level.
More importantly, both the RSI and MACD have generated significant bullish divergences (green lines). These divergences normally present before significant upward movements.
If an upward move transpires, it’s likely to be met by resistance around $50,930. This target is both the 0.382 Fib retracement resistance level and part of a horizontal resistance area.
Short-term BTC movement
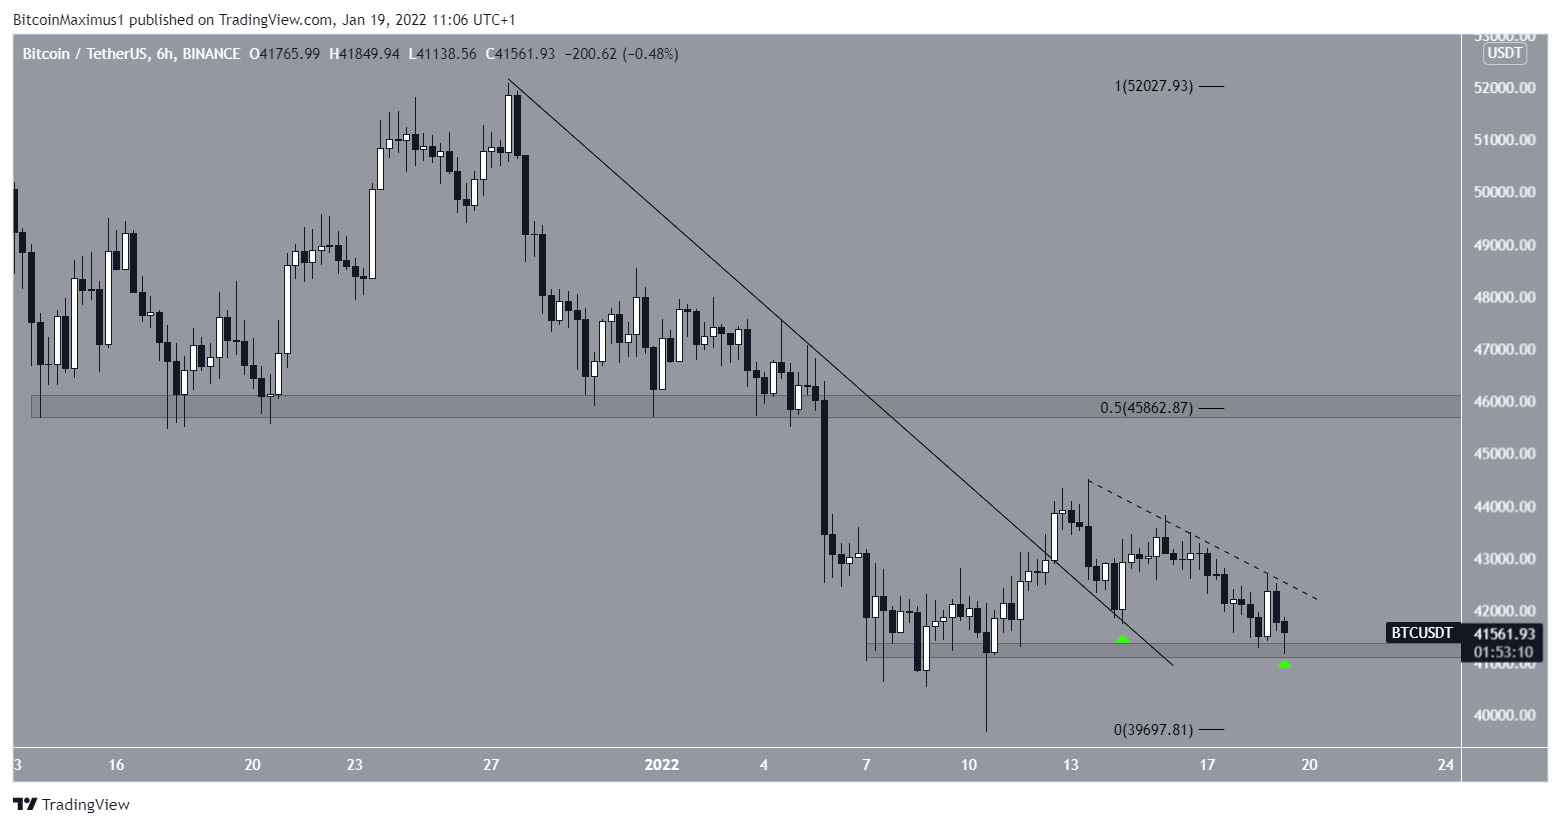
The six-hour chart shows that BTC has broken out from a descending resistance line and validated it as support after (green icon).
After a brief rebound, BTC created a slightly lower low on Jan 19. This served to validate the $41,200 area as minor support.
BTC is also following another descending resistance line (dashed) in the shorter term. A breakout above it would likely take the price to $45,850. This target is the minor 0.5 Fib retracement resistance level and a horizontal resistance area.
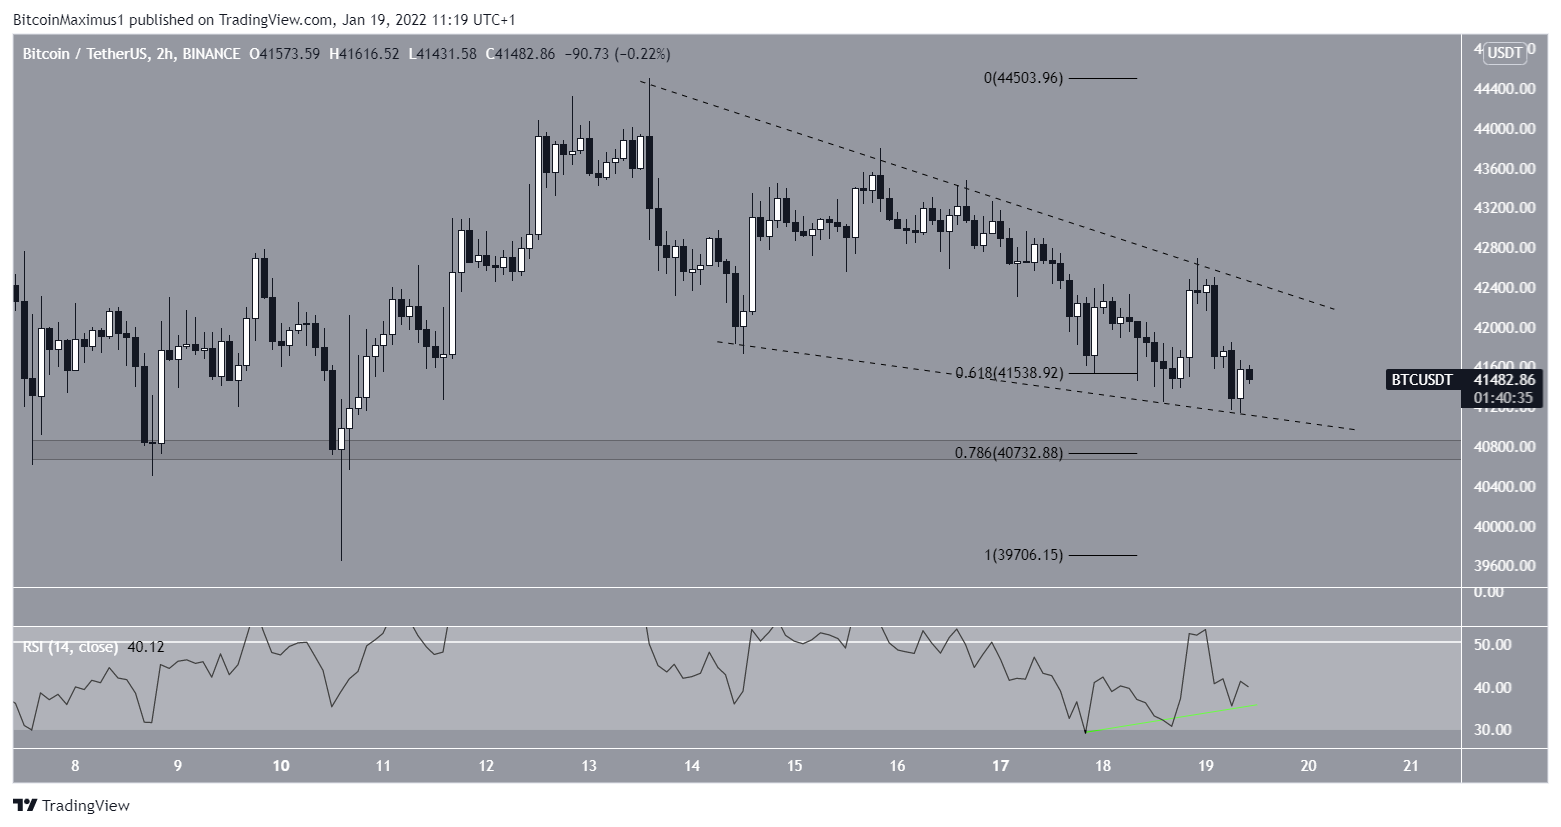
Finally, the two-hour chart shows that BTC is potentially trading inside a descending wedge, which is considered a bullish pattern. Currently, it’s approaching the end of this pattern which has been in place since Jan 13.
Similar to the daily time frame, the RSI has generated a considerable bullish divergence, supporting the possibility of a breakout.
So, when taking into account the ample support just below the price and numerous bullish divergences, an eventual breakout seems like the most likely scenario.
This is also in line with the short-term wave count.