Bitcoin has tough days. The primary cryptocurrency had lost 40% of its value over the past four days.
The fact that the price of Bitcoin is positively correlated with the global stock markets had been a surprise to many in the crypto community, who waited eagerly to see Bitcoin price exploding amid the emerging coronavirus financial crisis. After all, Bitcoin was born as alternative money following the recent financial crisis of 2008.
Back to the price charts: the abnormal behavior that took place during the night between Thursday and Friday (EU nighttime) had caused a lot of disorder on the charts. However, patterns were starting to form again, on the lower timeframes, since then.
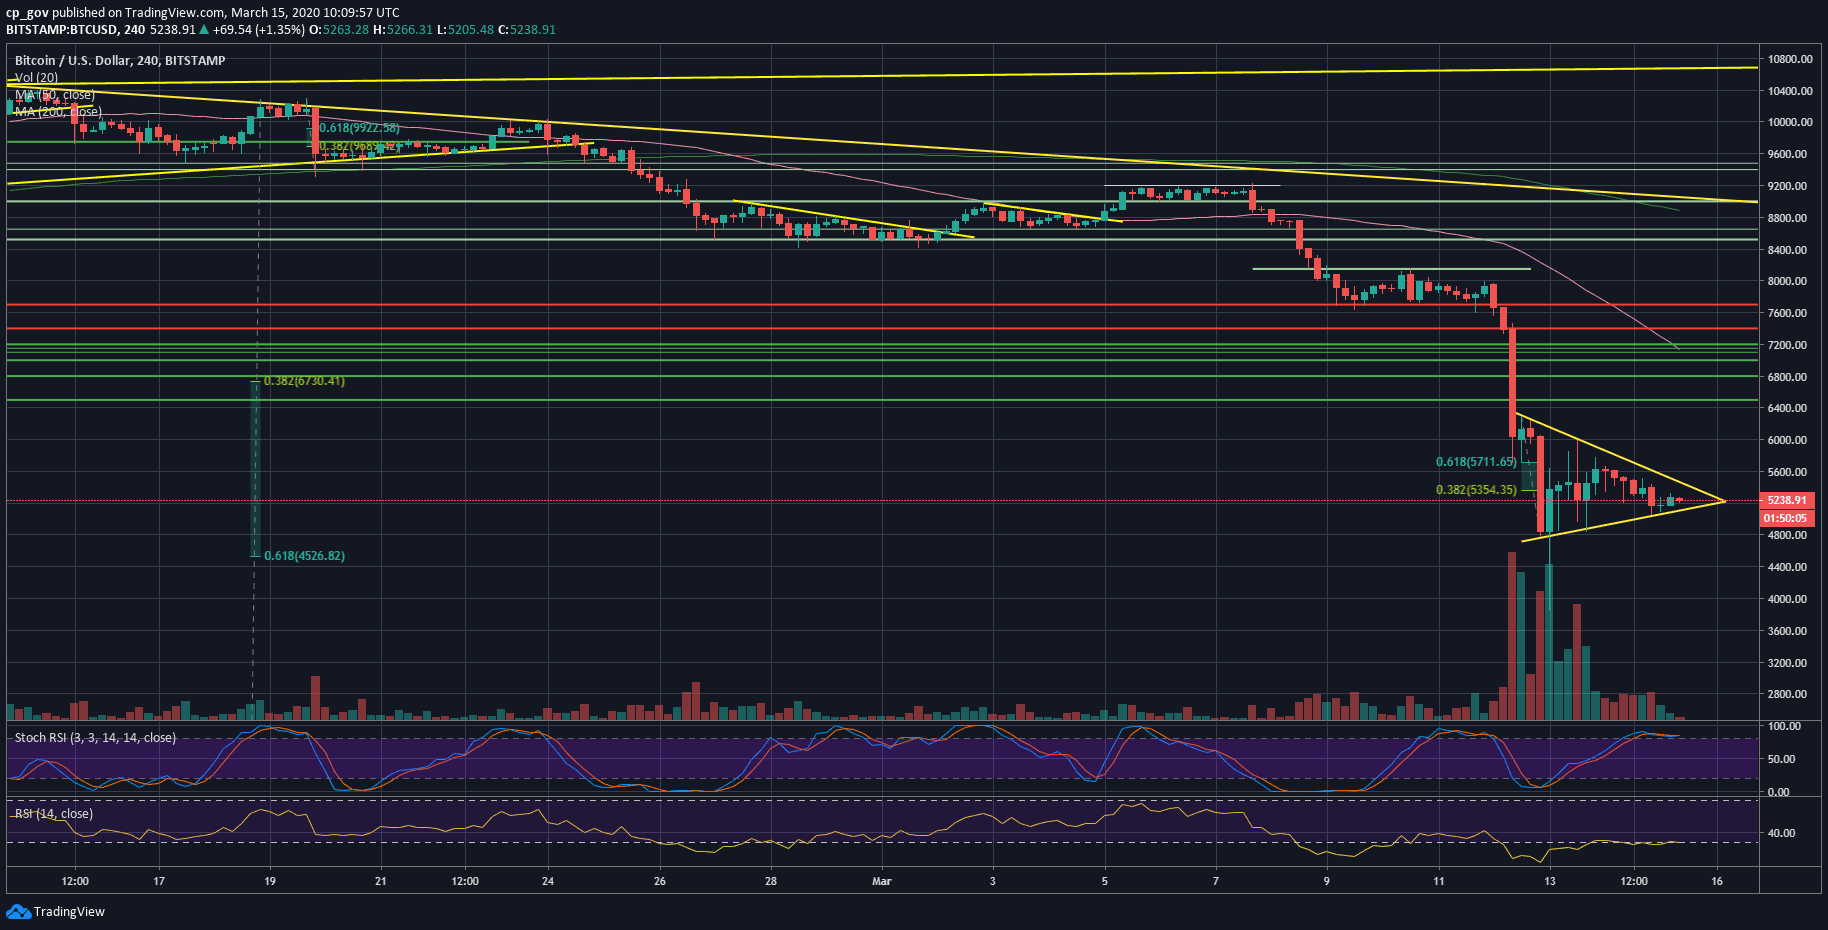
Overall, Bitcoin is consolidating inside a symmetrical triangle, as can be spotted on the following 4-hour chart. A decision on the next short-term direction is expected in the coming 12-24 hours.
Assuming the correlation between Bitcoin and the global markets as mentioned above, this is the timeframe that Wall Street futures will open ahead of Monday’s trading session, and Bitcoin is likely to act accordingly.
Total Market Cap: $151 billion
Bitcoin Market Cap: $96 billion
BTC Dominance Index: 63.8%
*Data by CoinGecko
Key Levels To Watch & Next Possible Targets
– Support/Resistance levels: As mentioned above, the next short-term direction for Bitcoin is likely to be decided once the symmetrical triangle on the 4-hour chart will break in either direction.
In case of a break to the downside, we can expect the first level of support to be the $5000 benchmark. Further below lies $4700 – $4800. Beneath, there is not much support, before the next significant level at $4200 (old resistance turned support level from the beginning of 2019), before the $4000 price zone and $3700 (the weekly low).
In case of a bullish breakout, the first level of resistance is the $5500 price zone (the 78.6% Fib retracement level from the June 2019 bull-run), while the next one is $5700 support turned resistance level. Further above lies $6000, $6300, then $6500 (the low from the end of 2019) resistance levels.
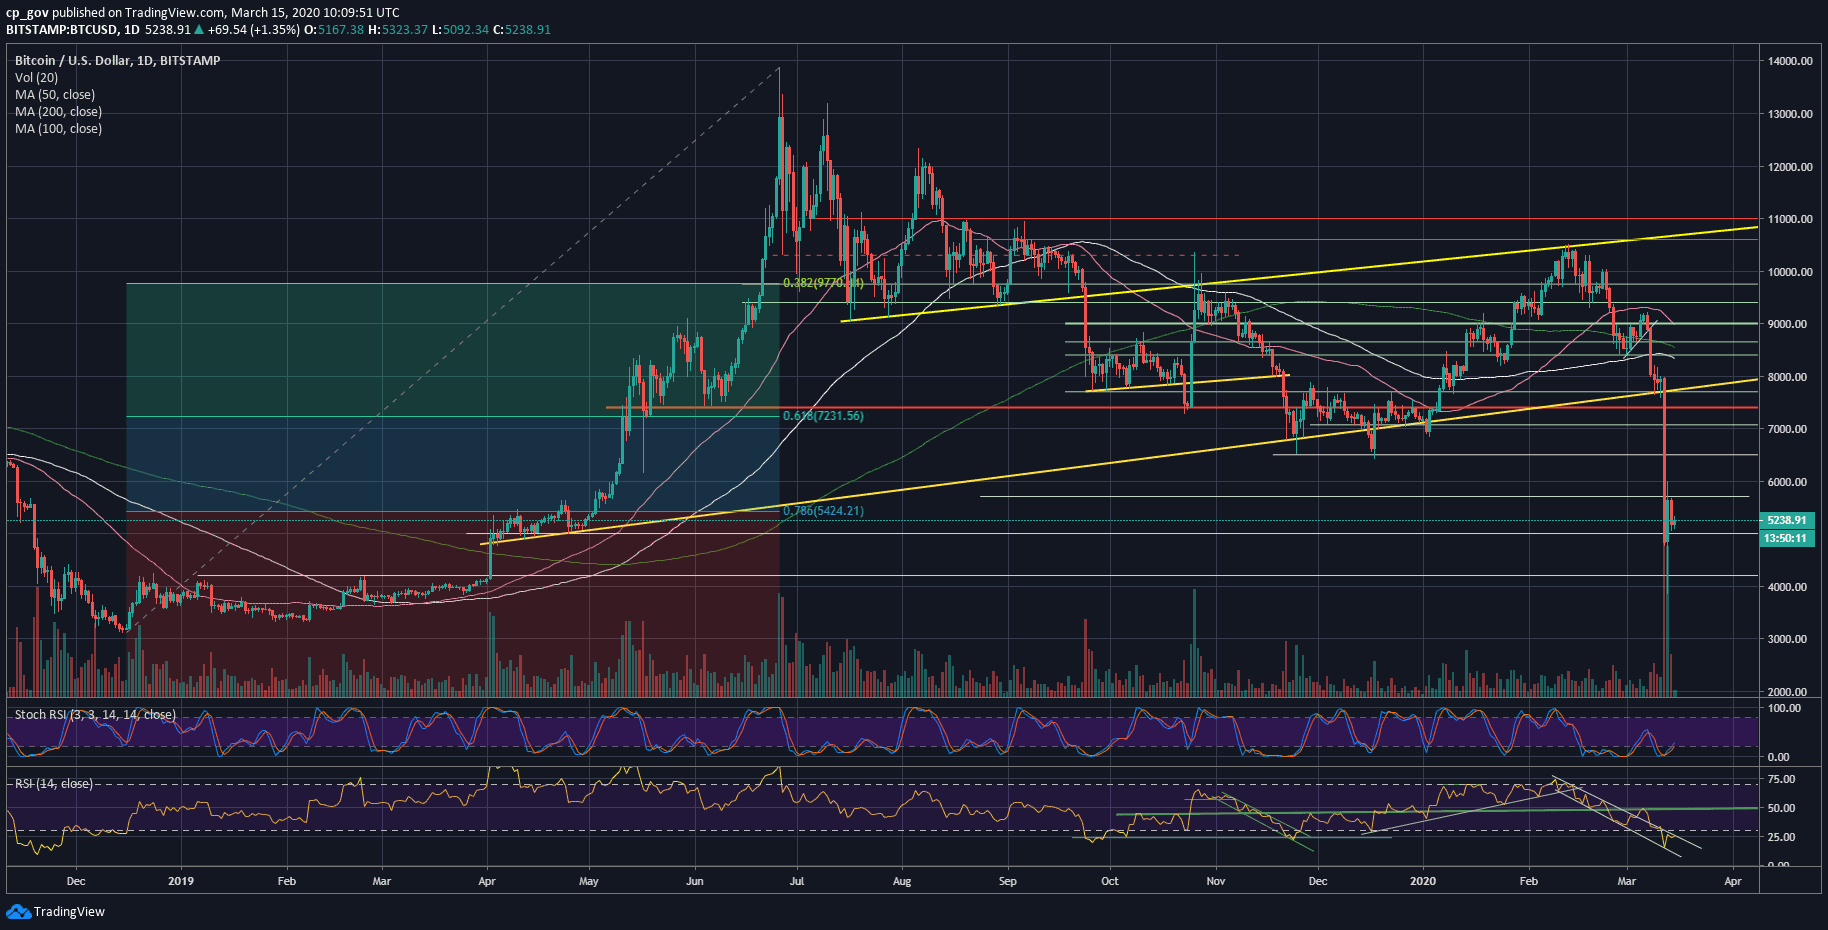
– The RSI Indicator: The RSI is back inside the descending wedge pattern, which was started forming at the beginning of February 2020. As of writing theses lines, the momentum indicator is testing the upper boundary of the wedge as resistance. A breakout will be a short-term bullish sign for Bitcoin and is likely to be correlated with the breakout of the triangle.
– Trading volume: Massive amounts of volume followed the recent sell-off. This doesn’t look good for the bulls as the sellers control the market.
BTC/USD BitStamp 4-Hour Chart
BTC/USD BitStamp 1-Day Chart