In the last few hours, another $200 has been lost in the price of the leading cryptocurrency Bitcoin, making BTC fall below psychological support level of $7K. Now investors can accumulate more as Bitcoin continues to remain in the bearish zone between the 6K and 7K bands.
After staying above the $7,000 support level since last week, Bitcoin has now displayed its extreme volatility, falling below the support within an hour. While there have been ranges of hope that cryptocurrencies will rise before the end of the year, BTC deflated the positive expectation by falling to $6K zone.
On the 1D chart of Bitcoin XBTUSD trade pair on BitMex, the scenario is totally bearish with a possible culmination of a descending pattern that started mid-year. This could see the capitulation of Bitcoin before the next halving to the 5k area.
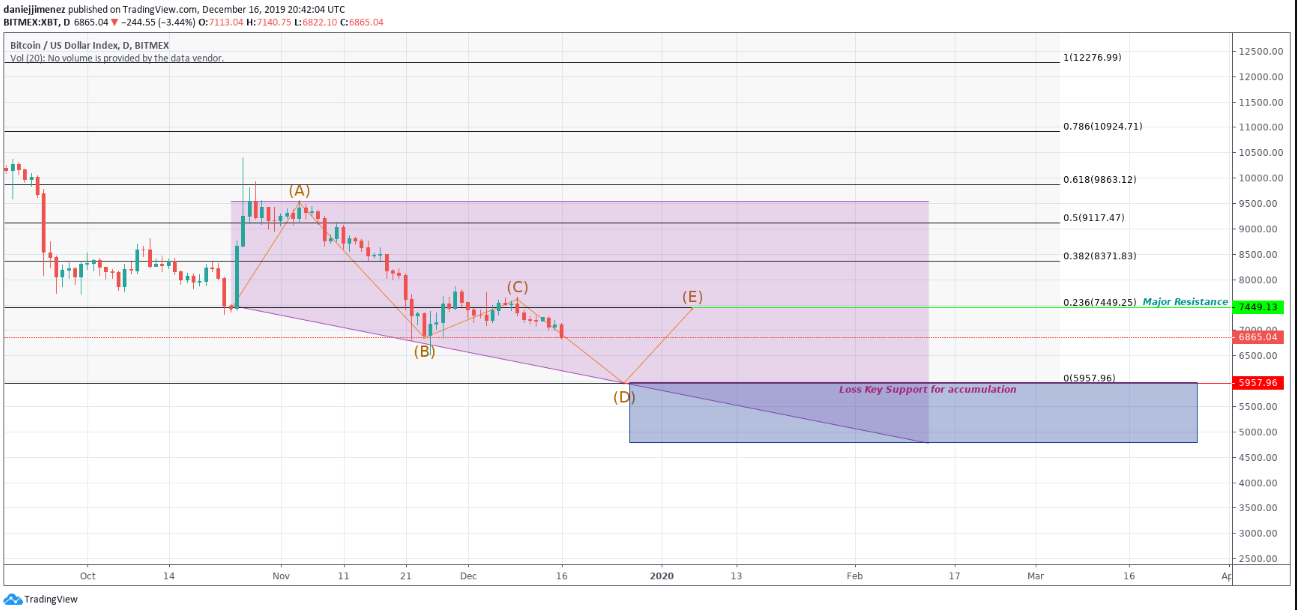
If the downward trend is maintained and nothing disrupts it before the next halving we could have a completely projected disjoint channel until Q1 2020. That could make the price of Bitcoin to move laterally towards the area of $ 5800- $ 6800.
The breakdown of the key support at the $ 5,900 levels could specify the gray accumulation strip for the end of the bear market before the next halving.
To learn more about the possible cryptocurrency scenario for the next few days, we visualize the 4H graph for the XBTUSD pair in BitMex and the scenario is coincident with the previous one.
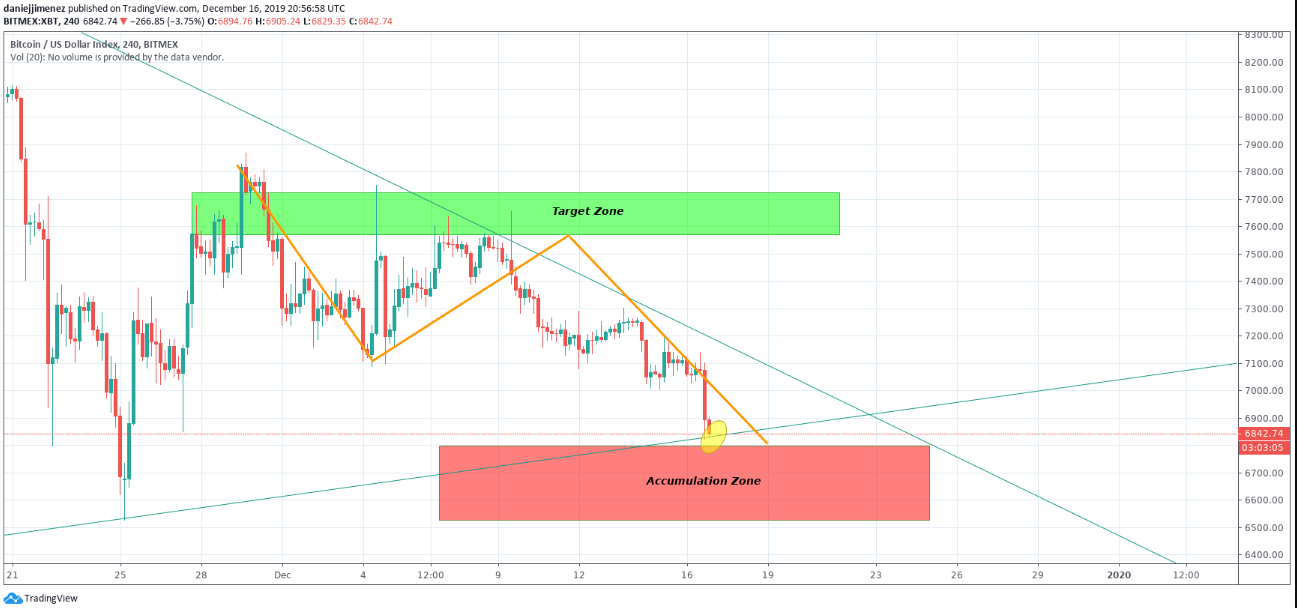
A sharp fall in the price from the 7.5k zone at the beginning of the month has caused the loss of price support with lower highs that triggered the breakdown of the support in the 7k zone and now eyeing the next Candle.
BTC is expected to break down the projected symmetrical triangle towards the accumulation zone below 6.5k, where the Elliot wave is supposed to end its action.
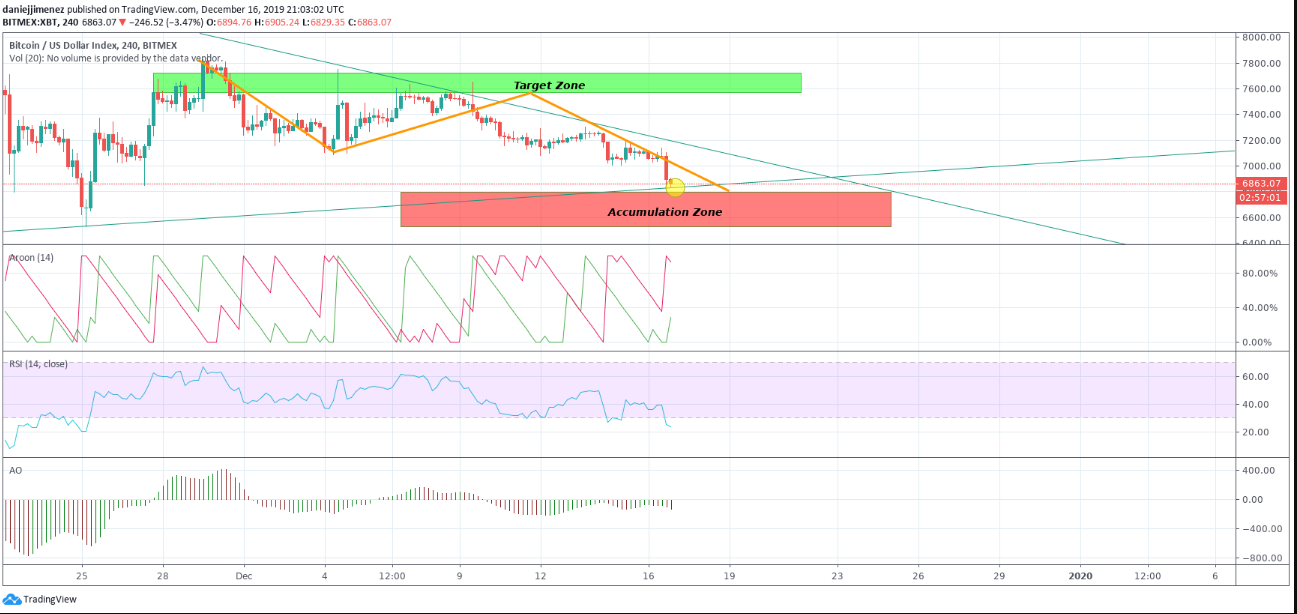
Aroon indicates that the bearish signal is dominant for now in the market and that despite the predominant bear scenario, some price rebound is expected for the next few hours.
RSI clearly indicates the levels of oversold dominates the market today. With a value close to 23.10, the depth in the fall of the price of Bitcoin is being used by bears.
Awesome Oscillator is gaining depth in Bitcoin price drop. Although it was forming higher lows, the next movements of BTC price will have to be expected before sentencing a position in relation to AO.
Finally, the 1W graph for the XBTUSD pair in BitMex seems to be condemning the previous scenario and what we had pointed out at the beginning of the post: the market cycle and Bitcoin in particular.
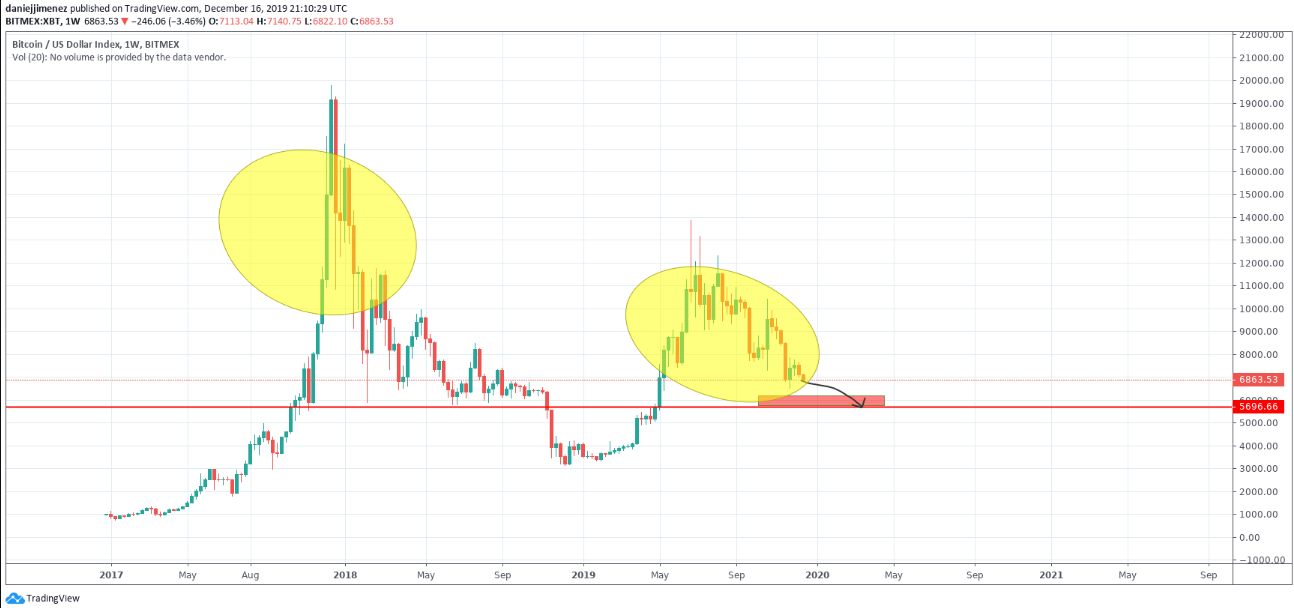
According to this graph, Bitcoin is about to complete its second cycle or ‘Christmas tree’ as many calls, just before the next halving before being able to think about new price takeoff. The obligatory question here is whether BTC will be able to reach historical highs or, conversely, new lower highs.
According to the above, the price seems that it could reach a new lower maximum, however, it is quite difficult to accurately predict Crypto in the long-term. .
Traders Match the 5k Theory
What is true is that the 5k theory is gaining strength as many professional traders believe the possibilty, and some such as LisaNEdwards, point out the possibility of a capitulation of the price of BTC before the next halving, as highlighted last month.
IS THE BTC SANTA RALLY ABOUT TO BEGIN? – #XBT chart https://t.co/vy9ykuqUqt
— ❣️Lisa N Edwards❣️ (@LisaNEdwards) November 22, 2019
For now, at the end of this post, Bitcoin is trading in the markets at an average price of $ 6,864.67, a drop of -3.40% in the last 24 hours.