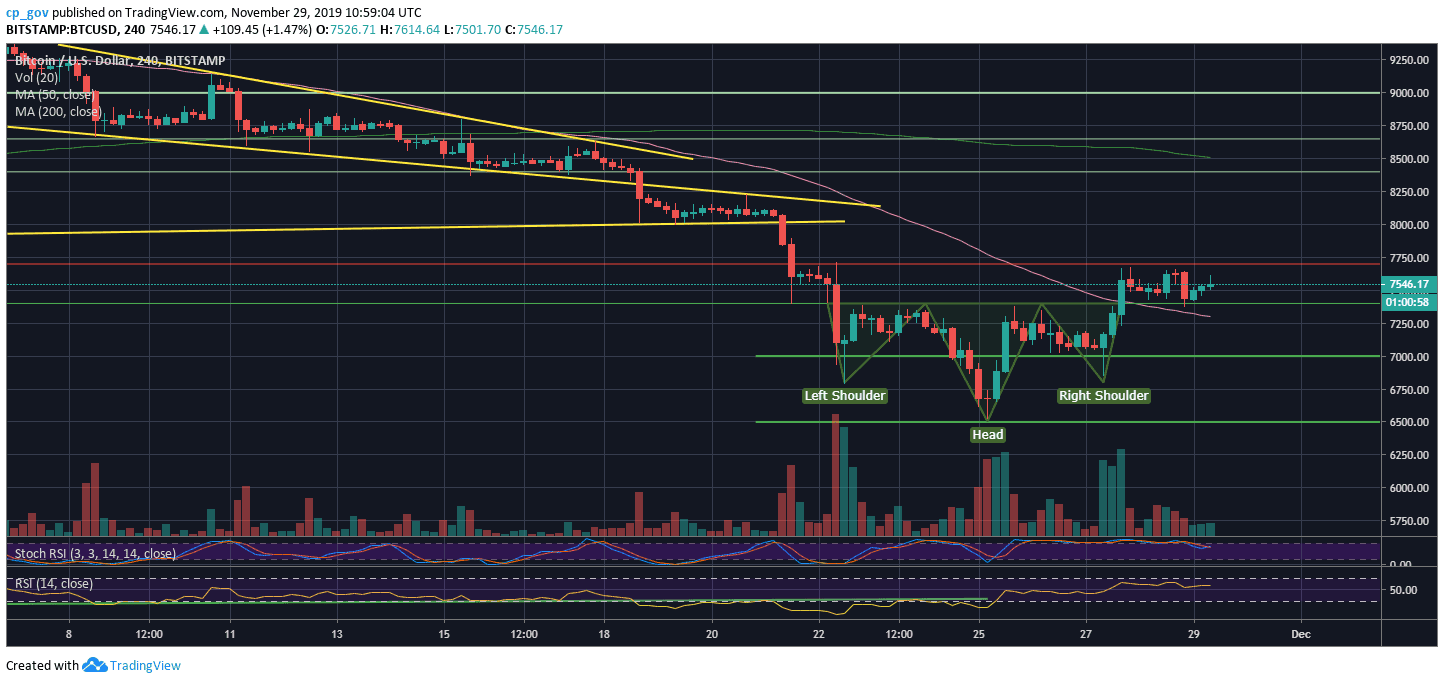
It took just a few hours after we posted our previous Bitcoin price analysis, and Bitcoin broke out nicely the $7400 resistance, which is the neckline of the inverse head and shoulders pattern.
Since then, Bitcoin quickly made a move to our next mentioned resistance level of $7700 and quickly got rejected. Over the past 40 hours, Bitcoin is trading under the tight range of $7400 to $7700.
From the bullish side, after such a massive move ($6800 to $7700), a correction or consolidation was expected. So far, the correction is healthy, as confirming the $7400 as support. The bottom line is that it’s safe to say that holding up the last level, the $7400, and the direction for Bitcoin’s short-term is up.
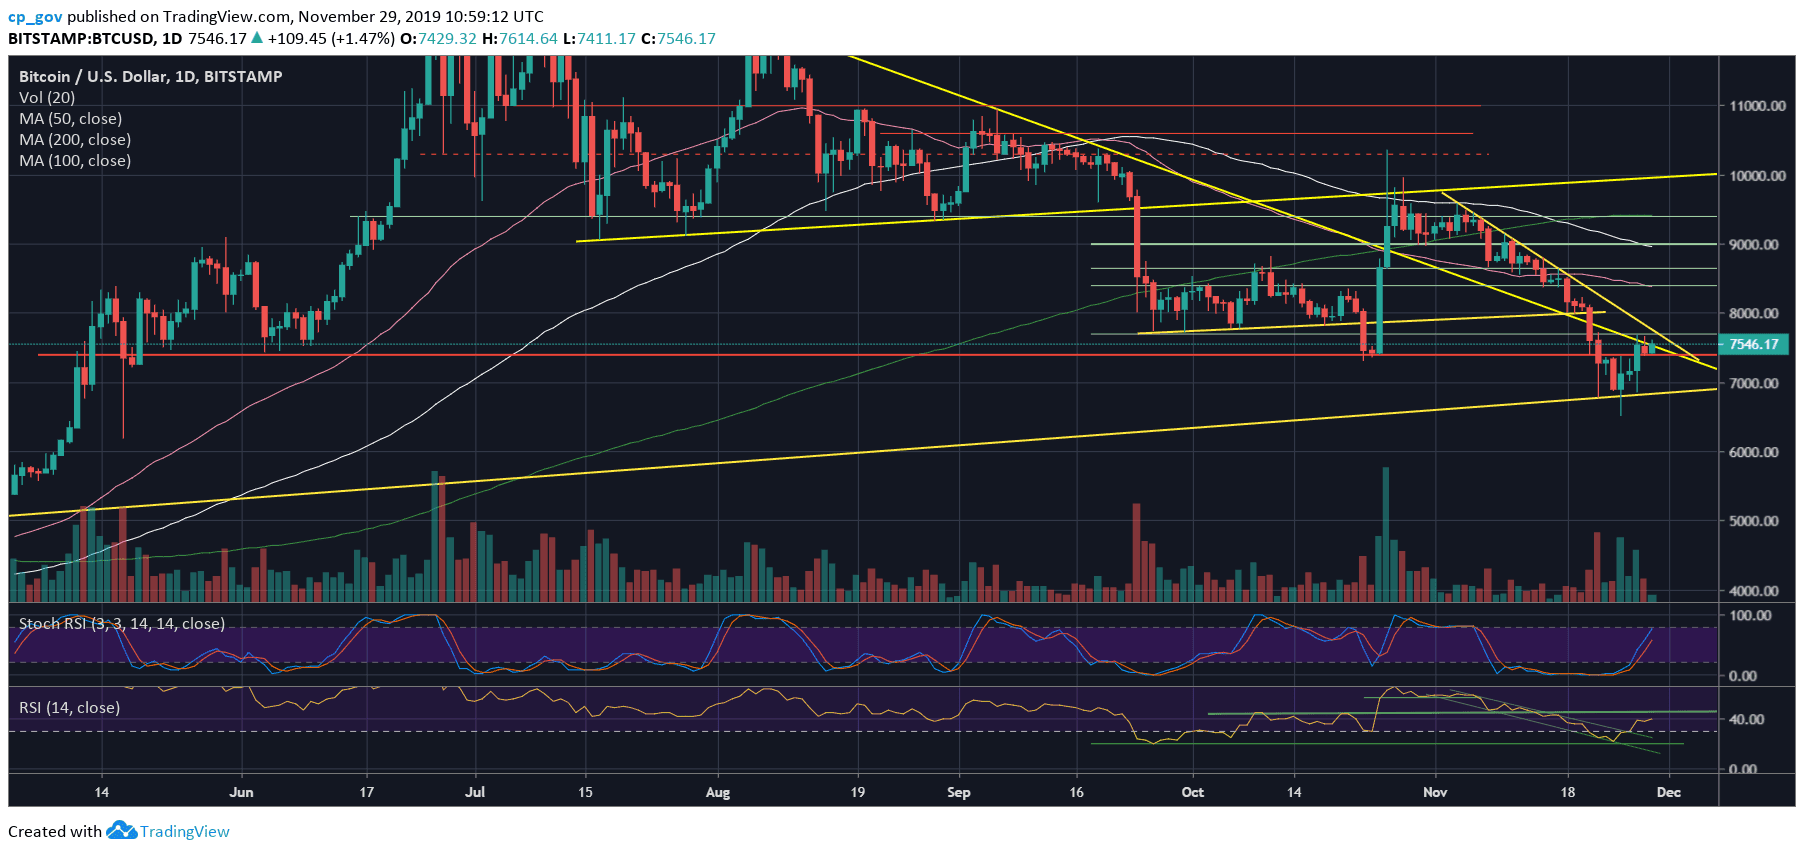
Another thing to note is the significant descending trend-line, which is marked on the following daily chart (the one that started forming as Bitcoin reached its 2019 high during June). The trend-line is slowing Bitcoin’s pace in its way North.
Just a reminder, the inverse head, and shoulders pattern granted Bitcoin a further target of $8300. Of course, this doesn’t mean the target will be reached for sure, but so far, the settings look healthy for Bitcoin to continue upwards.
And last, the CME Futures monthly expiration is taking place in the next hours (16:00 UTC). Usually, this event has a significant short-term influence on the price of Bitcoin.
Total Market Cap: $206 billion
Bitcoin Market Cap: $136.8 billion
BTC Dominance Index: 66.4%
*Data by CoinGecko
Key Levels to Watch
– Support/Resistance: Following the breakout of the $7400 resistance (the “neckline”), the next level of resistance lies at $7700, which was tested twice over the past 48 hours. This also contains the 1-day’s short-term descending trend-line.
In case Bitcoin can make it, then further resistance lies at $8000, before reaching the $8300 target and the $8400, which is also the 50-days moving average line (marked pink on the 1-day chart).
From below, the first level of support is the $7400 level. Further down is $7300, along with the 4-hour MA-50 (marked in pink line). Below lies the good old $7000 benchmark.
– The RSI Indicator: The RSI also had done a nice breakout of the descending channel, as mentioned in our previous analysis. Following that, the RSI is getting very close to the 44-45 horizontal resistance.
– Trading volume: The volume is declining over the past week. This can be the settings for the next big move of Bitcoin that may reach out at any time.
BTC/USD BitStamp 4-Hour Chart
BTC/USD BitStamp 1-Day Chart