Trading signals for Bitcoin are turning ‘extremely bearish’ as the cryptocurrency’s wild upside of HY2019 comes close to its exhaustion.
According to market analyst Chonis Trading, the moving average convergence divergence (MACD) oscillator on bitcoin’s weekly charts is looking to flip to indicate its bearish bias. The indicator is one of the most popular ones among both novice and professional investors when it comes to forecasting price momentums and trends. And it has stood accurate in predicting bitcoin’s bias in its recent history.
Chonis Trading pointed out the MACD’s flipping event, wherein the Fast Line in blue is looking to cross under the Slow Line in red. It technically signals a reversal to the downside on a weekly chart, which means the long-term bias for bitcoin is turning bearish.
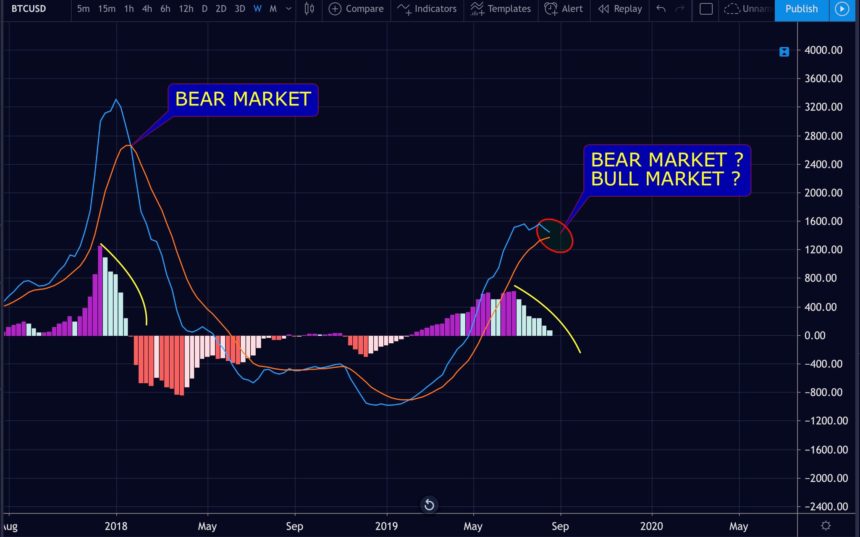
Bitcoin MACD on weekly charts is warning to flip to favor bears | Image Credit: Chonis Trading
“Bitcoin weekly MACD closing in on cross test in the coming weeks. The last time these indicators crossed, the BEAR market was confirmed. Histogram continue to stair-step down to the negative,” tweeted Chonis Trading.
Certainty
The prediction follows bitcoin’s massive downside correction after rising by more than 200 percent in the first half of 2019. After establishing $13,868.44 as its year-to-date high, the cryptocurrency dropped by as much as 34.5 percent. Nevertheless, it didn’t extend the downside momentum and had been forming lower highs and higher lows ever since. The price action is drawing an arguable symmetrical triangle on the daily charts which, to many, appears like a bull pennant. Such a formation means that bitcoin could continue its upside action after consolidating within the Pennant range for a while.
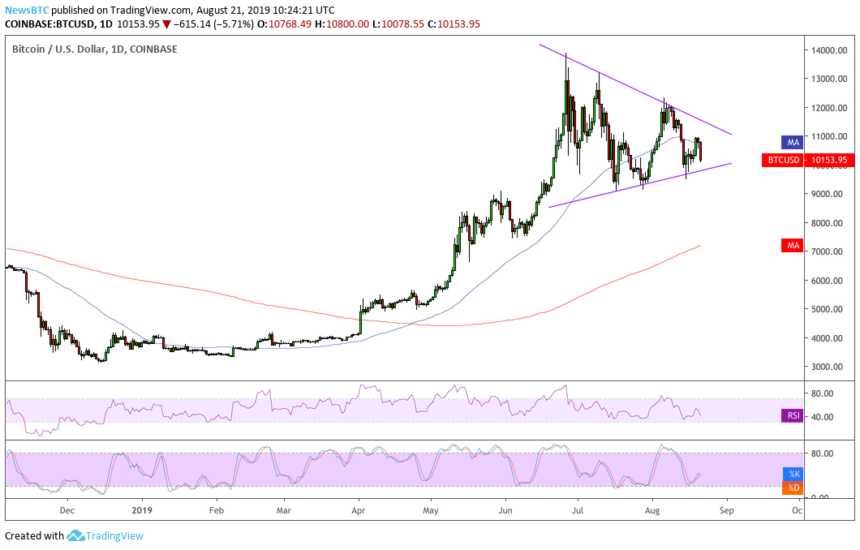
Bitcoin price trending inside a pattern which appears like a bull pennant | Image Credits: TradingView.com
Chonis Trading noted while MACD readings were not 100 percent accurate, bitcoin would still need to reject the cross to maintain its bullish momentum.
“Reject the cross, and the BULL market has running room,” the Twitterati wrote.
$BTC – weekly MACD closing in on cross test in the coming weeks… The last time these indicators crossed the BEAR market was confirmed… Histogram continue to stair step down to the negative…reject the cross and the BULL market has running room pic.twitter.com/PtRloLDzOD
— Chonis Trading-⚔️ (@BigChonis) August 21, 2019
Sean Ross of Investopedia also writes that MACD indicators are not always specific with their predictions of a trend. Particularly in sideways markets, such as the one in which bitcoin is, MACD struggles. Excerpts from his article:
“Since the MACD is based on underlying price points, overbought and oversold signals are not as effective as a pure volume-based oscillator. Always use other technical tools to confirm signals produced by the MACD, as it is the ability to work in conjunction with so many other tools that gives the MACD its reliability.”
The bitcoin weekly MACD flipped to the downside several times during the 2015-2017 bull run.