A recent break-down out of the asymmetrical triangle mentioned in my previous BTC analysis looks poised to continue down to support levels below $11,000. Bitcoin price levels hold above $11,000 for now but the low volume could cause this support to break.
Bitcoin Price 4-Hour Analysis
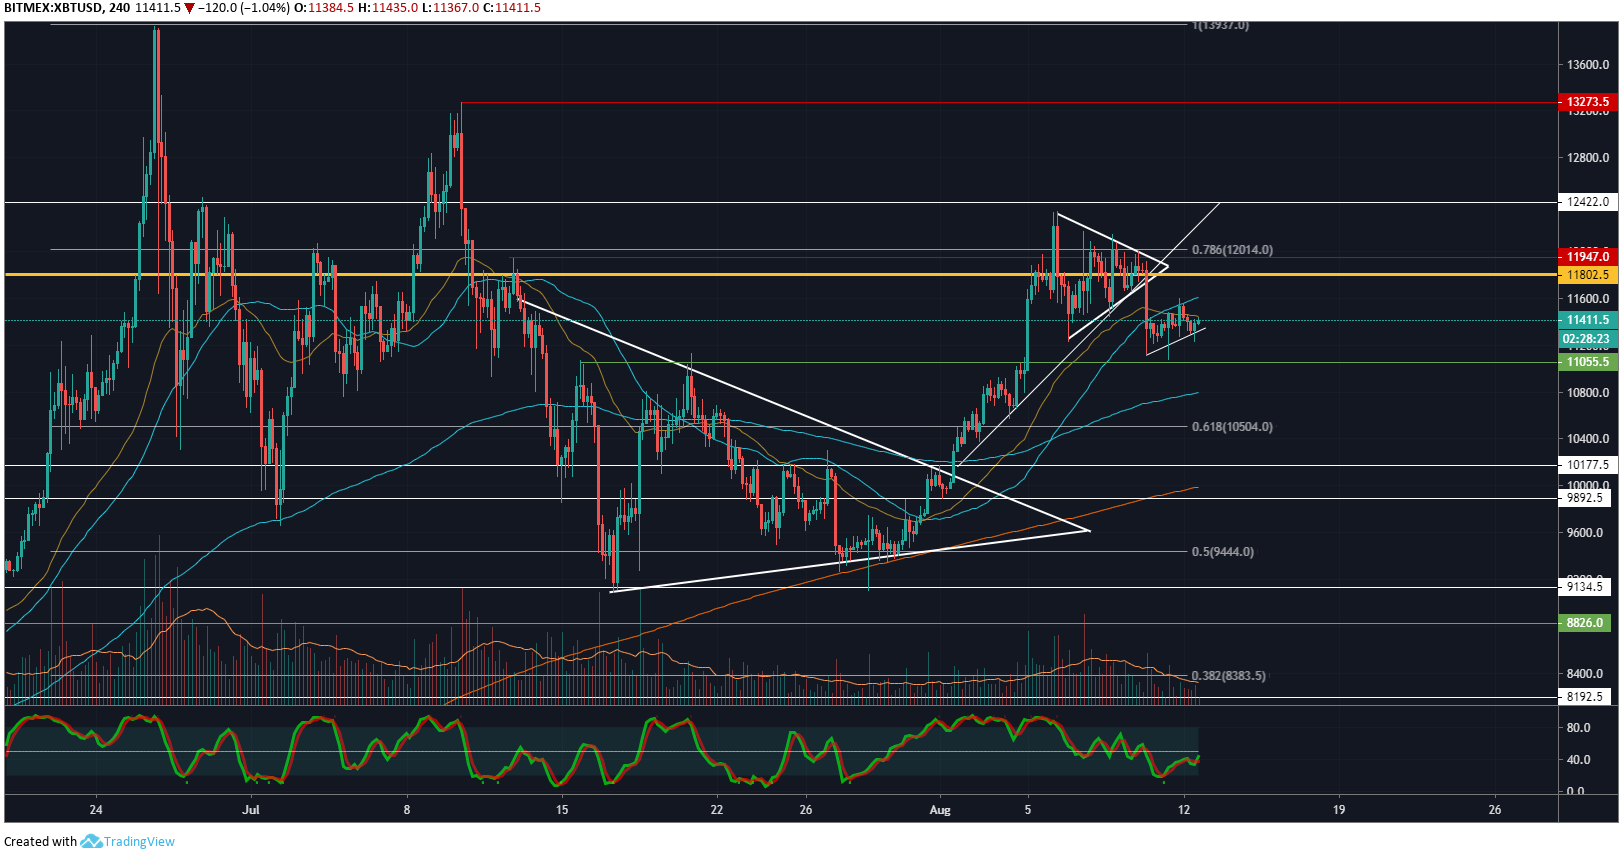
On the 4 hour chart for XBT/USD, we can see the break-down of the asymmetrical triangle mentioned. Speculation that the triangle was indeed a bullish pennant has now been clearly rejected. A break-down of the rising support line was also broken at the same point around $11,700. Since then price levels have been hovering above $11,000 support, the short-term sentiment will largely be determined by whether $11,000 holds or not.
RSI hit oversold flashing a buy signal and has since bounced, heading back for the median 50.0. Volume was rising steadily throughout the build-up to $12,000 and has now started a clear decline. Given that the volume has dropped quite significantly in the last week alone, the price action has managed to hold fairly strong. This could be a sign of weakness from bears. Volume levels will need to pick up within the next few days in order to see any continuation of the short-term bullish trend.
1-Hour Analysis
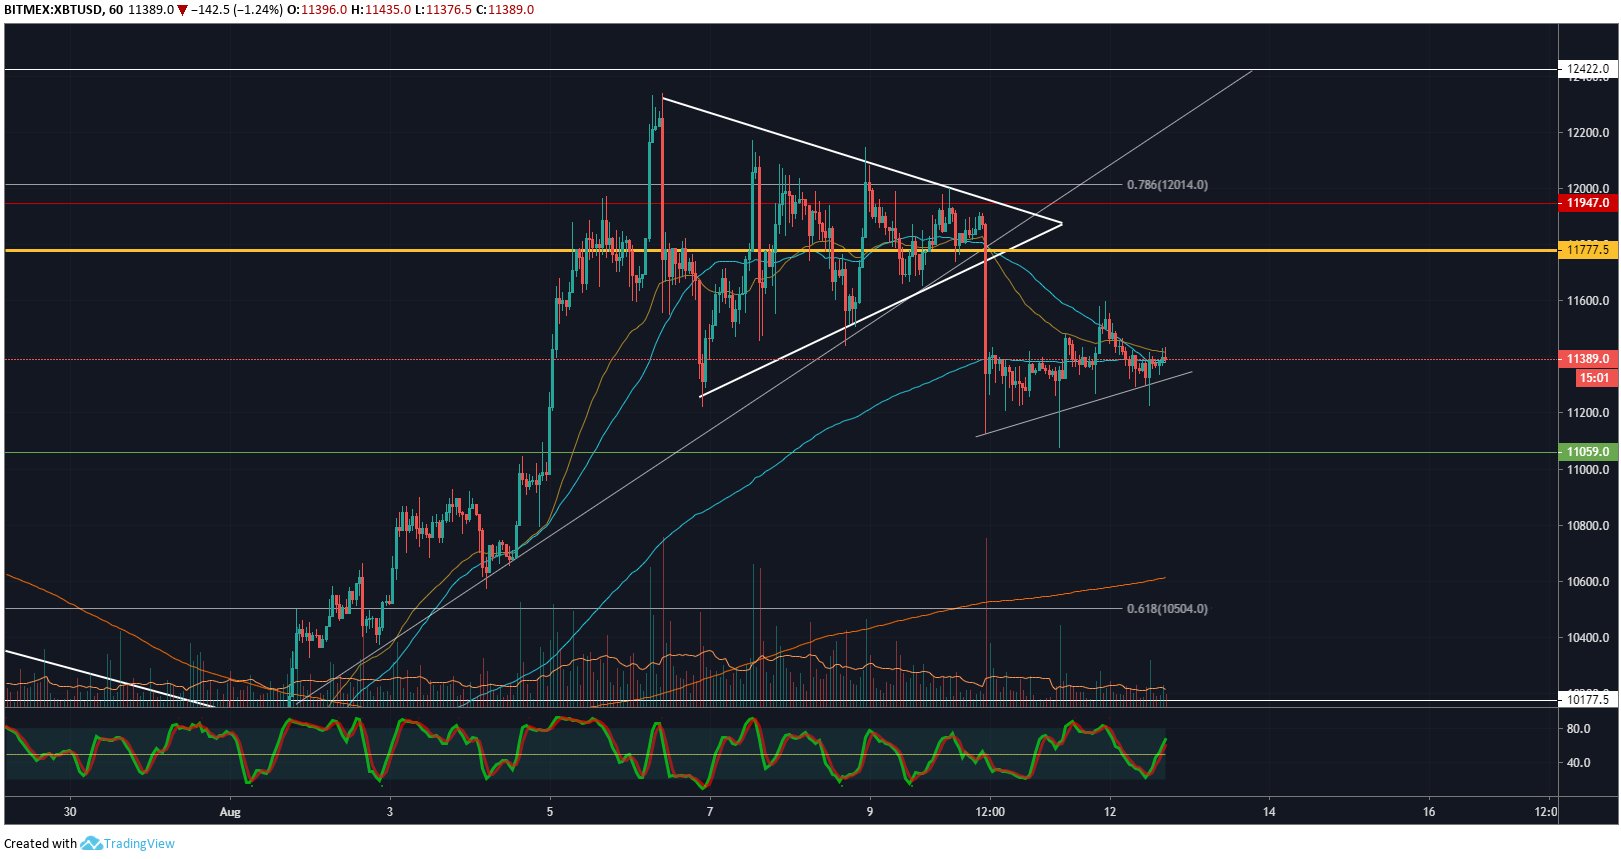
On the 1 hour chart for XBT/USD, we can see the clear break-down of both the rising support and asymmetrical triangle. Price levels since dropped to around $11,100 and have begun a small uptrend indicating selling momentum has come to a halt. 200 EMA can be seen moving completely sideways as it touches the 20 SMMA and 50 MA. This is a sign of consolidation happening again ahead of a big move for Bitcoin.
There are conflicting bullish and bearish indications as this period of short-term consolidation unfolds. I expected to see bears remain convincingly in control of the market price action after the break-down but this has yet to play out. Bitcoin volume remains low and will be the main indication to look out for to determine where price action could be heading.
POC (Point of Control) sitting back at the break-down point around $11,700 sits as the main resistance point. If price levels begin another bullish trend here and surpass the POC mentioned then it’s highly likely price levels will continue to create a new visible range high around $12,400 and above.
Adversely, if price levels make a new visible range low breaking down below $11,000 and holding a sensible support zone to look out for is between $9,800 and $10,170. This support zone visible on the 4-hour analysis provided.
Do you think BTC will hold $11,000 over the coming days? Please leave your thoughts in the comments below!
This article is strictly for educational purposes and should not be construed as financial advice.
Images via Shutterstock, Bitcoin trading charts by Tradingview
The Rundown