BTC/USD Orbiting 23000: Sally Ho’s Technical Analysis – 28 January 2023
Bitcoin (BTC/USD) continued to orbit the 23000 figure early in the Asian session as the pair encountered buying pressure around the 22540.76 area before running into selling pressure around the 23105.23 area. Selling pressure intensified below the 23194.61 area, a level that represents the 23.6% retracement of the depreciating range from 48233.76 to 15460 and one that was initially absorbed when traders lifted BTC/USD as high as the 23824.66 area. This area represented the pair’s strongest print since August 2022. Notably, this new relative high represented a test of an upside price objective around the 23808 area that became technically significant when buying pressure strengthened around the 17927 area. Additional Stops were recently triggered above the 23375 and 23544 areas. Upside price objectives related to buying pressure around the 16326.16 area include the 25455, 25774, 27609, and 28004 levels. Upside price objectives related to buying pressure around the 15460 area include the 23980, 24224, 26612, 26931, 29244, and 29639 levels.
Following the recent move higher to multi-month highs, technical support levels and areas of potential buying pressure are around the 22055, 20960, 20075, 19190, 18095, and 17930 levels. Stops are cited below the 21437, 20874, 20724, 20370, 20233, 20026, 19153, 18448, and 18253 levels. Below current price activity, technically significant areas include the 15900, 15512, 15313, 14500, 14364, 13369, 10727, 10432, 9682, 8837, and 7538 levels. Traders are observing that the 50-bar MA (4-hourly) is bullishly indicating above the 100-bar MA (4-hourly) and above the 200-bar MA (4-hourly). Also, the 50-bar MA (hourly) is bullishly indicating above the 100-bar MA (hourly) and above the 200-bar MA (hourly).
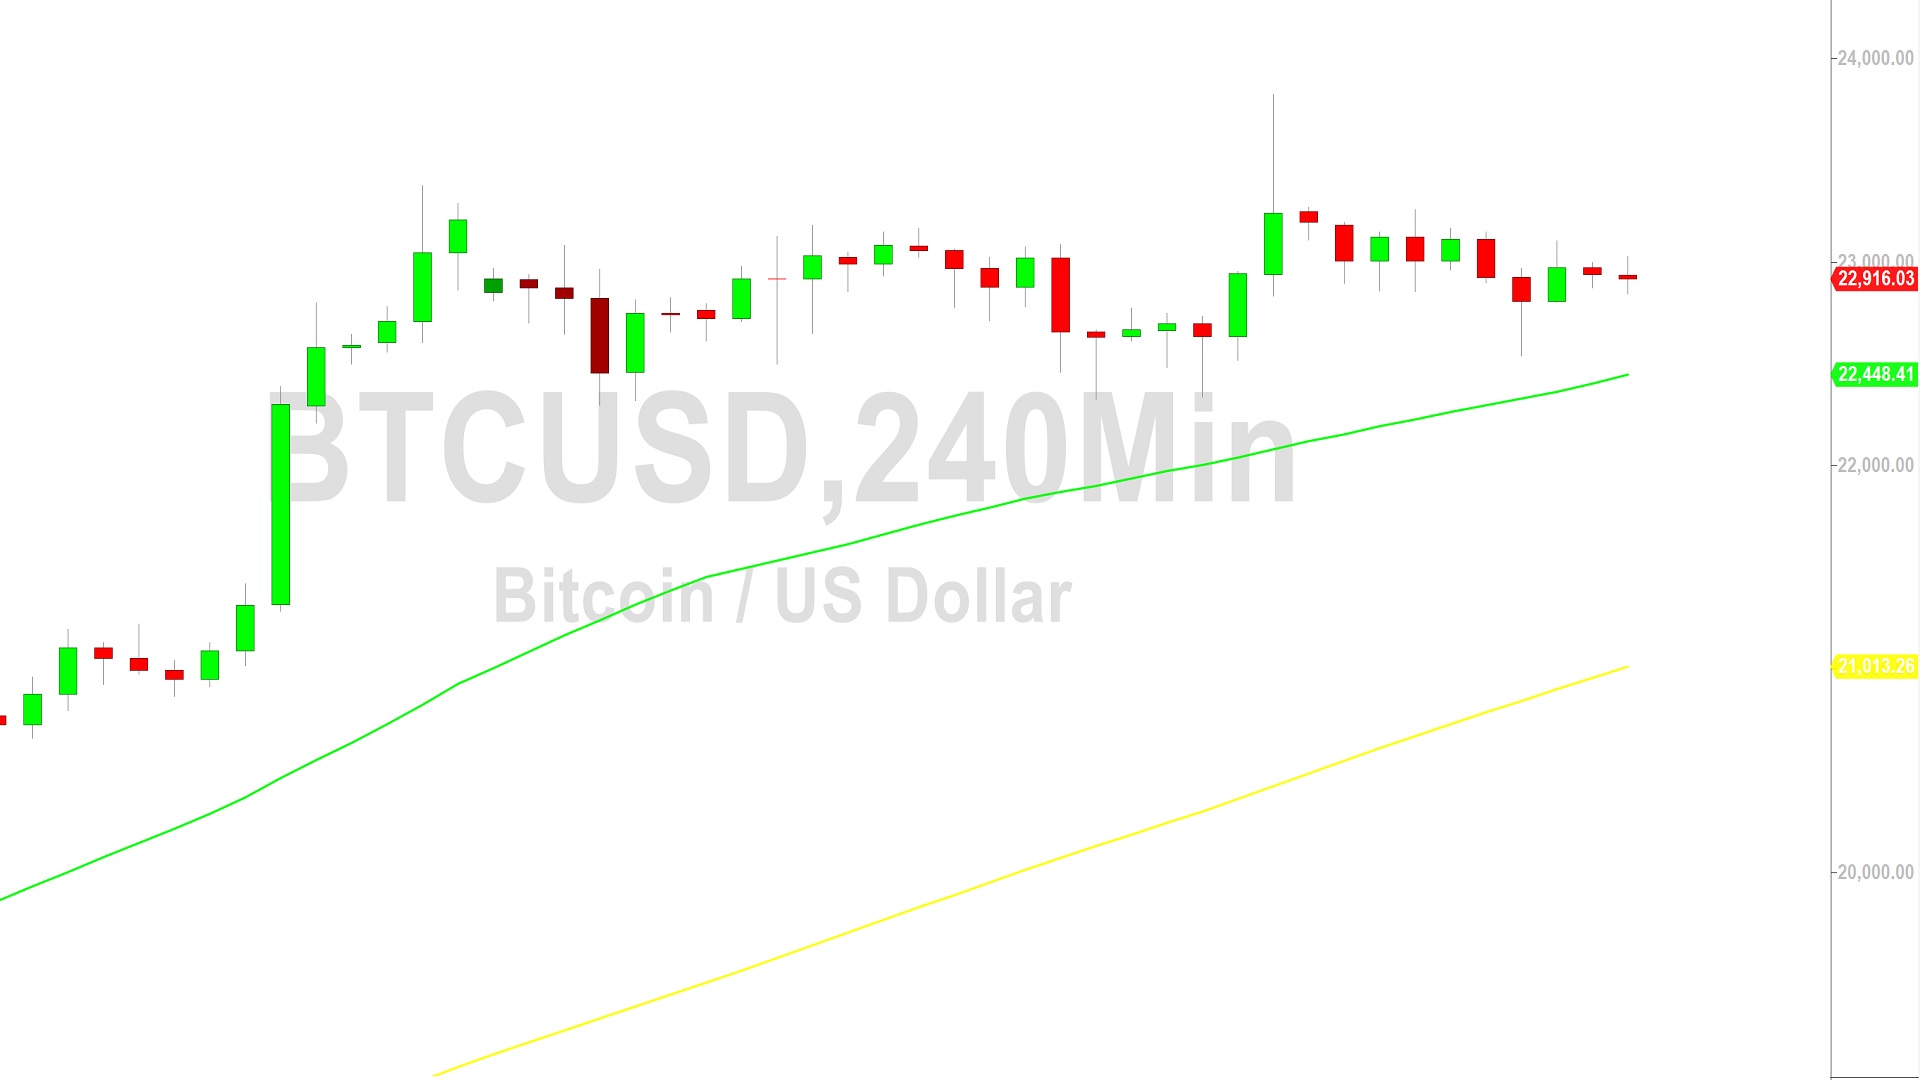
Price activity is nearest the 50-bar MA (4-hourly) at 22448.21 and the 100-bar MA (Hourly) at 22913.07.
Technical Support is expected around 18390.99/ 16714.46/ 14500.15 with Stops expected below.
Technical Resistance is expected around 23544.62/ 24224.60/ 25455.06 with Stops expected above.
On 4-Hourly chart, SlowK is Bullishly above SlowD while MACD is Bearishly below MACDAverage.
On 60-minute chart, SlowK is Bearishly below SlowD while MACD is Bearishly below MACDAverage.
Disclaimer: Sally Ho’s Technical Analysis is provided by a third party, and for informational purposes only. It does not reflect the views of Crypto Daily, nor is it intended to be used as legal, tax, investment, or financial advice.