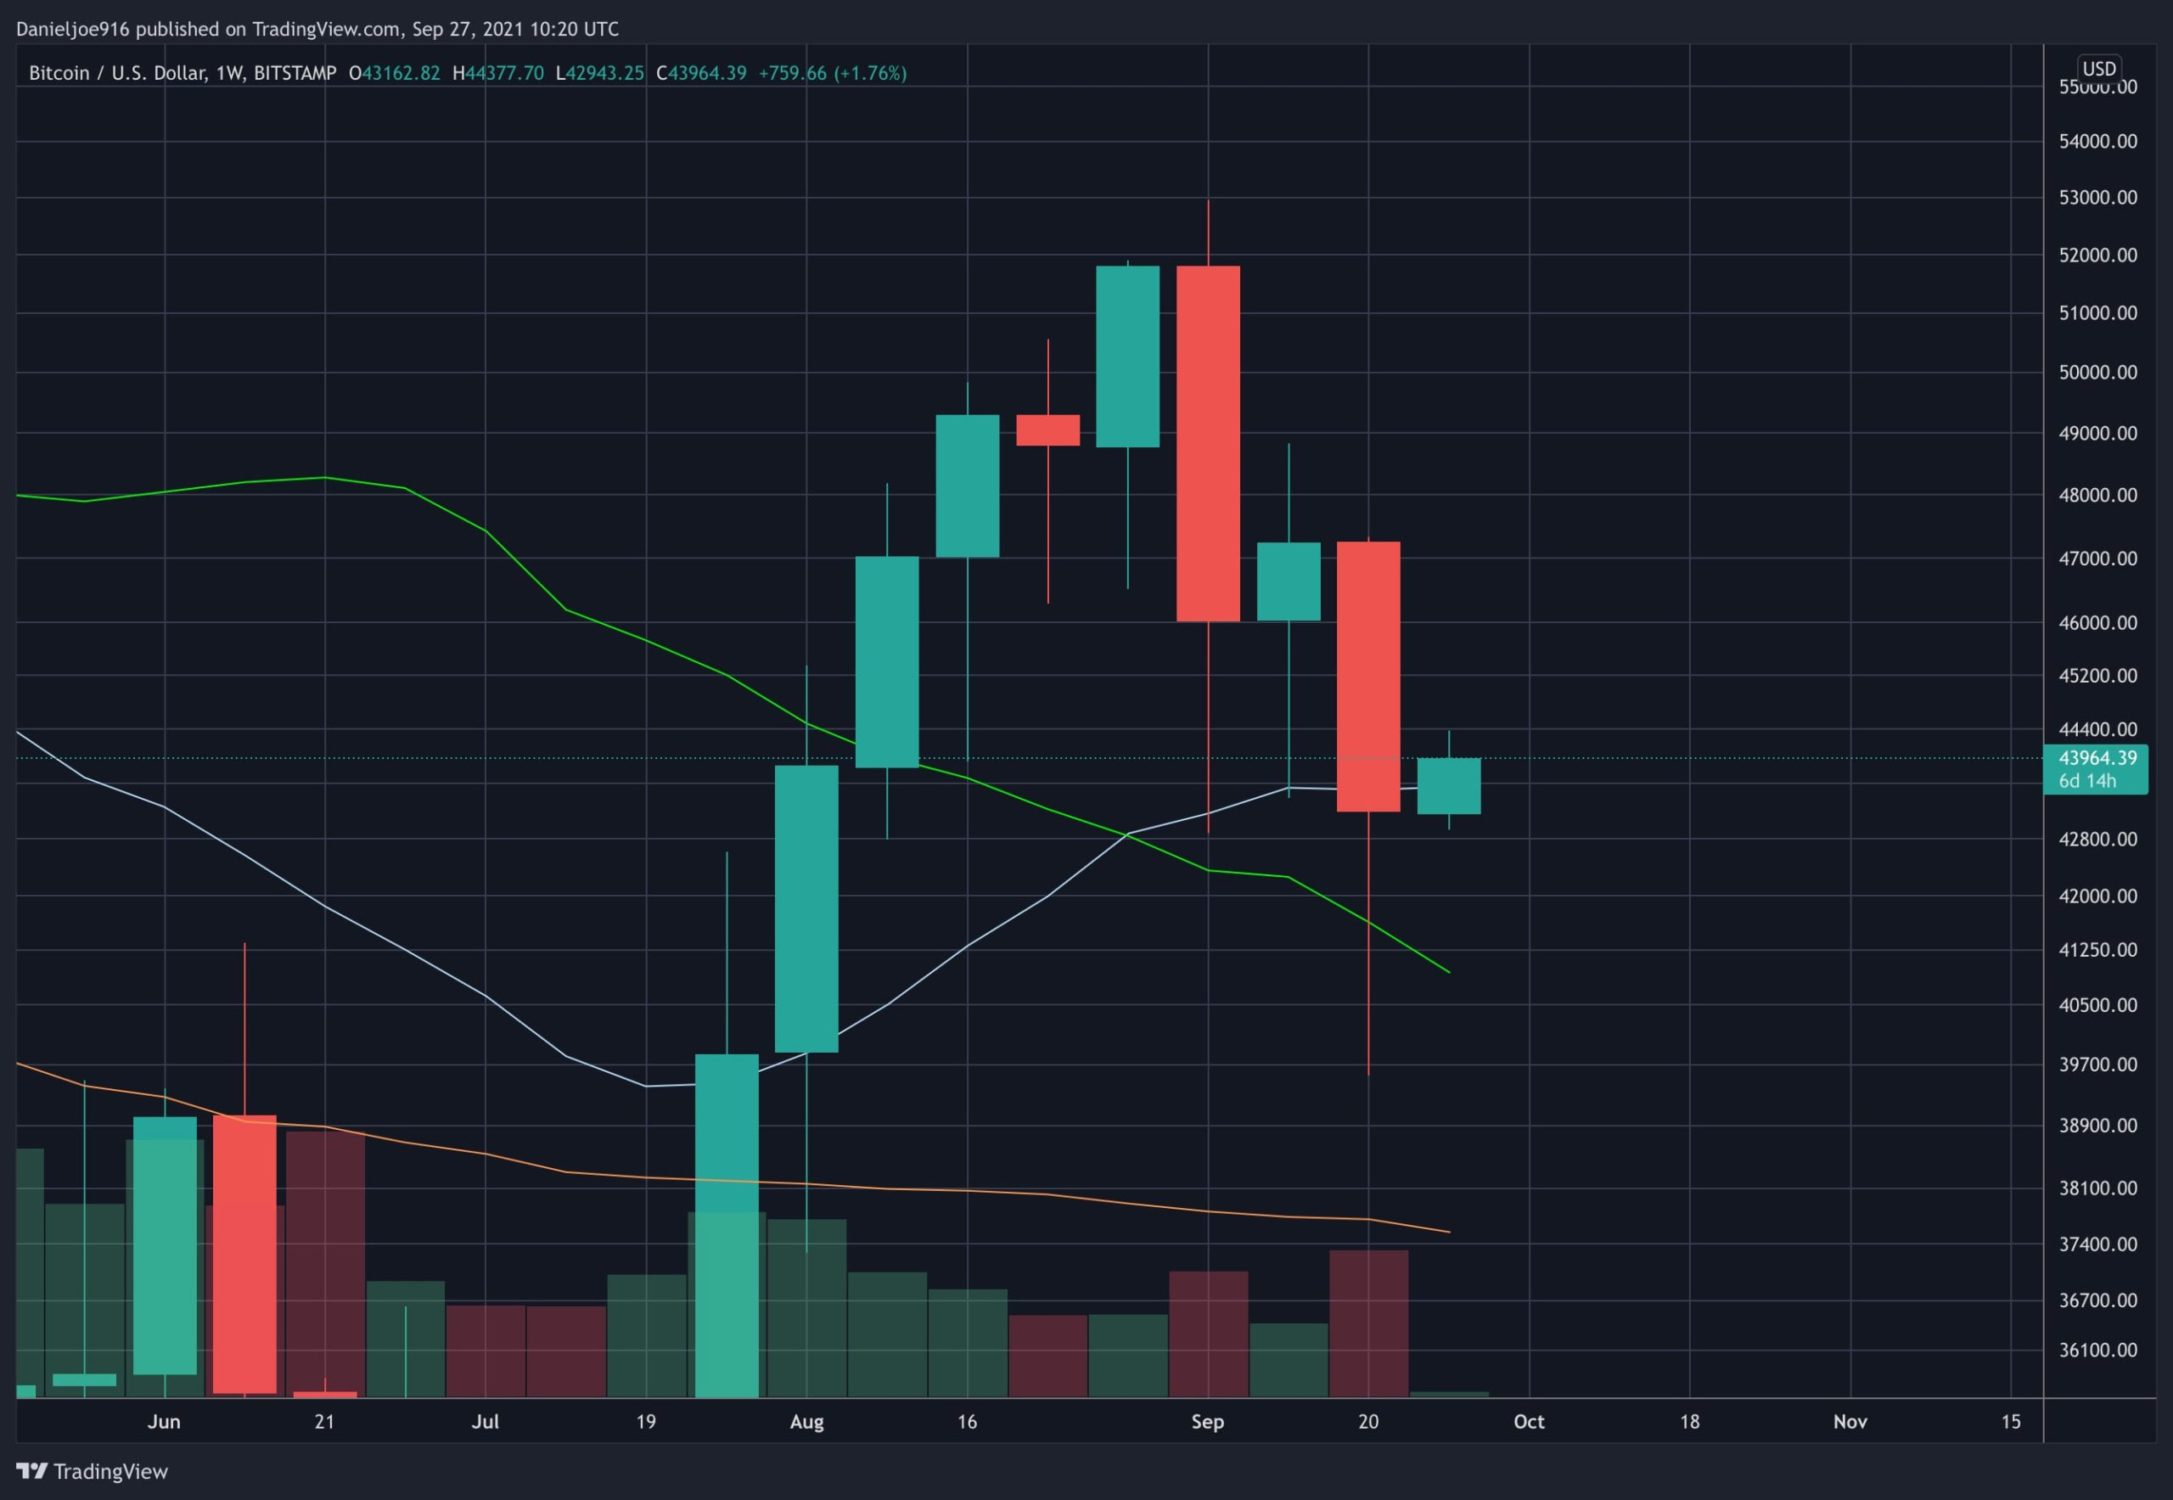
After another wild week of liquidations and panic selling, BTC staged a late-day rally heading into the weekly close. It closed slightly below the 21-week EMA but managed to hold a larger technical structure by staying above $40k and $41.3k.
$40.7k has been a very key level as this is the deepest higher low, which has been tested twice already, and managed to hold. So far, the pullback from $52.9k to $39.5k has followed a 3 wave move down, suggesting this is a corrective wave, quite common to see after a large rally.
Elliott Wave Suggests Wave 2 Near Completion
So far, BTC appears to have made a higher low at $40.7k. The next step in confirming Wave 2 completion will be making a higher high above $45.1k, the intraweek highs from last week. This is critical for near-term price action as technical analysts are waiting to see if Wave 3 is forming to the upside.
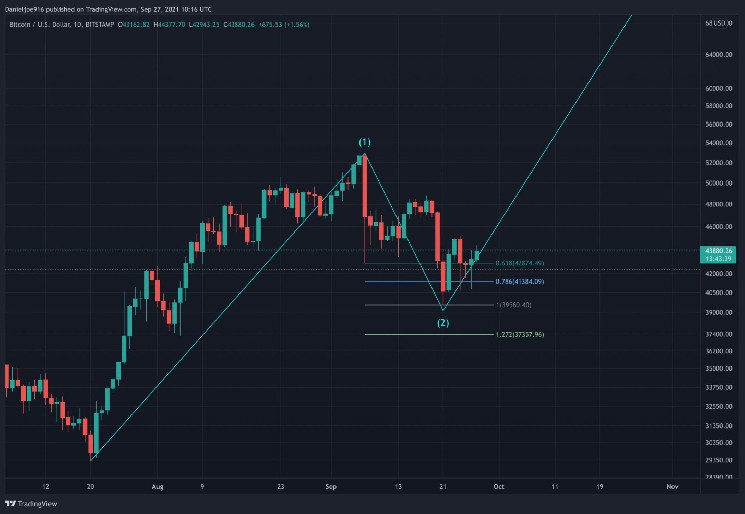
Elliott Wave suggests the move from the lows at $29.2k to $52.9k could be the start of Wave 1 to the upside. The recent pullback from $52.9k to $39.5k could be the Wave 2 corrective wave. Whenever the bottom is confirmed, BTC is expected to start Wave 3, typically the largest impulse to the upside.
The larger structure continues to hold as $40k has been established as a very strong level of technical and on-chain support. During the liquidations last week, cascades of forced selling pushed price intra-day below $40k, with BTC managing to hold support on a daily close with higher volume. This suggests larger buyers stepped in as BTC tested major support at $40k.
3-day and Weekly Chart Still Bullish
Despite a slight weekly close below the 21-week EMA, the 3-day and weekly charts remain bullish when looking at the overall trend and structure. BTC tested the 21 week MA at $41.7k and held support on a weekly closing basis.
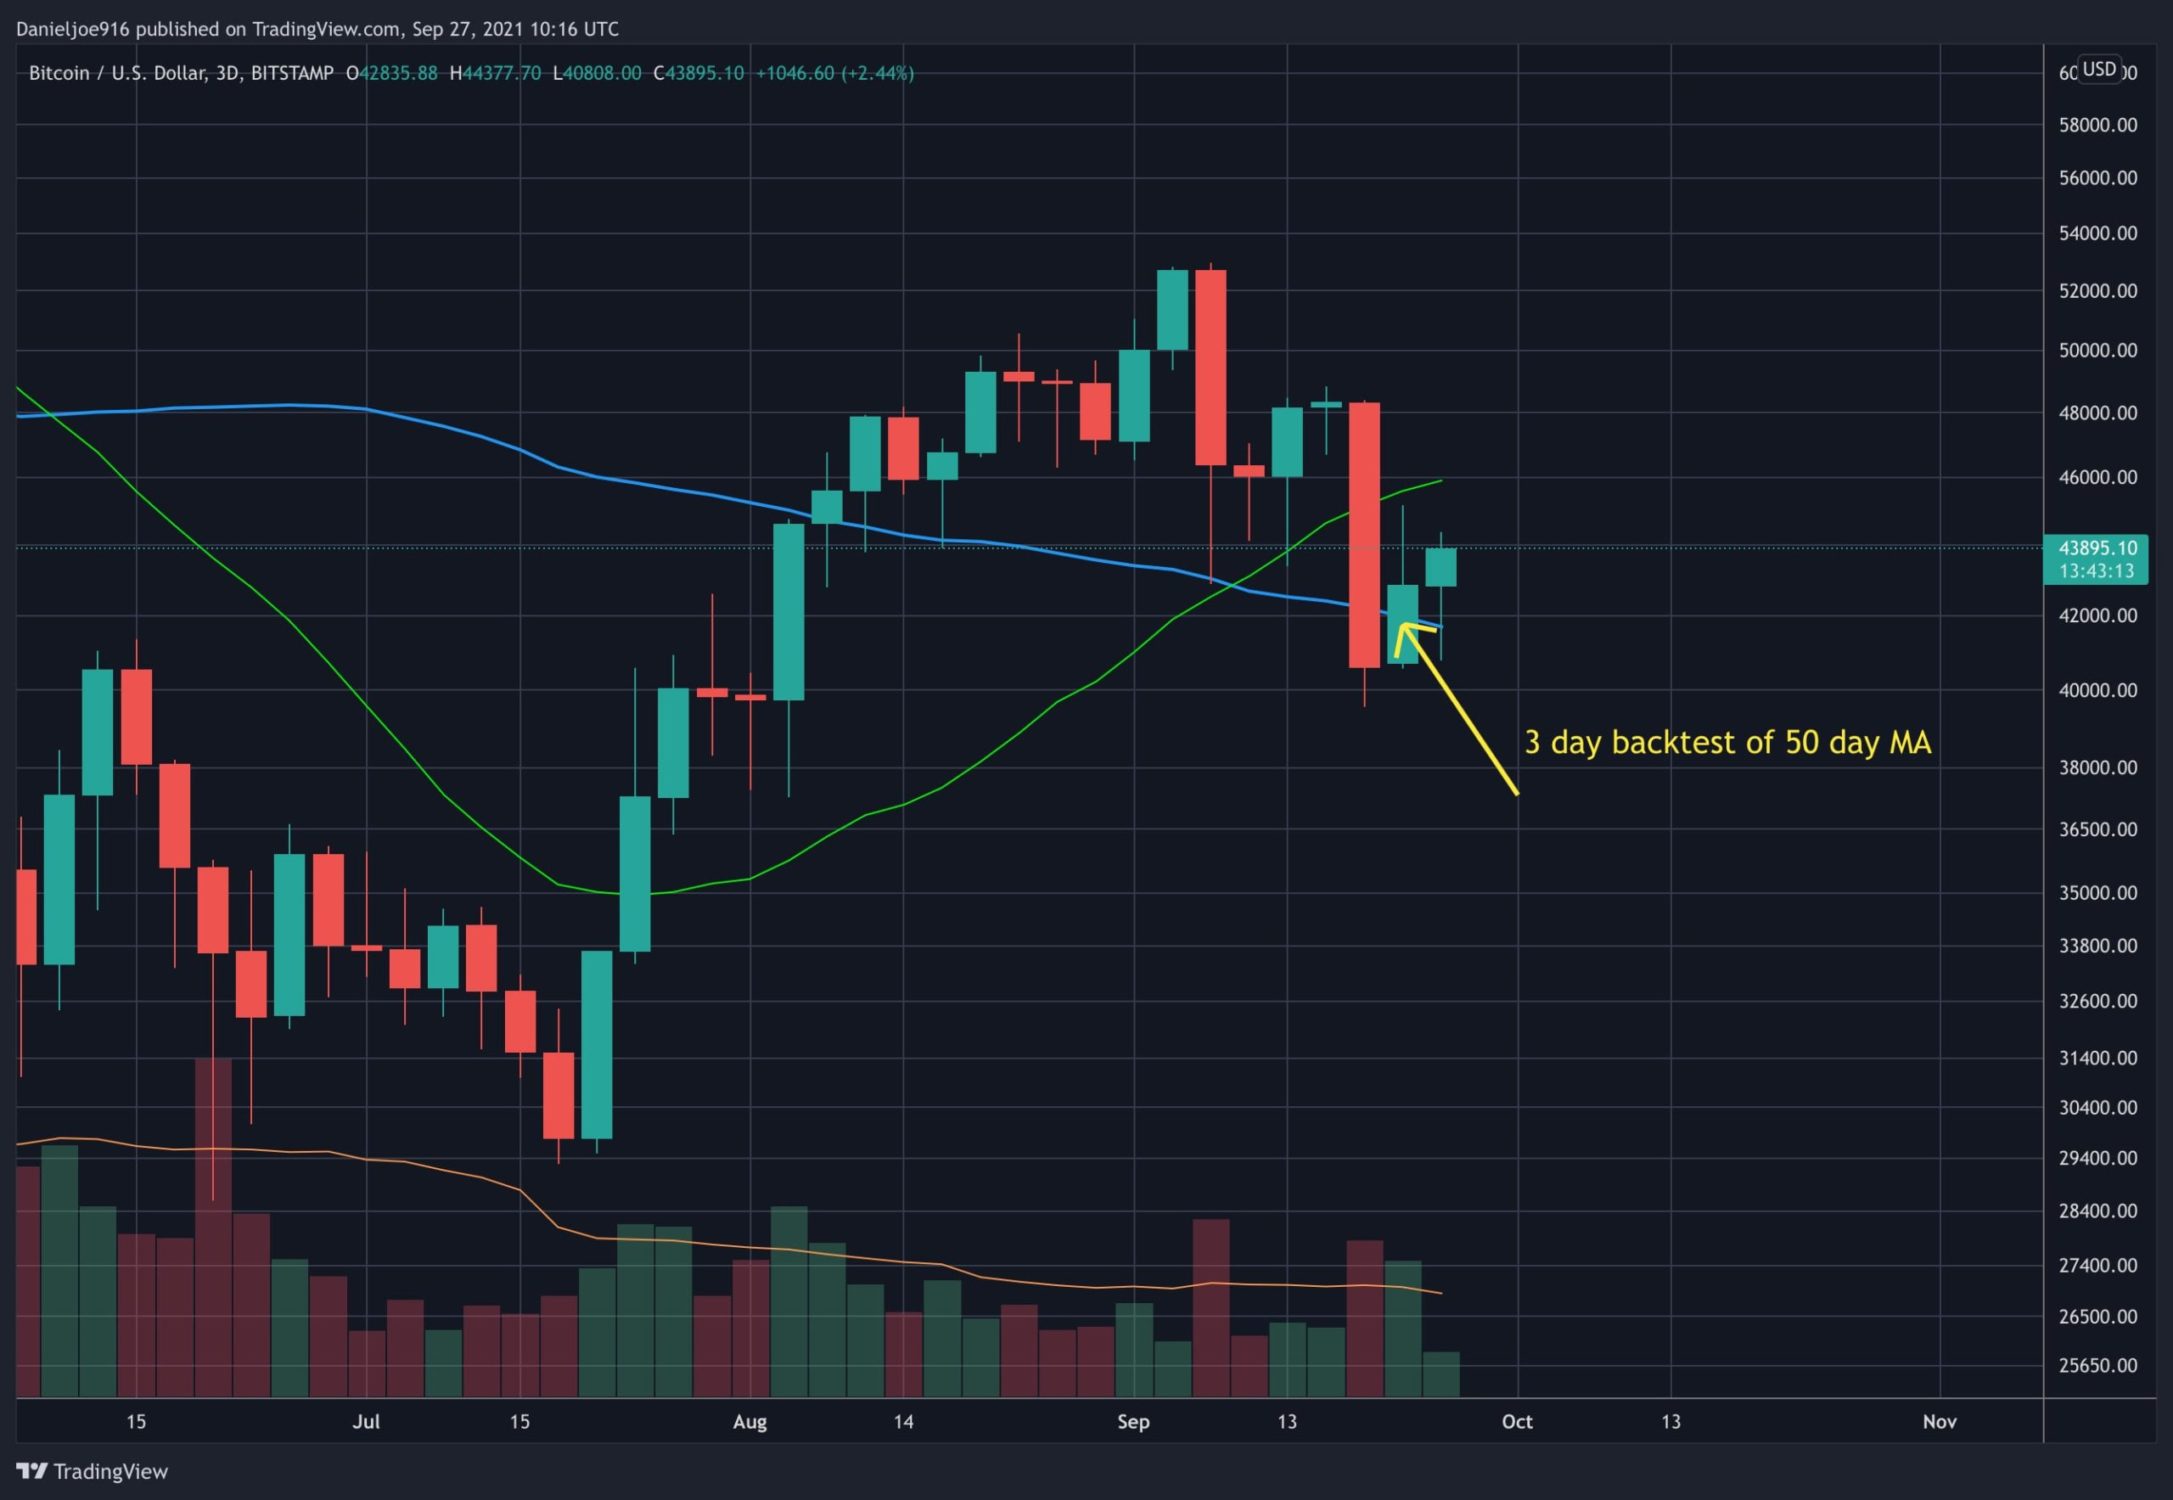
The 3-day chart continues to show strength especially with the bullish crossover where the 21-day MA crossed above the 50-day MA. This is a mid to long term signal of further upside, often leading to multiple backtests of support at the 21-day and 50-day MA on the 3-day chart, before a large rally begins.
The recent volatility pushed BTC down to retest the key 50-day MA on the 3-day chart at $42.2k. BTC made a 3-day close below this key level but managed to snap back the next few 3-day candles, a near-term positive signal. The recent price action on the 3-day chart is very similar to conditions back in October 2013. Stay tuned for an in-depth analysis of the similar technical and on-chain conditions on why the BTC bull market has significant upside ahead.
On-chain Metrics Remain Strong
The near-term charts may look bearish, but the underlying strength in fundamental and on-chain continue to trend higher, strongly suggesting the disconnect between price and fundamental will likely close soon. The past week’s selling pressure came from mass liquidations, flushing out the derivatives market, causing younger coins to panic sell at the lows again.
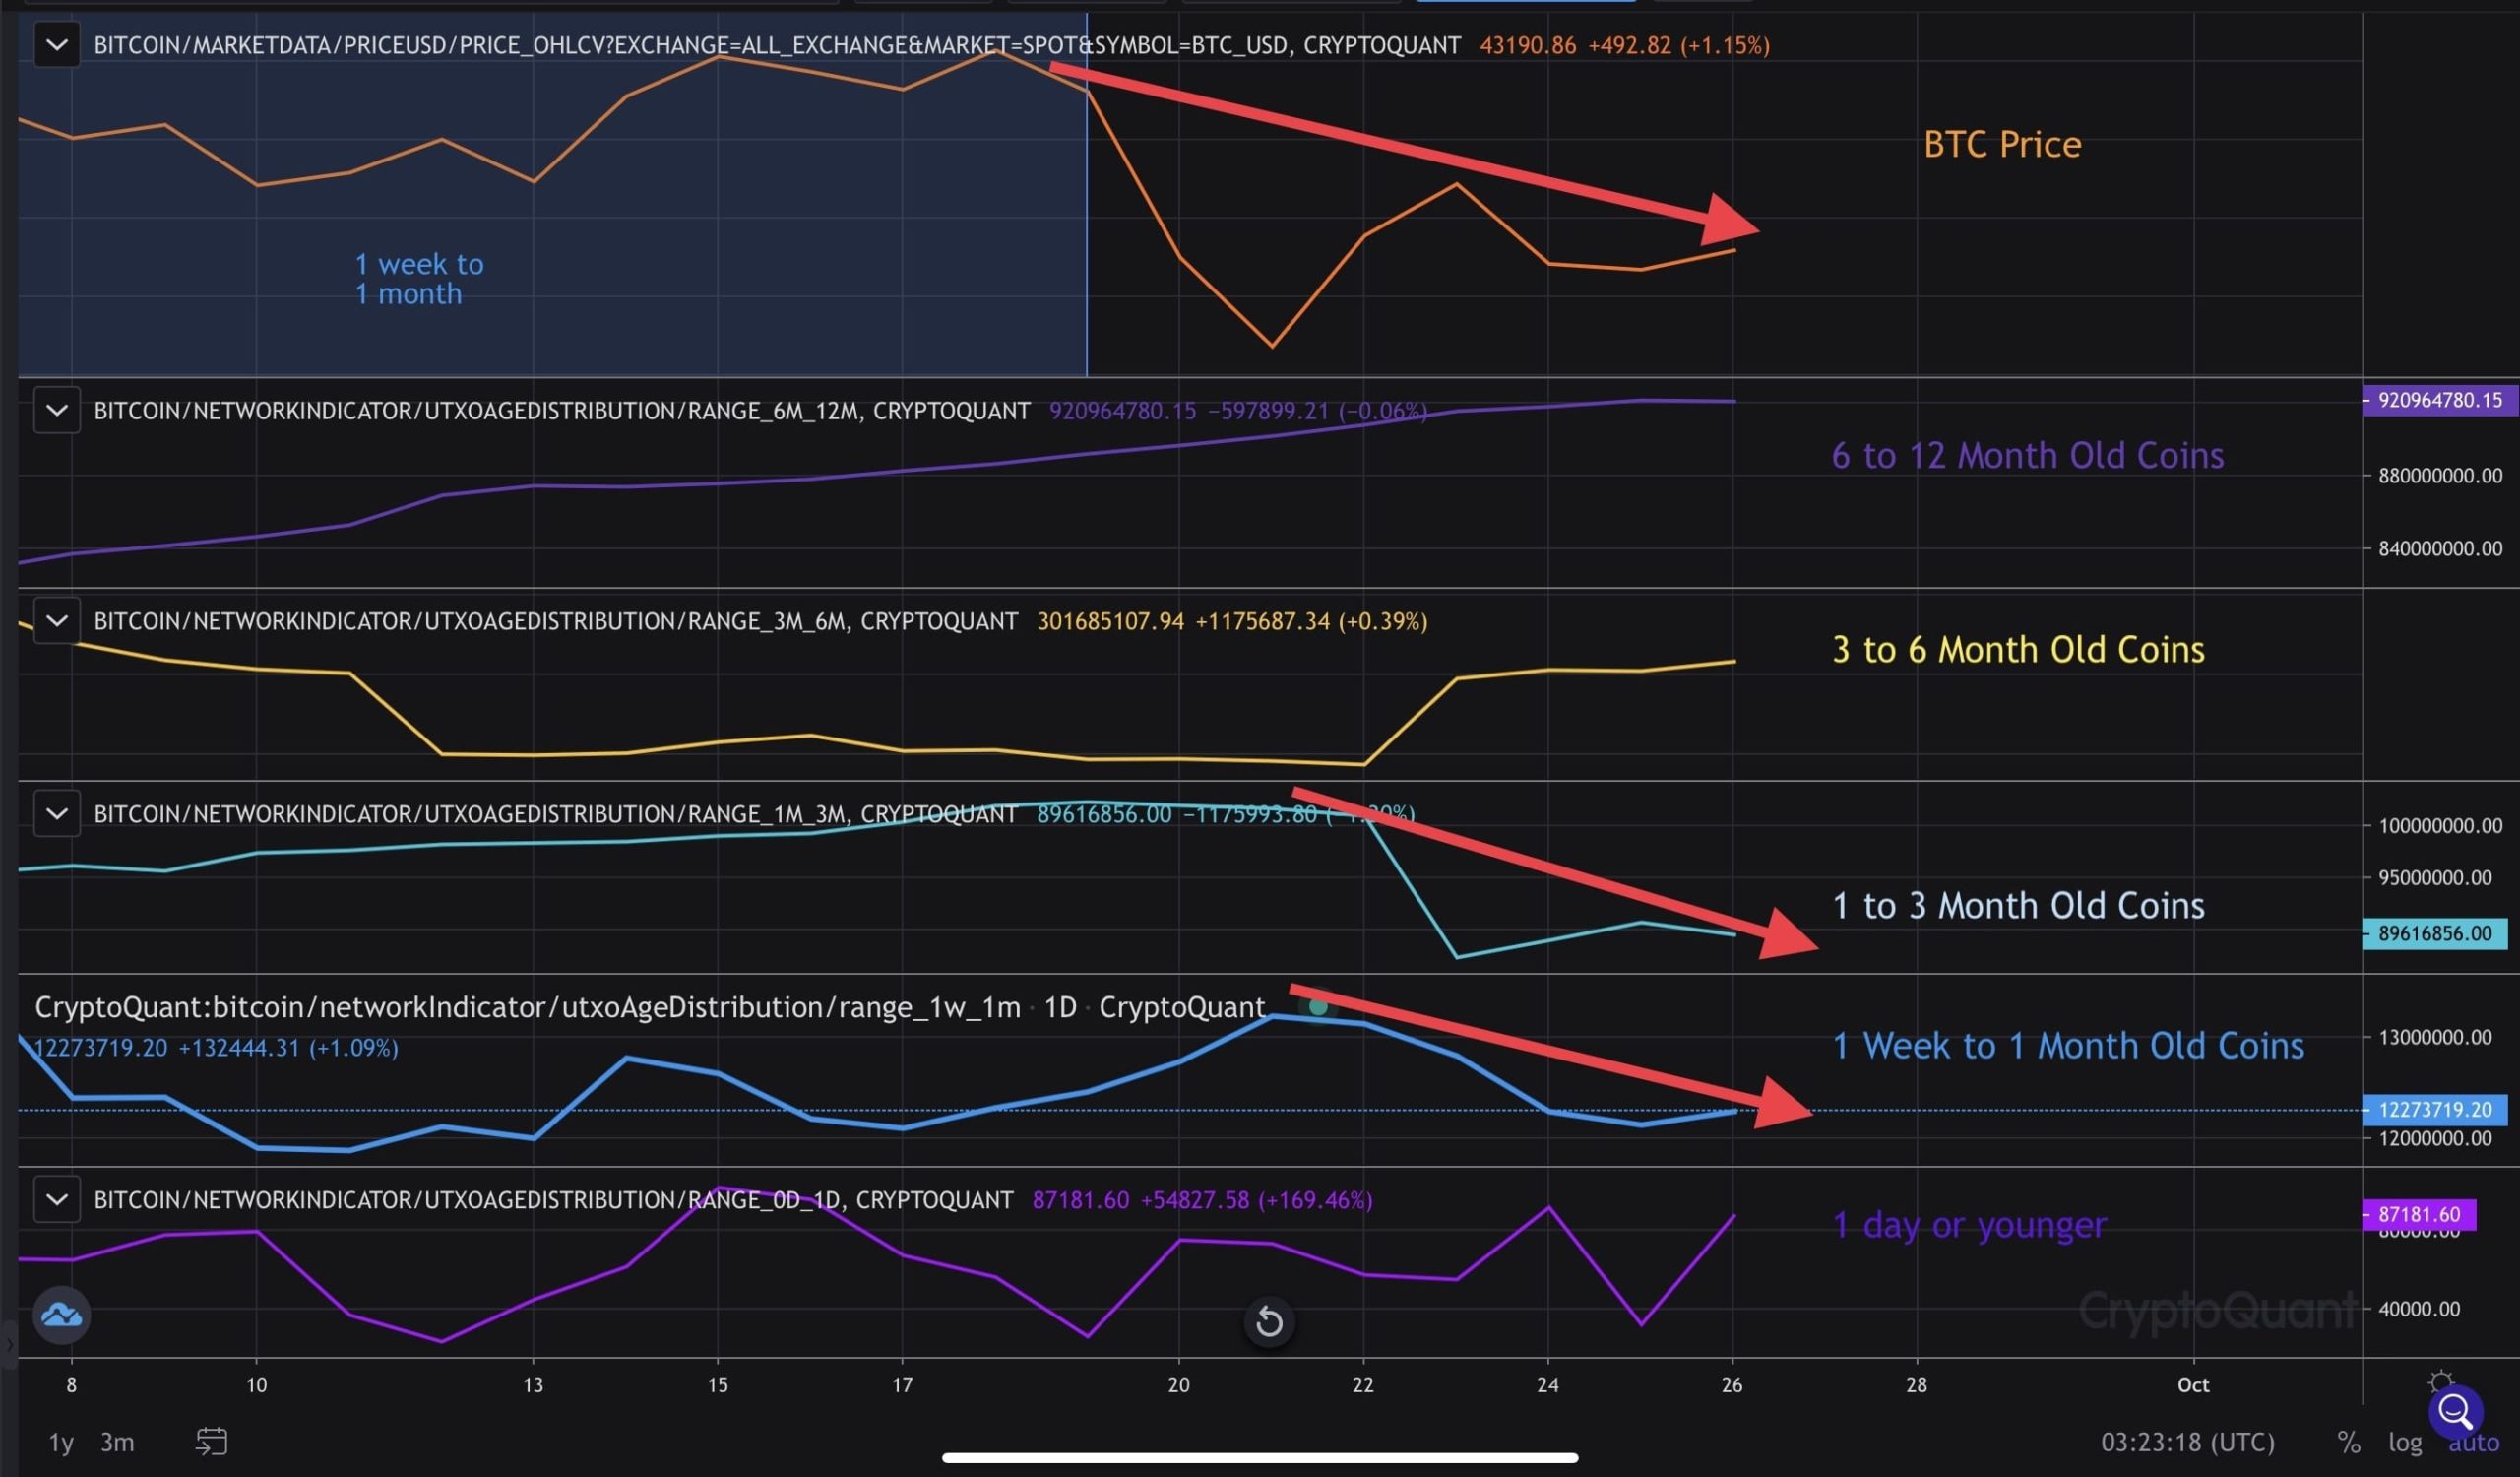
As usual, large investors and entities holding older coins came in and scooped up BTC in the lower $40k range. Even with a drop of 25% from the highs at $52.9k, spot exchange reserves continue to trend lower. Since the highs from September 7th, 2021, spot exchange reserves have fallen by 11,723 BTC, a strong indicator of accumulation. Spot exchange reserves continue to remain at multi-year lows, as investors continue to withdraw BTC off exchanges.
BTC Miners have sold 2,968 BTC in the past week as the market pushed lower from liquidations and panic selling. This may look like a large amount of BTC, but keep in mind, this is nearly 3,000 BTC out of total miner reserves of 1,850,000. So far this year, miners remain in net accumulation even with a 55% crash, countless FUD, and multiple liquidation events. The miners continue to hold BTC, showing no major signs of selling pressure.
Mean Coin Age by CryptoQuant continues to trend higher for the week indicating long-term holders continue to accumulate and hold while younger coins sell. The mean coinage is not showing any signals of a bear market because previous transitions from bull market peaks into bear markets caused the metric to continue declining.
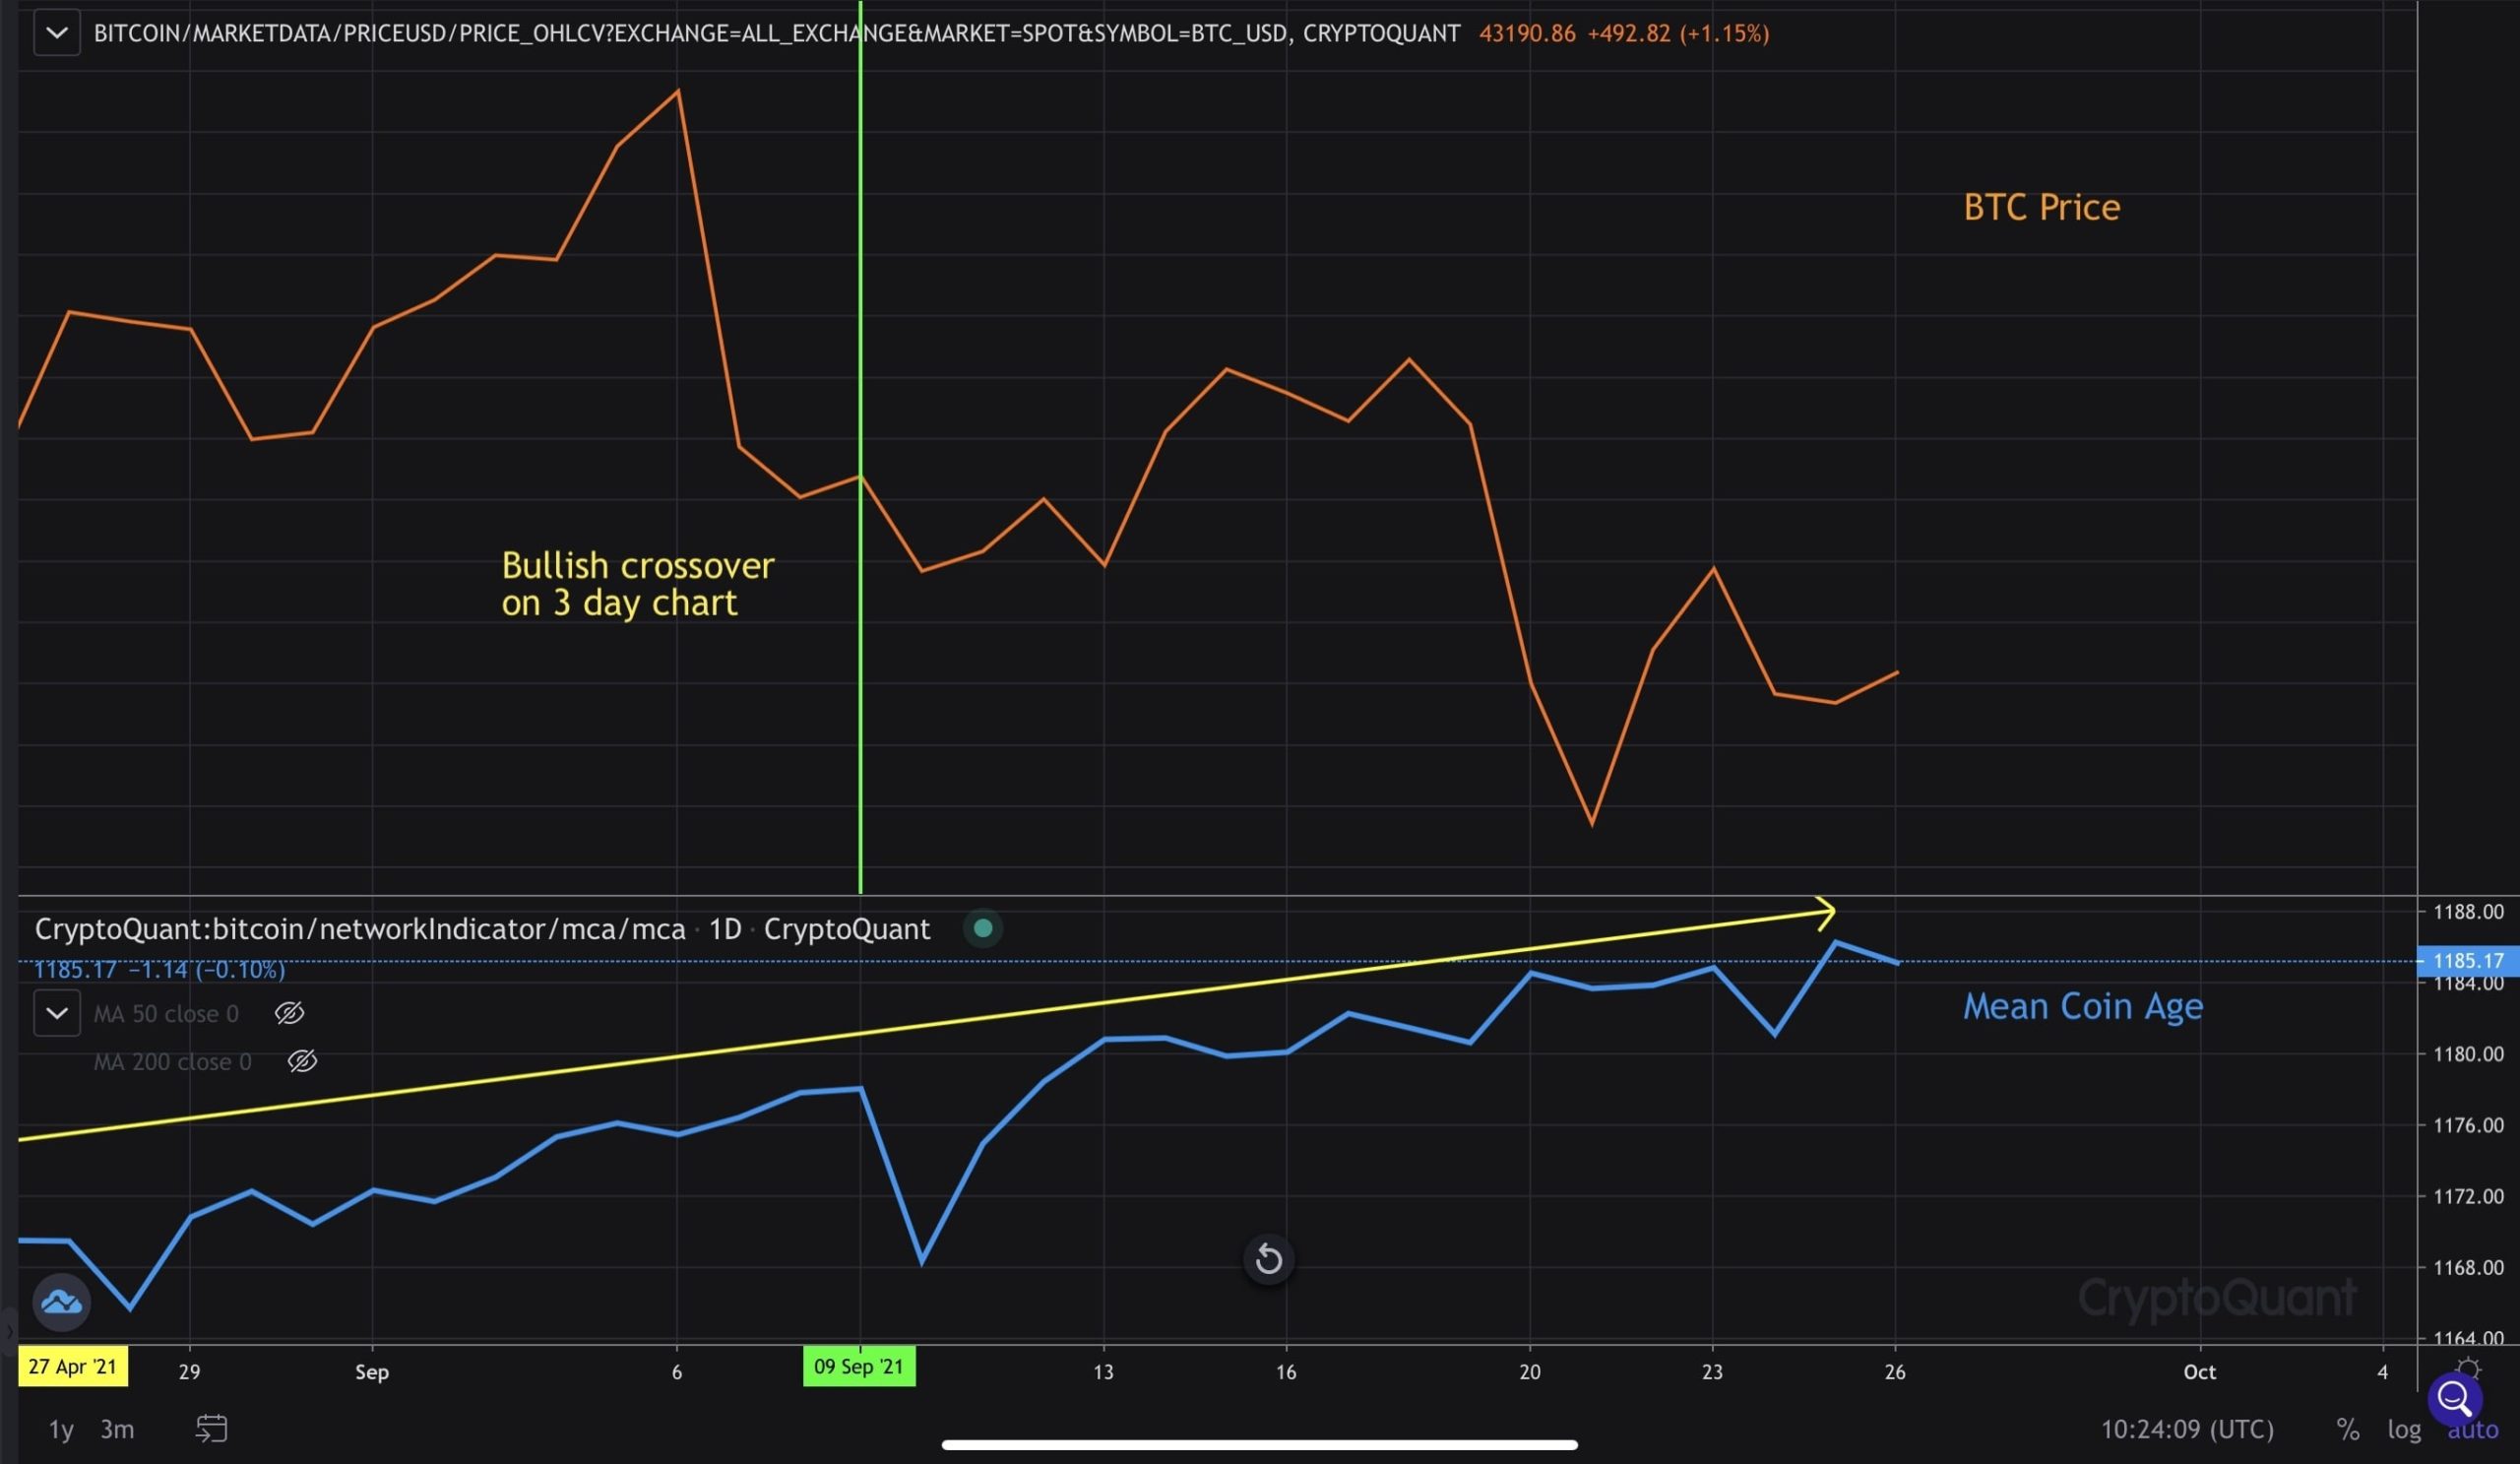
The crash in May 2021 did not lead to significant distribution from long-term holders. Instead, they went back into accumulation throughout the multi-month consolidation between $30k to $40k, suggesting this is a mid-cycle pullback. The overall trend in on-chain data continues to suggest BTC is not in a bear market, and the continuing supply exhaustion will likely lead to significantly higher prices in the coming months.
Macro Conditions Remains Bullish
The SPX managed to print a large hammer candle on the weekly chart last week, indicating risk appetite could be coming back to the market. Although sentiment remains bearish as many are calling for a cyclical top in markets, it’s important to consider there are trillions in cash remaining on the sidelines, the Fed balance sheet continues to make record highs, and rates remain at zero.
Major tops in the market occur when the majority sentiment turns bullish, funds are fully deployed, and rates have been trending higher. None of this is happening, which suggests risk assets have further upside, potentially until rates start to increase possibly in late 2022 or later. With fiat currencies losing value and purchasing power, investors will continue to search for stores of value, likely making stocks, real estate, and Bitcoin the desirable assets to own in the current macro environment.
 cryptopotato.com