Bitcoin’s recent uptrend has paused temporarily upon arriving at the major swing level of roughly $22.8K. Although there are some bullish signs based on the on-chain analysis, there is a significant resistance region ahead in Bitcoin’s path.
Technical Analysis
By Shayan
The Daily Chart
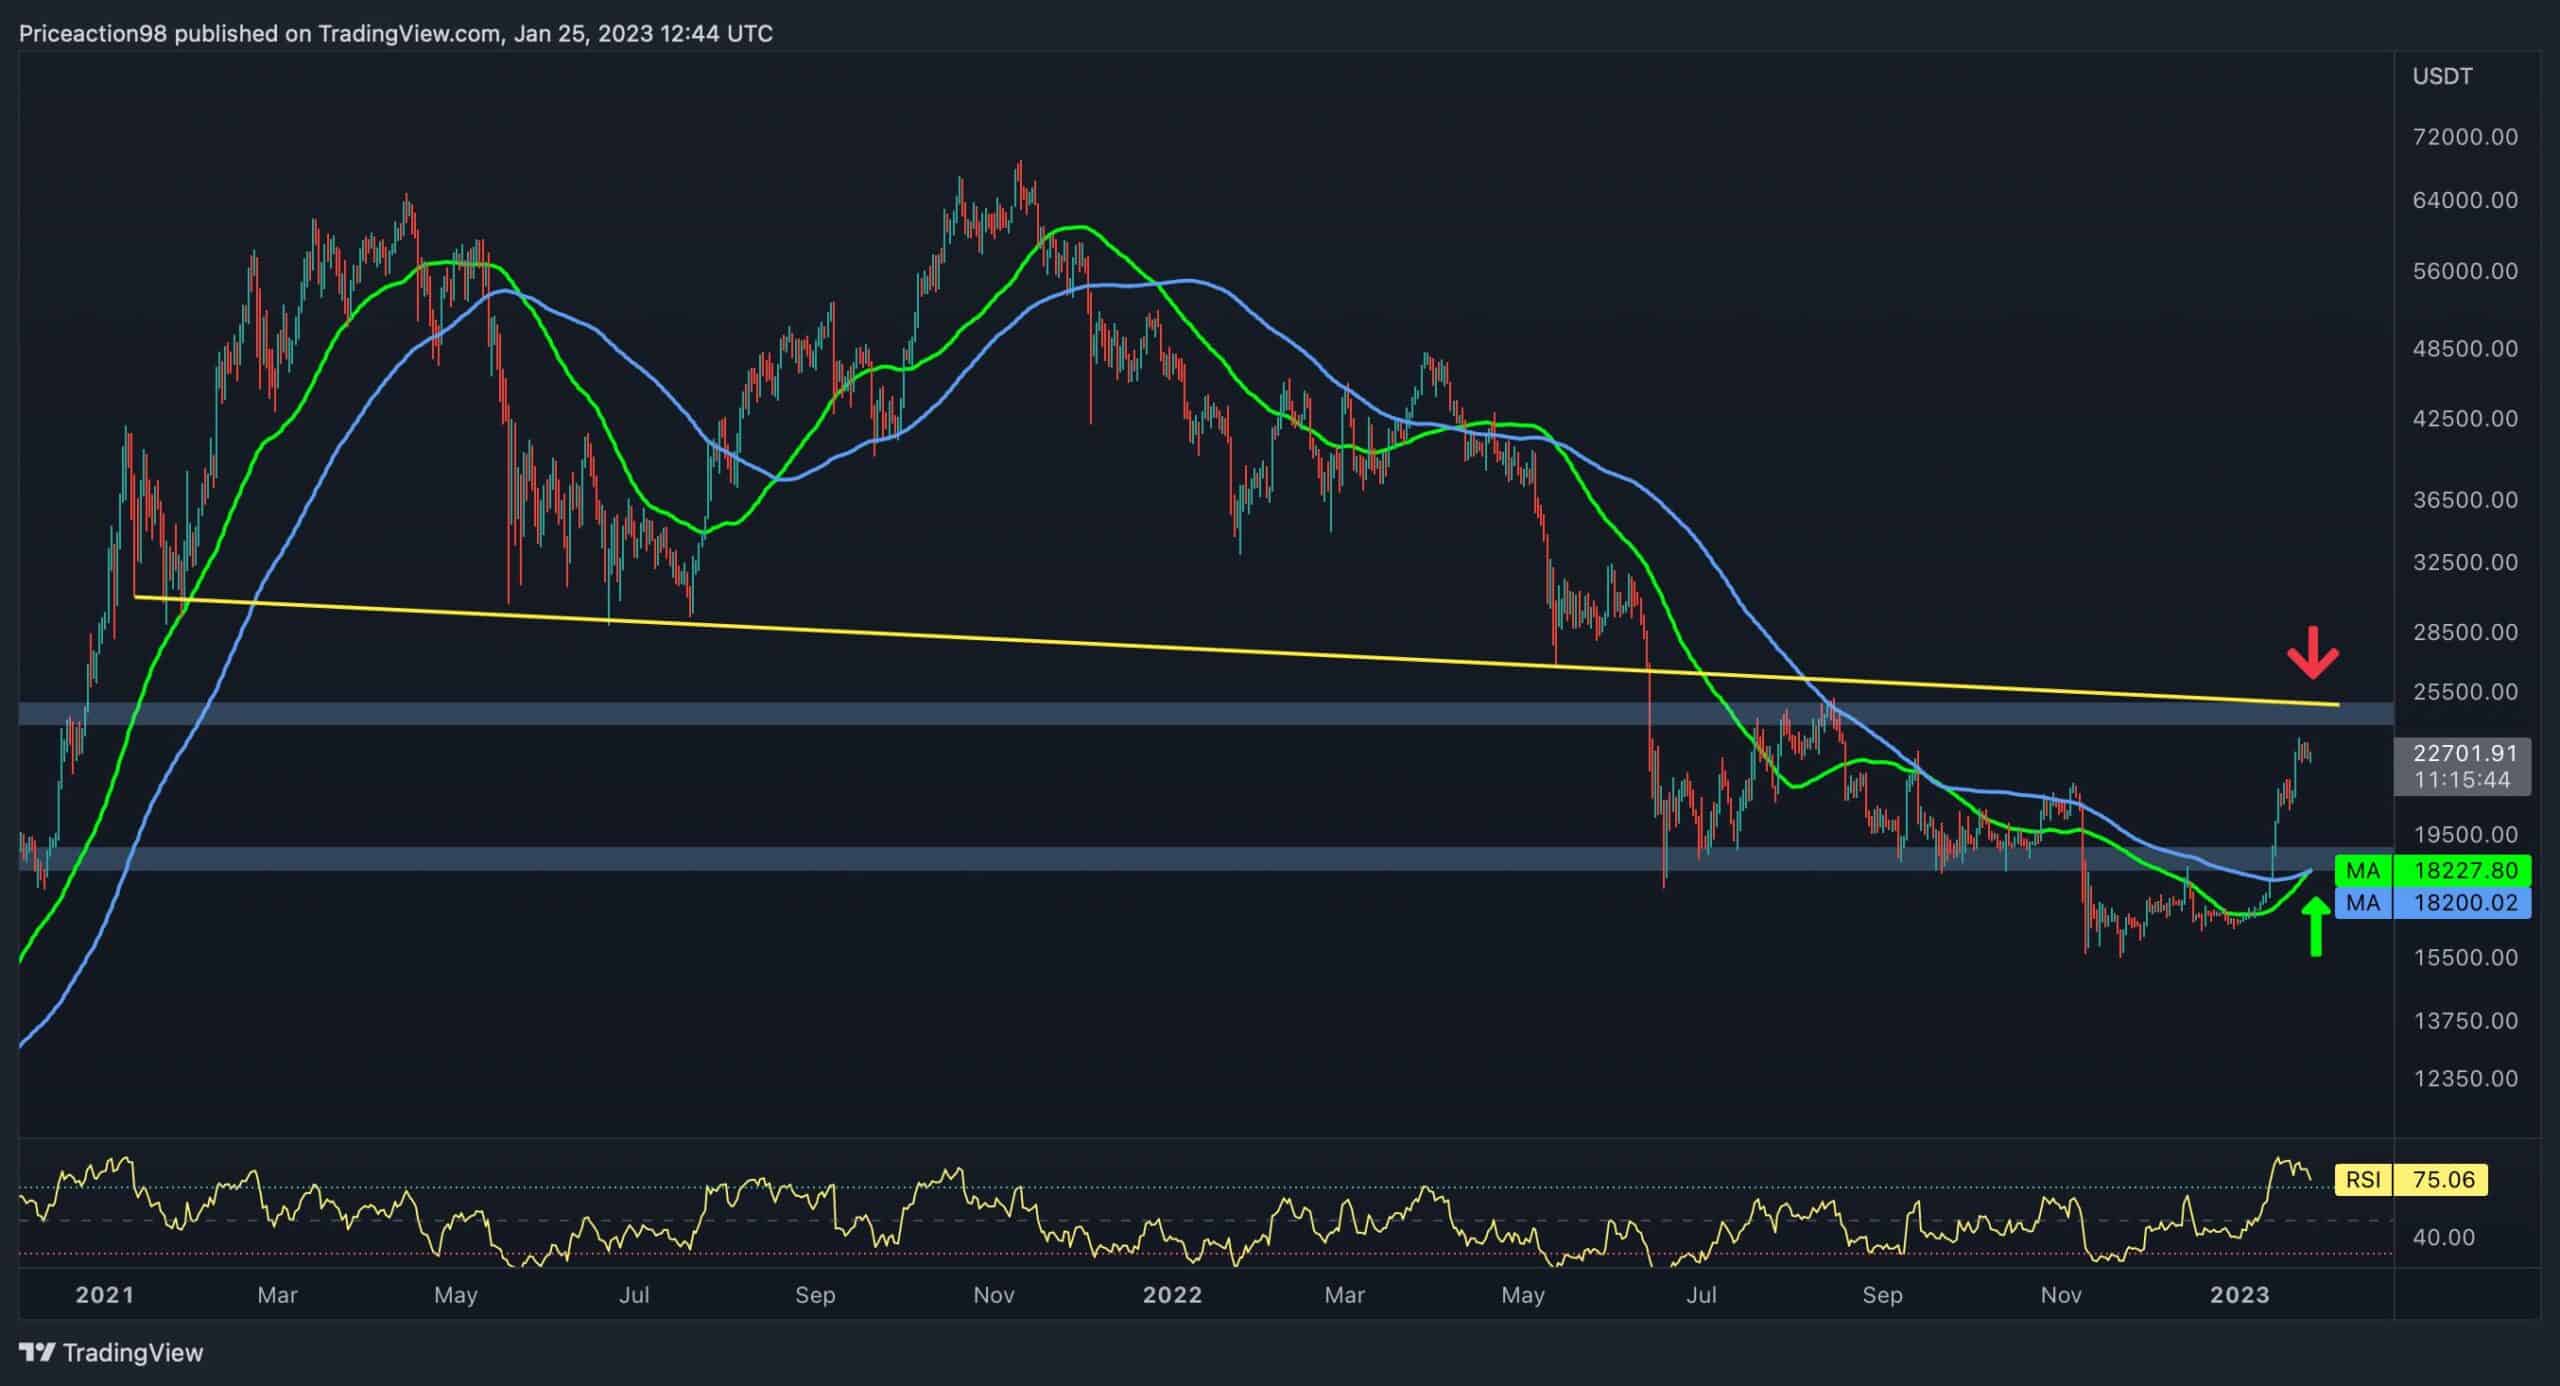
The market appears to be looking for direction as the price has now reached a critical resistance zone. The descending trendline had been supporting the price until Bitcoin experienced a sudden cascade and dropped below it in late June 2022. This trendline then turned into a substantial resistance level and has rejected the price ever since.
However, Bitcoin has initiated a surge and currently aims to surpass the trendline, which presently stands at approximately $24.5K. A valid breakout should facilitate the uptrend and result in an impulsive bullish move.
It’s also worth mentioning that the 50-day moving average is about to claim the 100-day moving average, a well-known bullish indication for the market structure, implying that a new bull run might occur soon.
The 4-Hour Chart
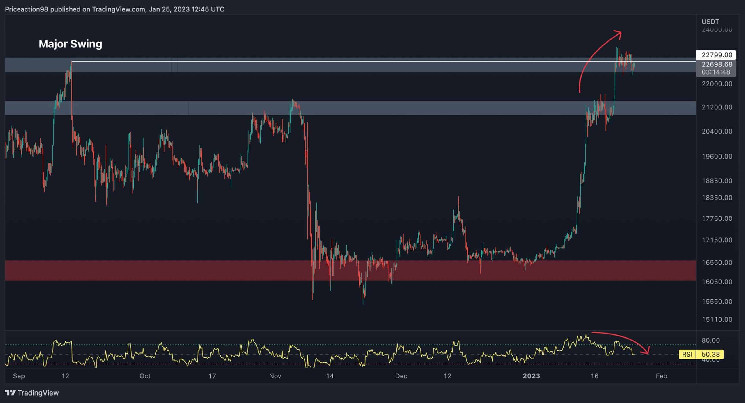
Bitcoin’s price is currently consolidating at a vital resistance zone of $22.5K, which also aligns with a prior major swing at $22.8K. In case of a breakout, the market may attain adequate demand and could expect another short run towards the $25K crucial resistance level.
However, by comparing the price and the RSI indicator’s behavior, a significant bearish divergence can be identified in the 4-hour timeframe, which could potentially result in a reversal.
Nevertheless, considering the bearish divergence, the more probable scenario is a short-term consolidation correction phase followed by another impulsive uptrend toward higher price levels.
On-chain Analysis
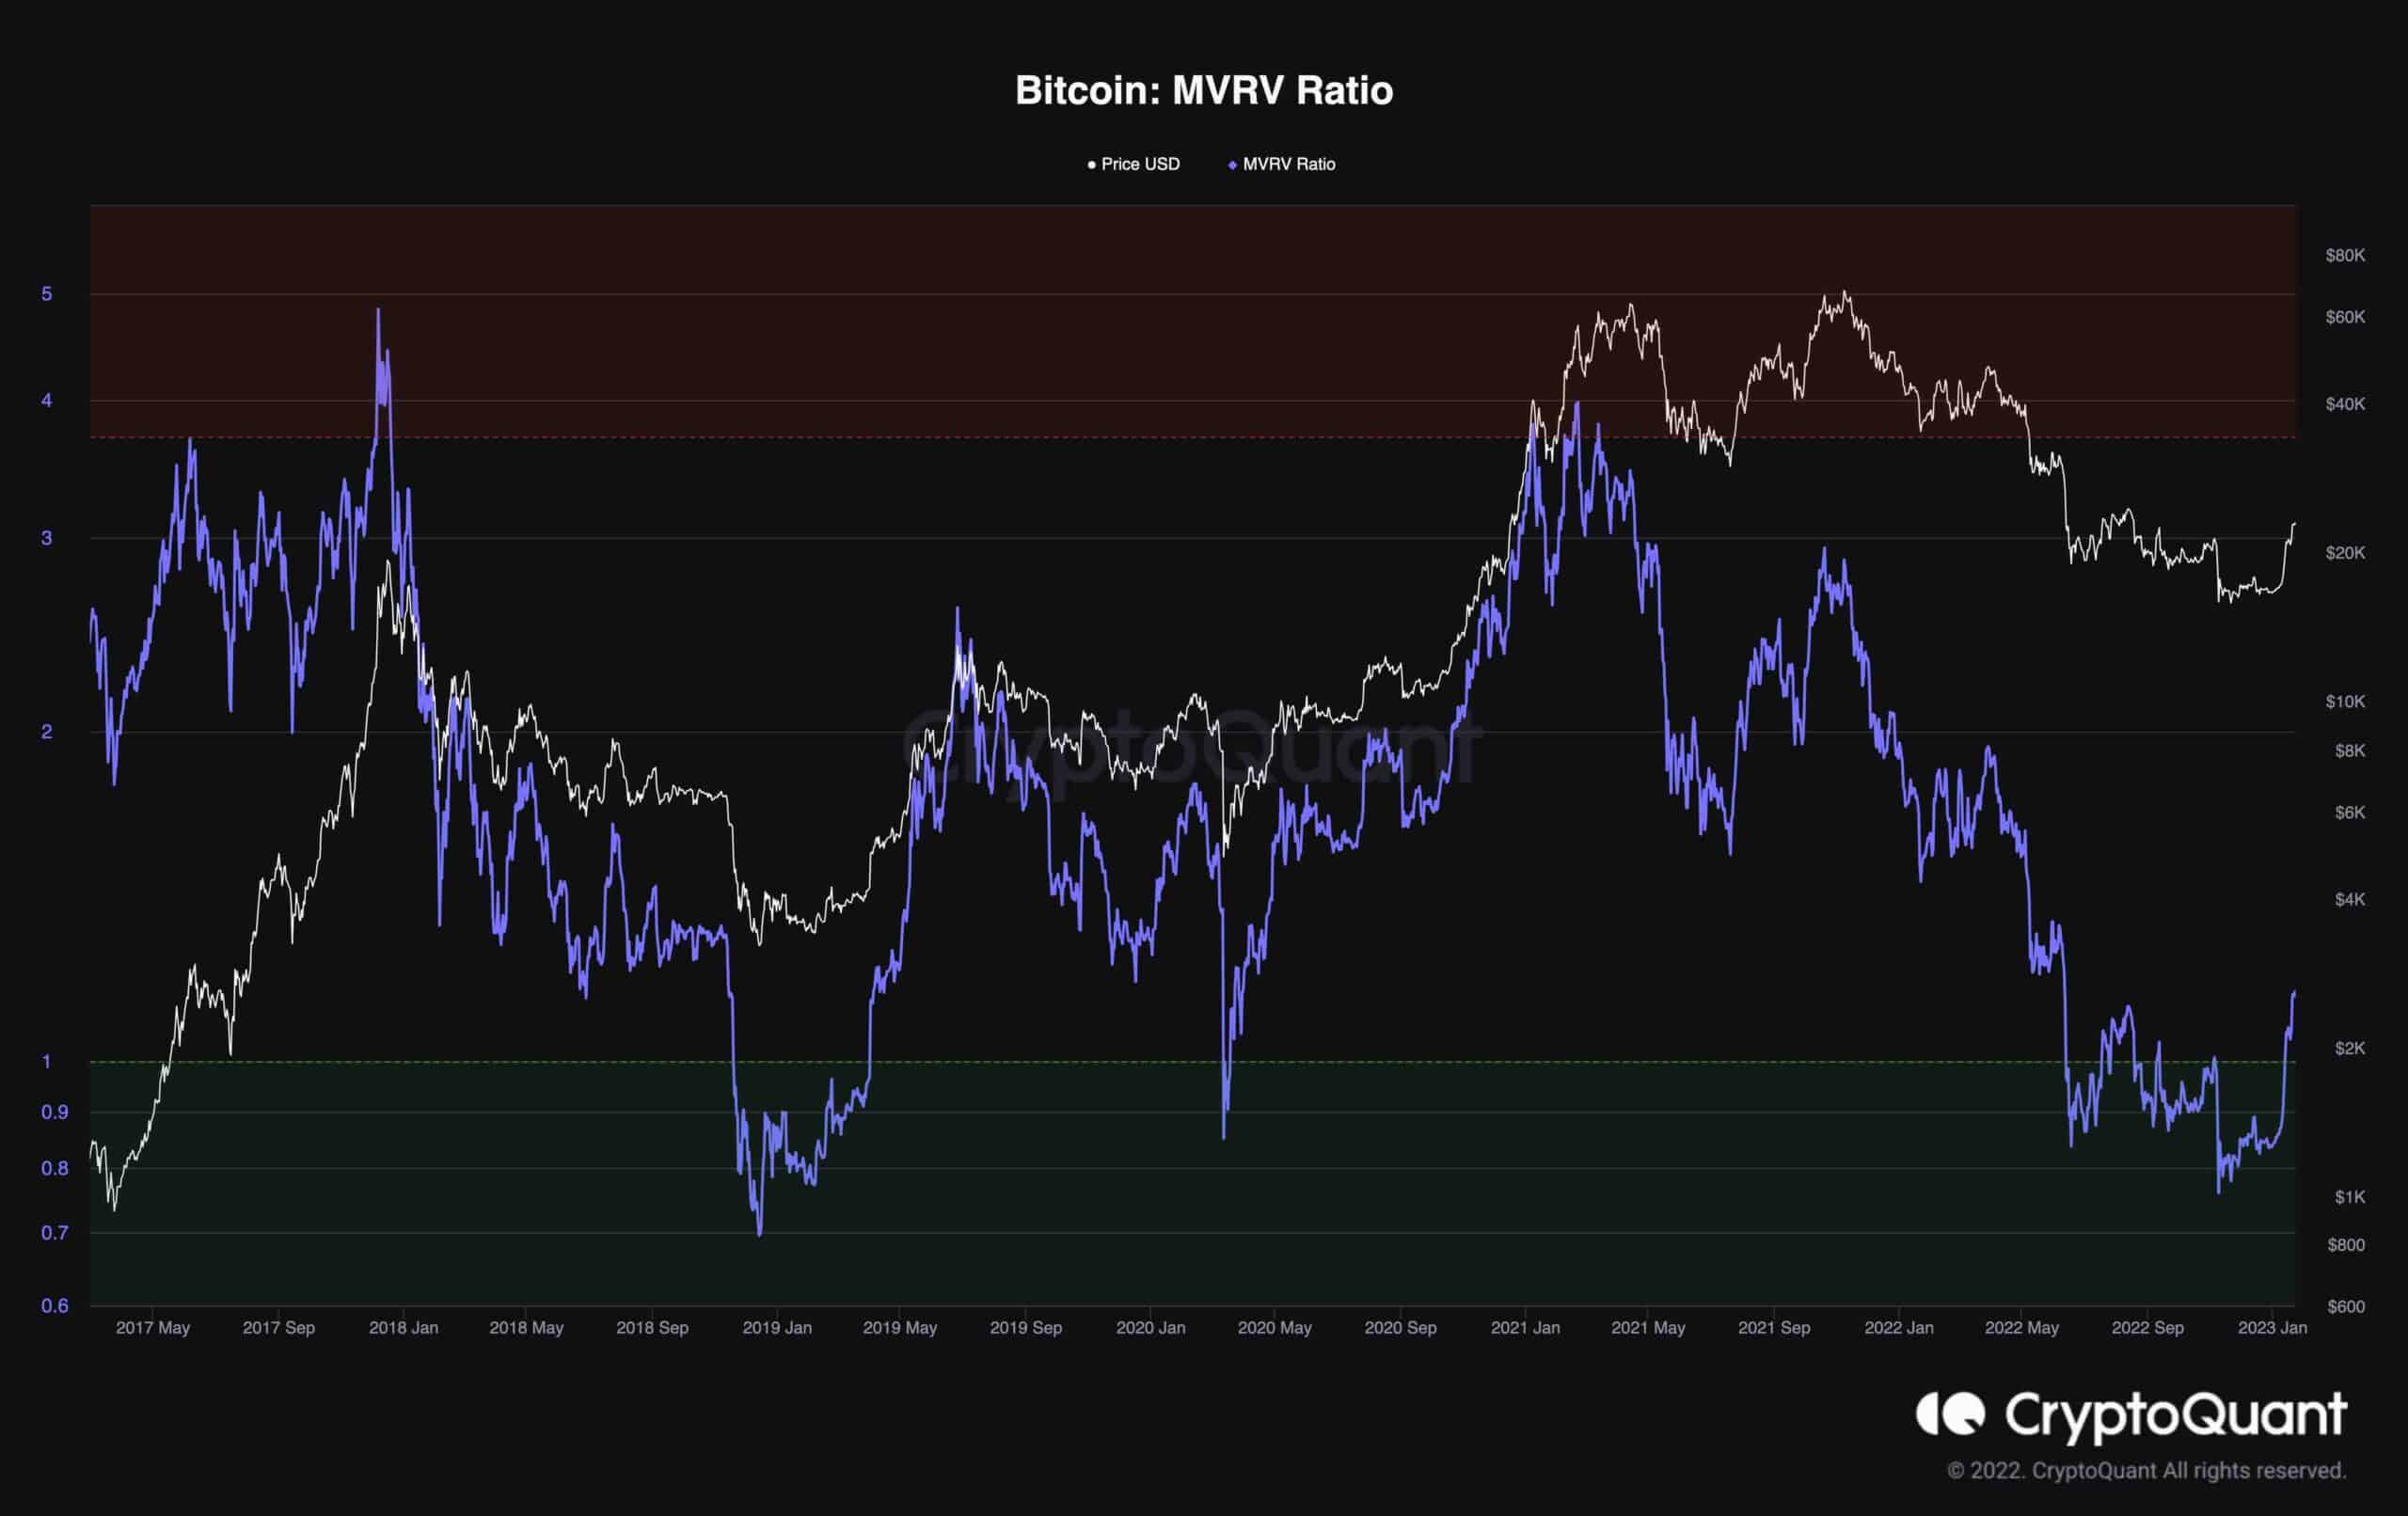
The MVRV metric measures the ratio of coins’ Market Cap to their Realized Cap, indicating whether the price is overvalued. Historically, Values over ‘3.7’ pointed to price tops, while values below ‘1’ marked price bottoms.
The following chart demonstrates the MVRV metric and Bitcoin’s price. During the last stage of the 2018 bear market, the metric dropped below 1 and, after a mid-term consolidation, spiked and surpassed 1. At the same time, Bitcoin found its bottom and started an uptrend marking the 2019 bull market.
The same behavior can be seen in MVRV’s recent move. The metric has lately surged and reached 1.14 due to Bitcoin’s impulsive uptrend. This can be interpreted as a bullish sign that Bitcoin is about to initiate a significant growing trend.