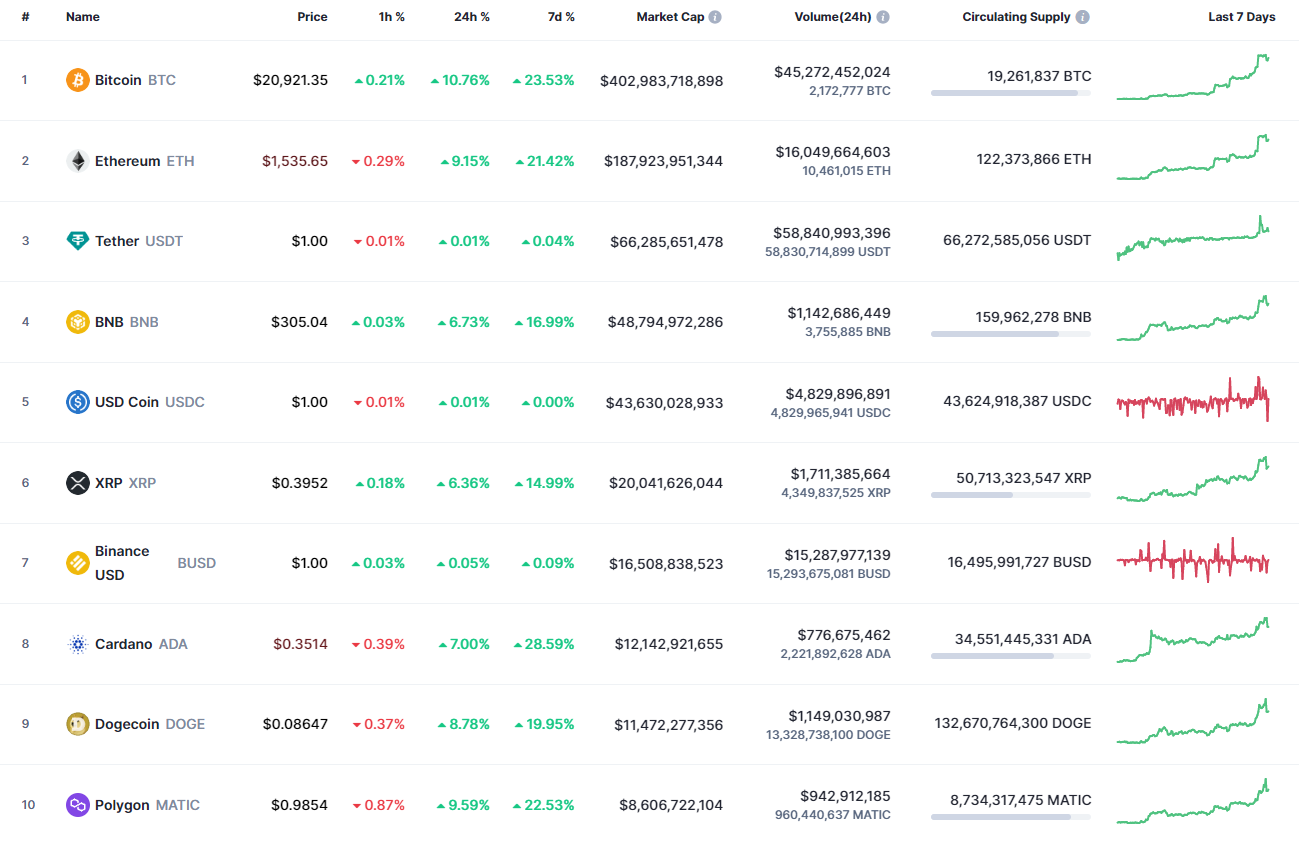
The market keeps booming as the rates of all top 10 coins are rising.
BTC/USD
Bitcoin (BTC) has outperformed all other coins from the top 10 list, rocketing by 10.76%.
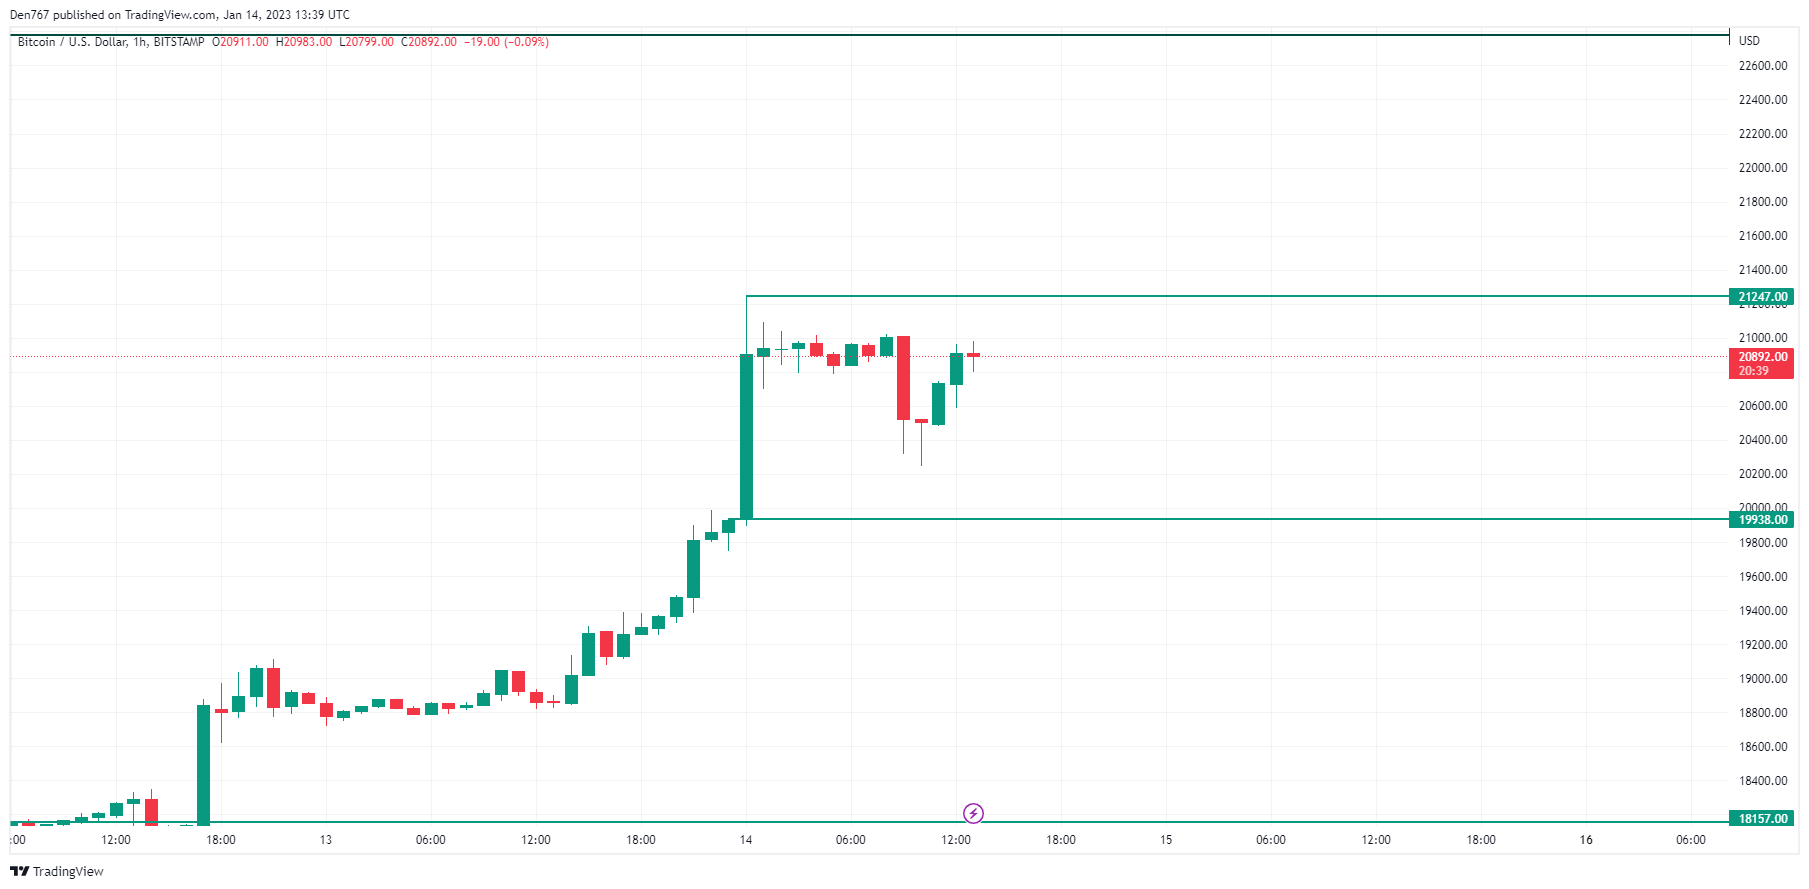
On the local chart, the price is between the recently formed support at $19,938 and the resistance at $21,247. At the moment, the rate is closer to the upper level, which means that closure near it may be a prerequisite for further growth to the $22,000 zone.
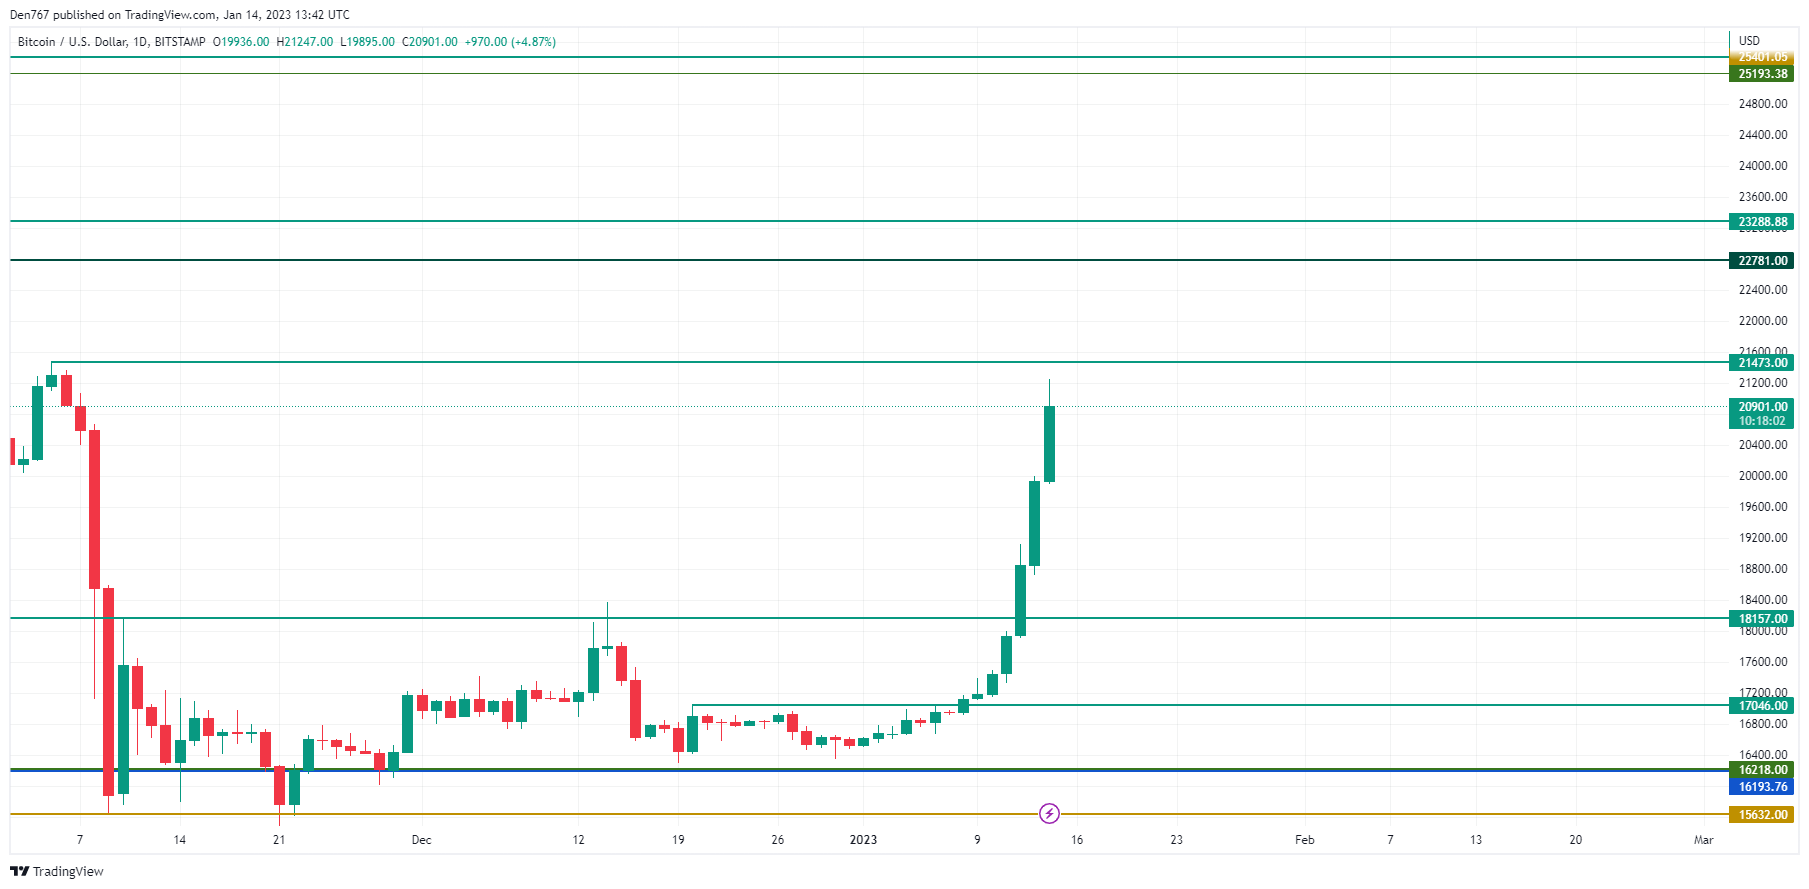
On the daily time frame, the price of Bitcoin (BTC) has almost reached the resistance at $21,473. Currently, traders should pay attention to the way BTC approaches the level. If the speed is high, there is a chance to see a false breakout followed by a correction to the $20,000 area.
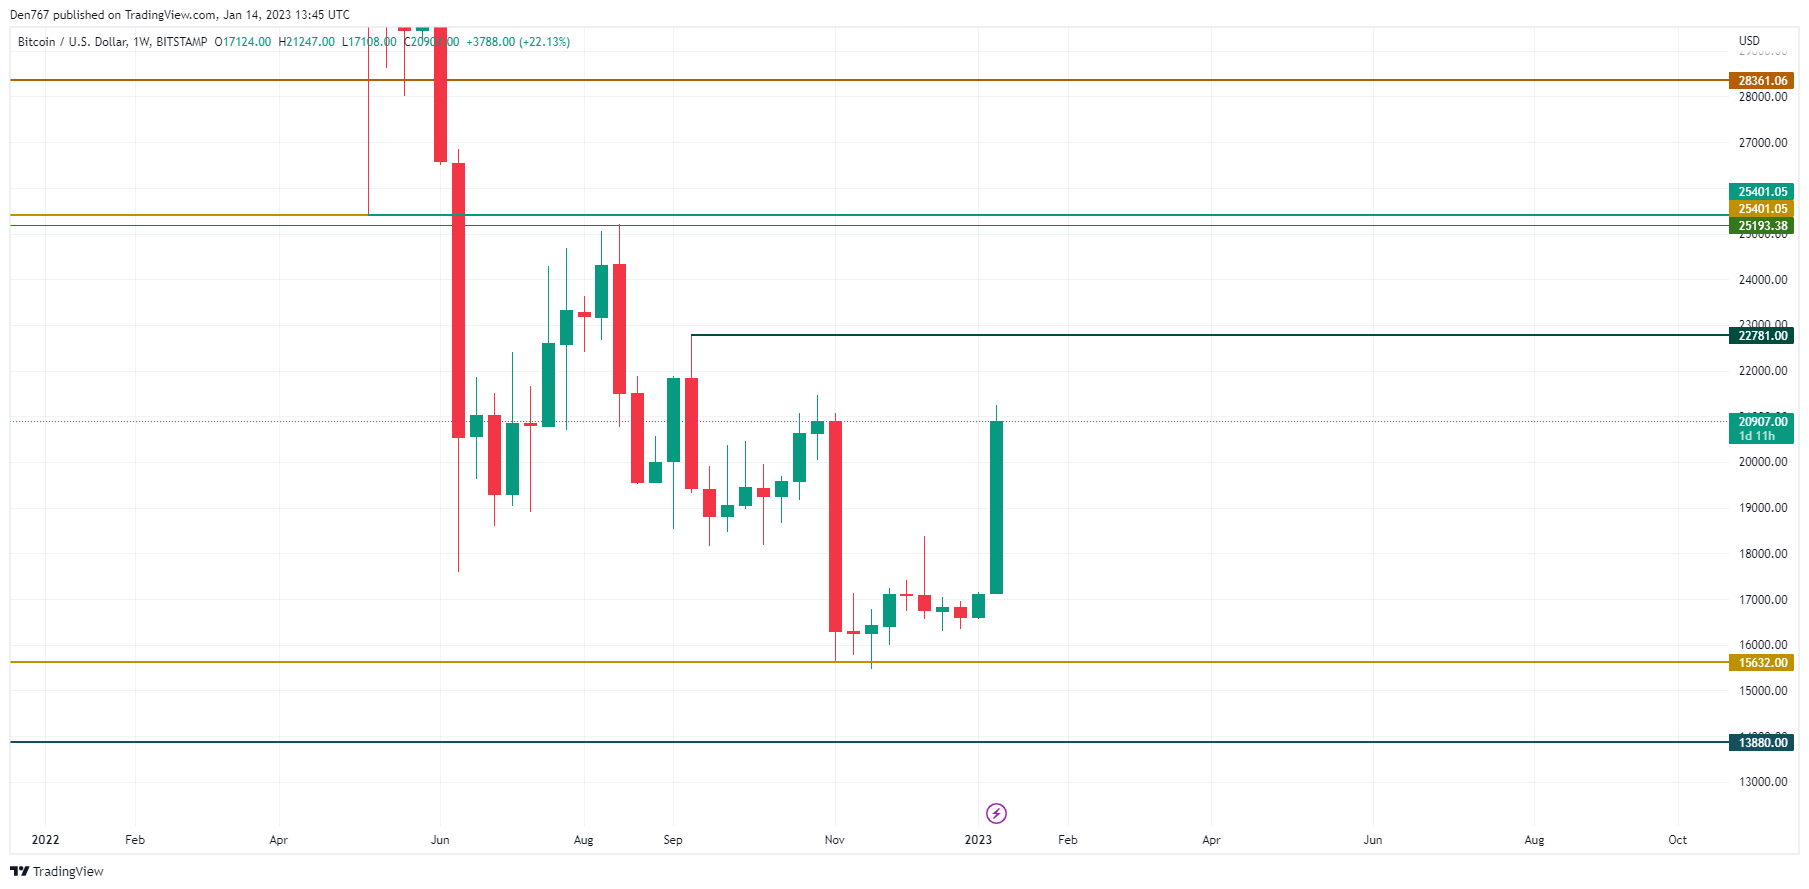
On the bigger chart, Bitcoin (BTC) has started to realize the accumulated energy. If the candle closes with no long wicks, the midterm rise may continue to the $22,781 mark. At that level, one can expect some correction as the main crypto is about to reach the overbought zone.
Bitcoin is trading at $20,900 at press time.