The Bitcoin (BTC) price is trading below a critical confluence of resistances at $18,500. It has to break out above this in order for the Bitcoin price prediction for Jan. and long-term trend to be considered bullish.
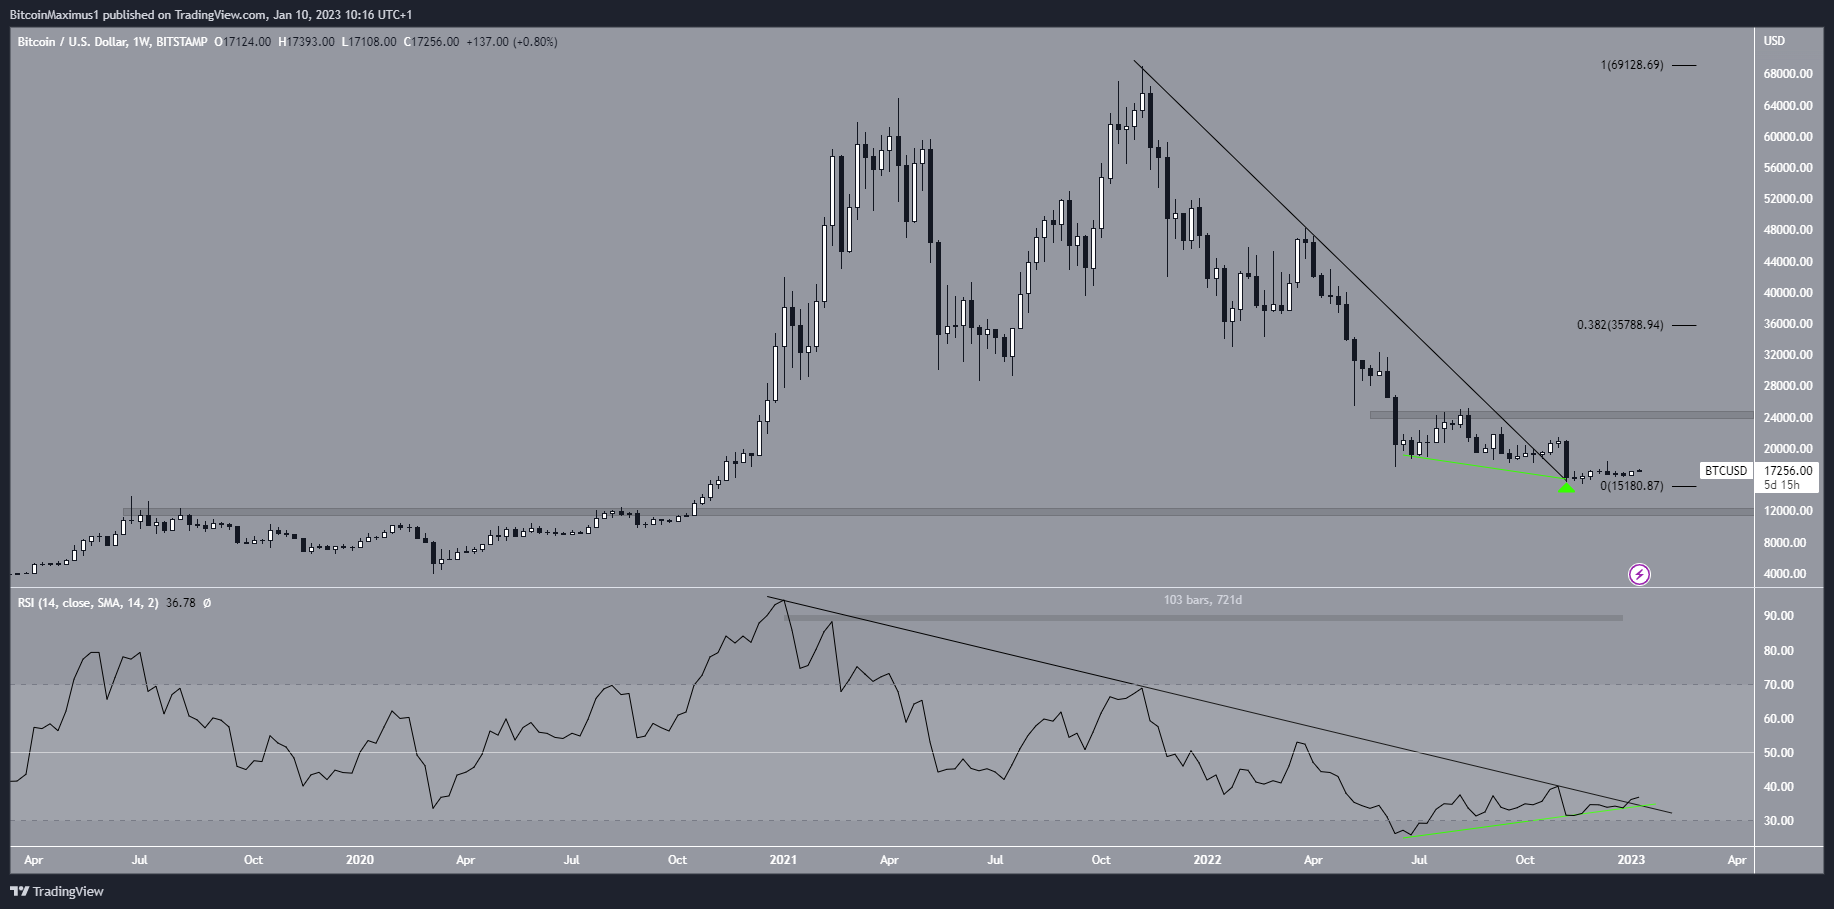
The BTC price has fallen below a descending resistance line since its all-time high price of $69,000 in Nov. 2021. The downward movement led to a low of $15,632 in Nov. 2022.
However, during the decrease, the Bitcoin price broke out from the line in Oct. 2022 and validated it as support the next month (green icon). This price action is standard during breakouts and could lead to the resumption of the upward movement. However, failure to initiate an upward movement could catalyze a decrease toward $11,800.
The technical analysis readings from the weekly RSI support the continuation of the increase. The indicator has generated bullish divergence (green line), whose trend line is still intact.
Moreover, the RSI is in the process of breaking out from its bearish divergence trend line that has been in place for 721 days. Another bullish weekly close would be required in order for the breakout to be confirmed.
As a result, the weekly time frame price action and technical indicator readings support the beginning of an upward movement. If one occurs, the closest resistance area would be at an average price of $24,500, while the nearest Fib resistance would be at $35,800.
On the other hand, a decrease below the Nov. 22 low of $15,632 would invalidate this bullish BTC price analysis and likely lead to a drop toward $11,000.
Bitcoin Price Prediction for Jan: Breakout Above $18,500 Is Critical
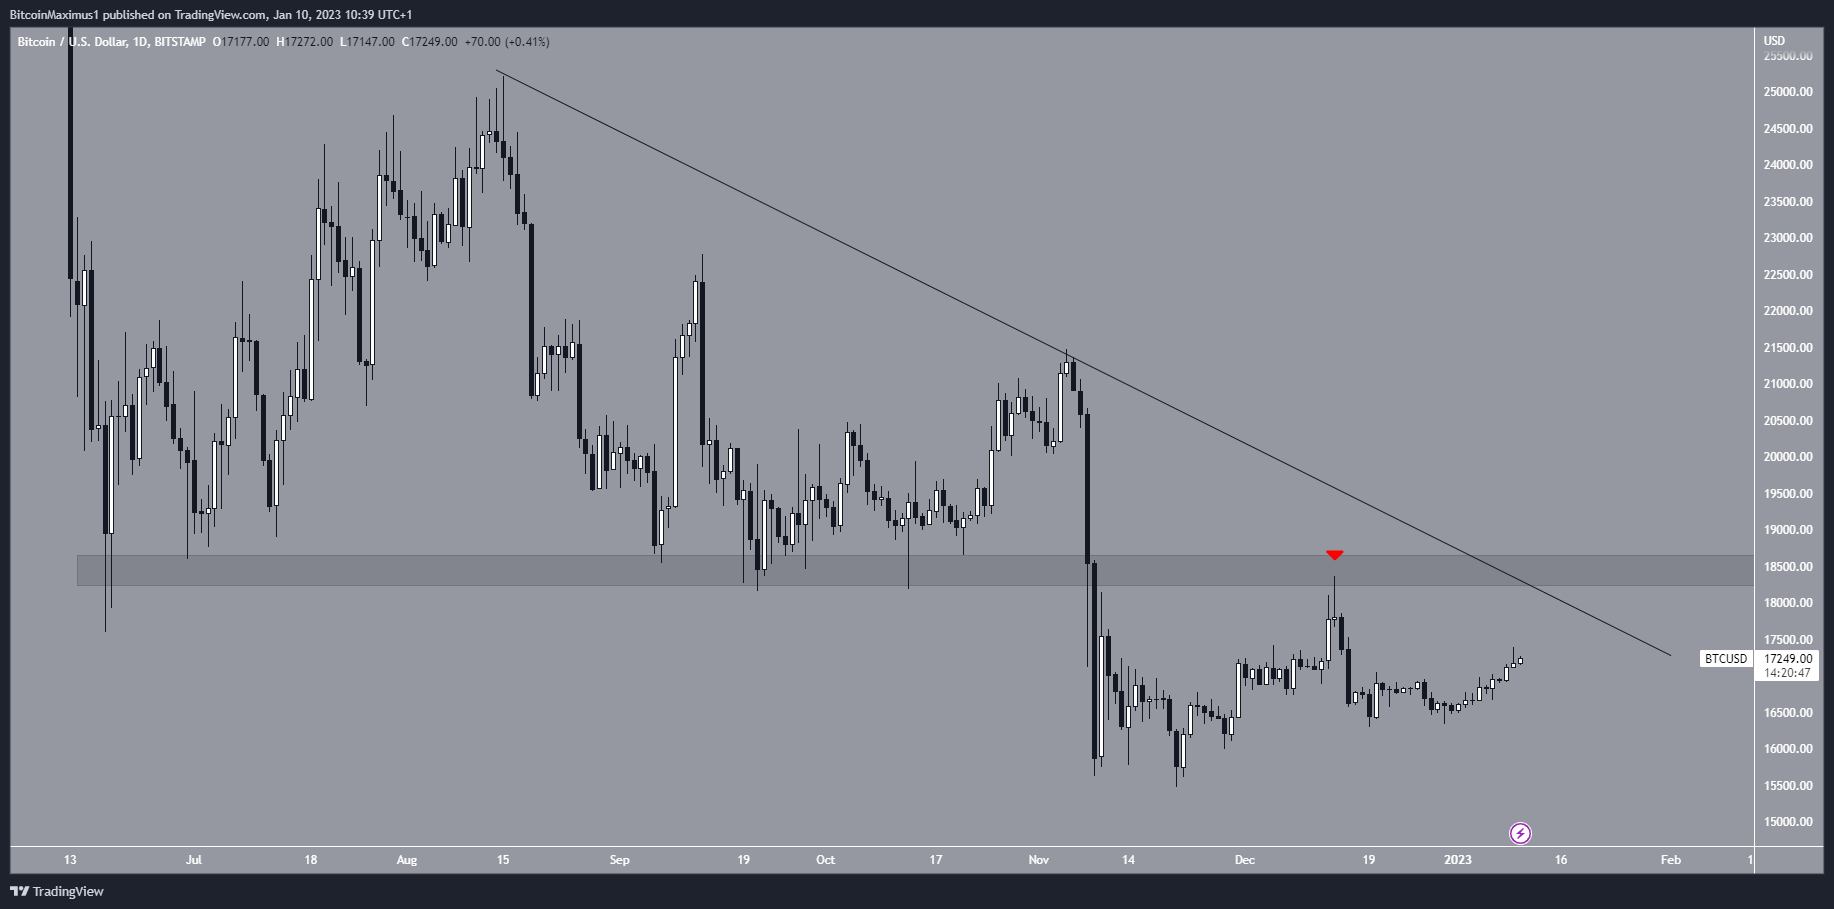
While the readings from the long-term weekly time frame are bullish, the ones from the daily time frame are less decisive. The main reason for this is that the BTC price is trading below the $18,500 resistance area.
The area acted as support between June – Nov. 2022 and then turned to resistance in Dec. (red icon). The trend is considered bearish until the price breaks out above this area. The fact that the area could coincide with a descending resistance line further increases its importance.
As a result, BTC has to break out above this confluence of resistance levels for price action to be considered bullish.
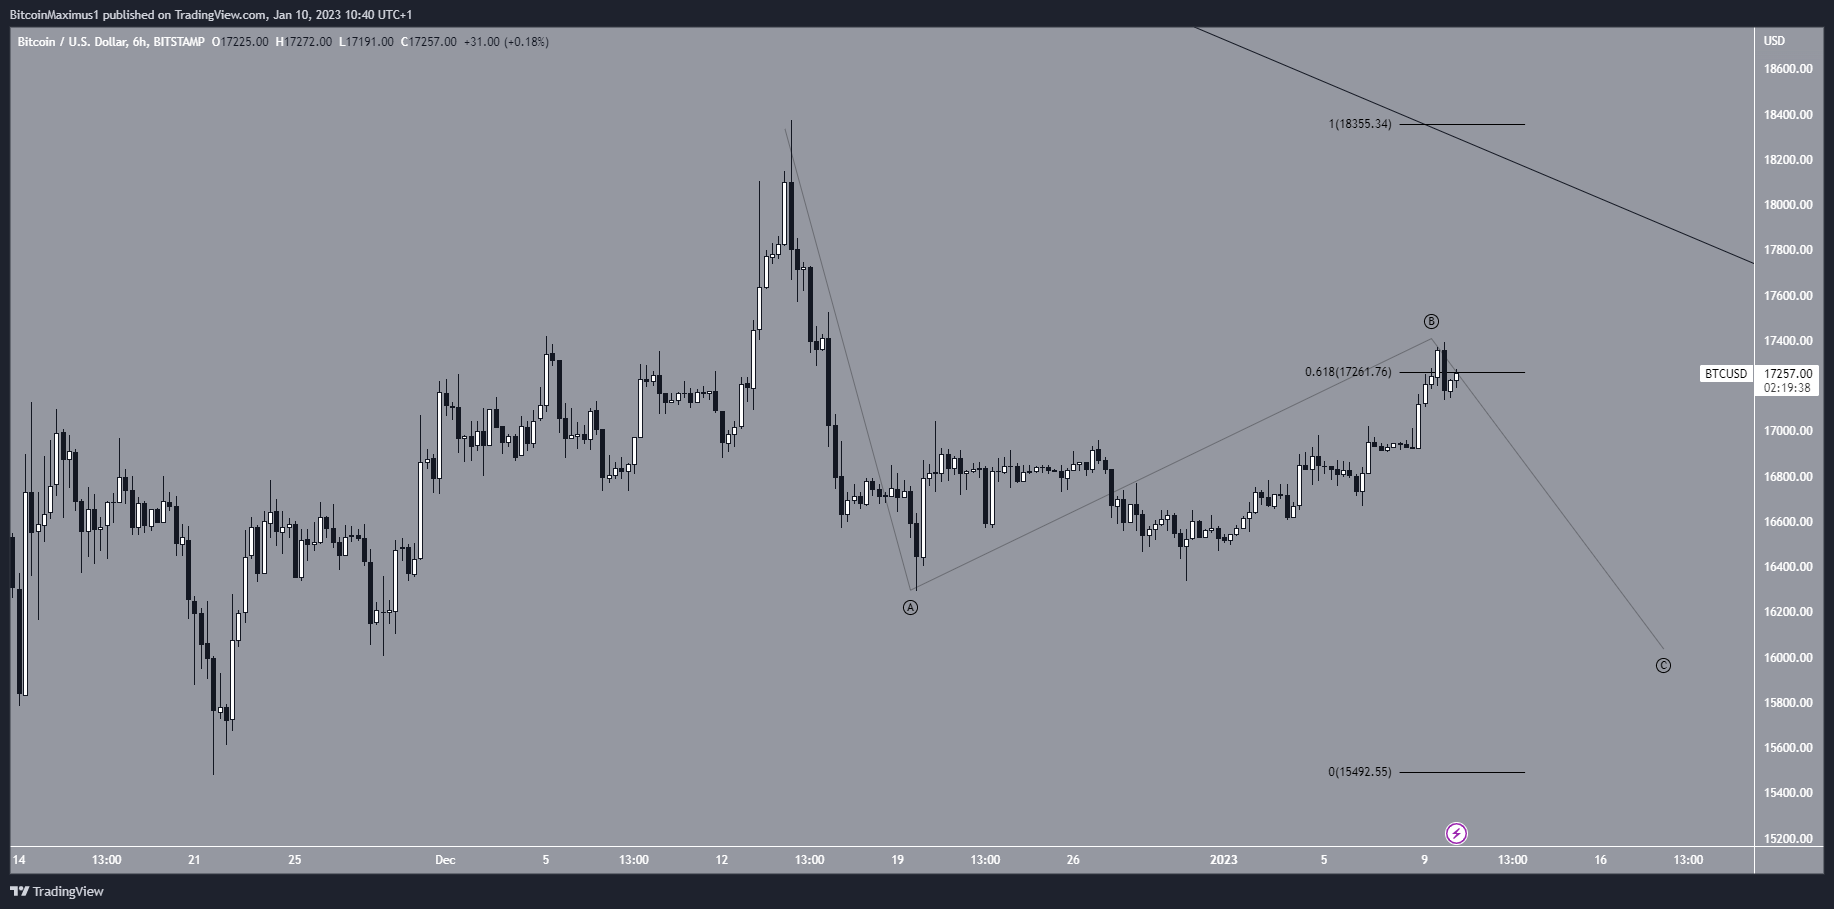
However, the short-term six-hour chart indicates that an initial drop is expected before the BTC price eventually moves higher. The main reason for this is that the downward movement of Dec. 14 looks impulsive. Hence, it is possibly the A wave of an A-B-C corrective structure.
Currently, the BTC price is at the 0.618 Fib retracement resistance at $17,260. If rejected from this level, it could fall and complete the C wave.
On the other hand, a decisive move above this level would indicate that the correction is complete and that a breakout is expected.
To conclude, the weekly time frame readings for Bitcoin are bullish, the daily one’s undecided while the short-term ones are bearish. As it stands, the most likely BTC price forecast is the beginning of a long-term relief rally. Falling below the 2022 low of $15,380 would invalidate this bullish hypothesis.
For BeInCrypto’s latest crypto market analysis, click here.