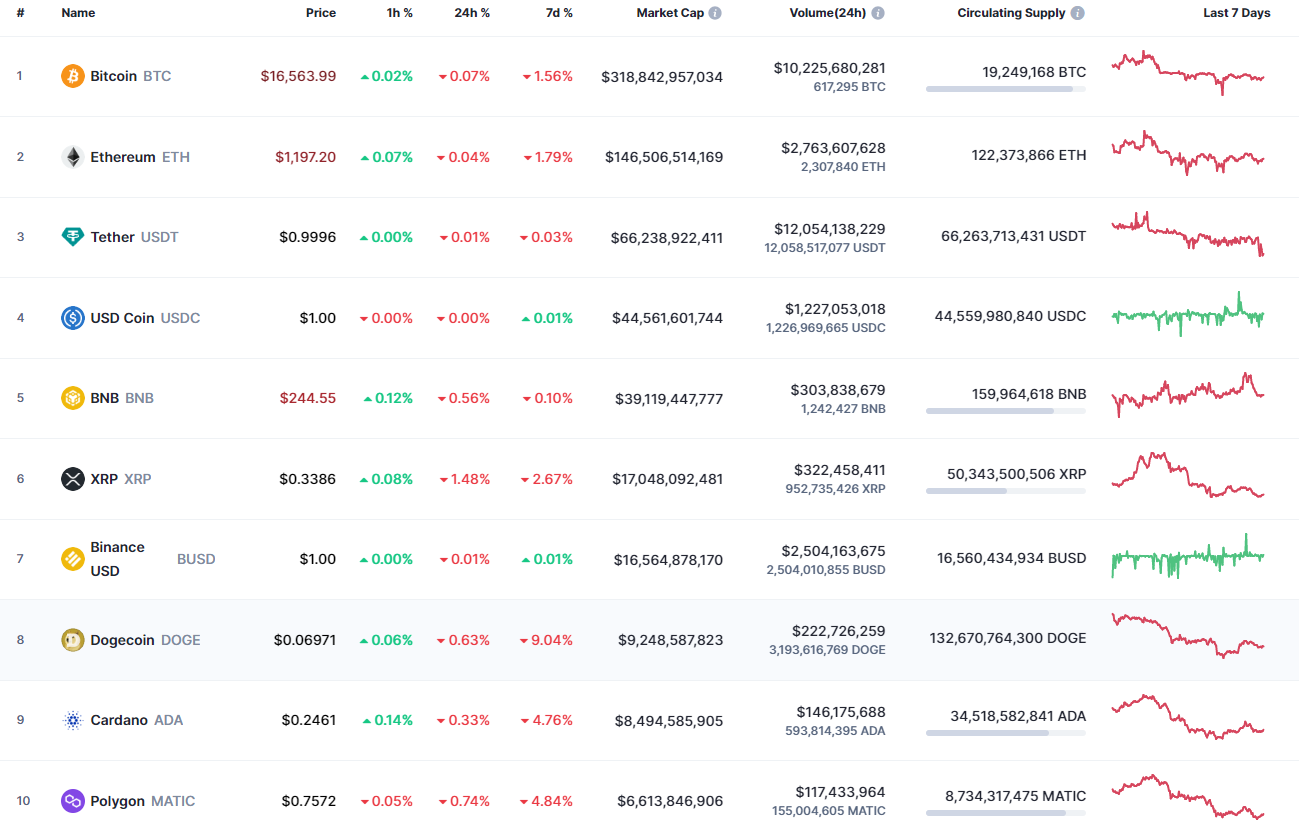
Bulls failed to keep the prices rising on the first day of 2023 as most of the top 10 coins are in the red zone.
BTC/USD
The rate of Bitcoin (BTC) has almost not changed since yesterday.
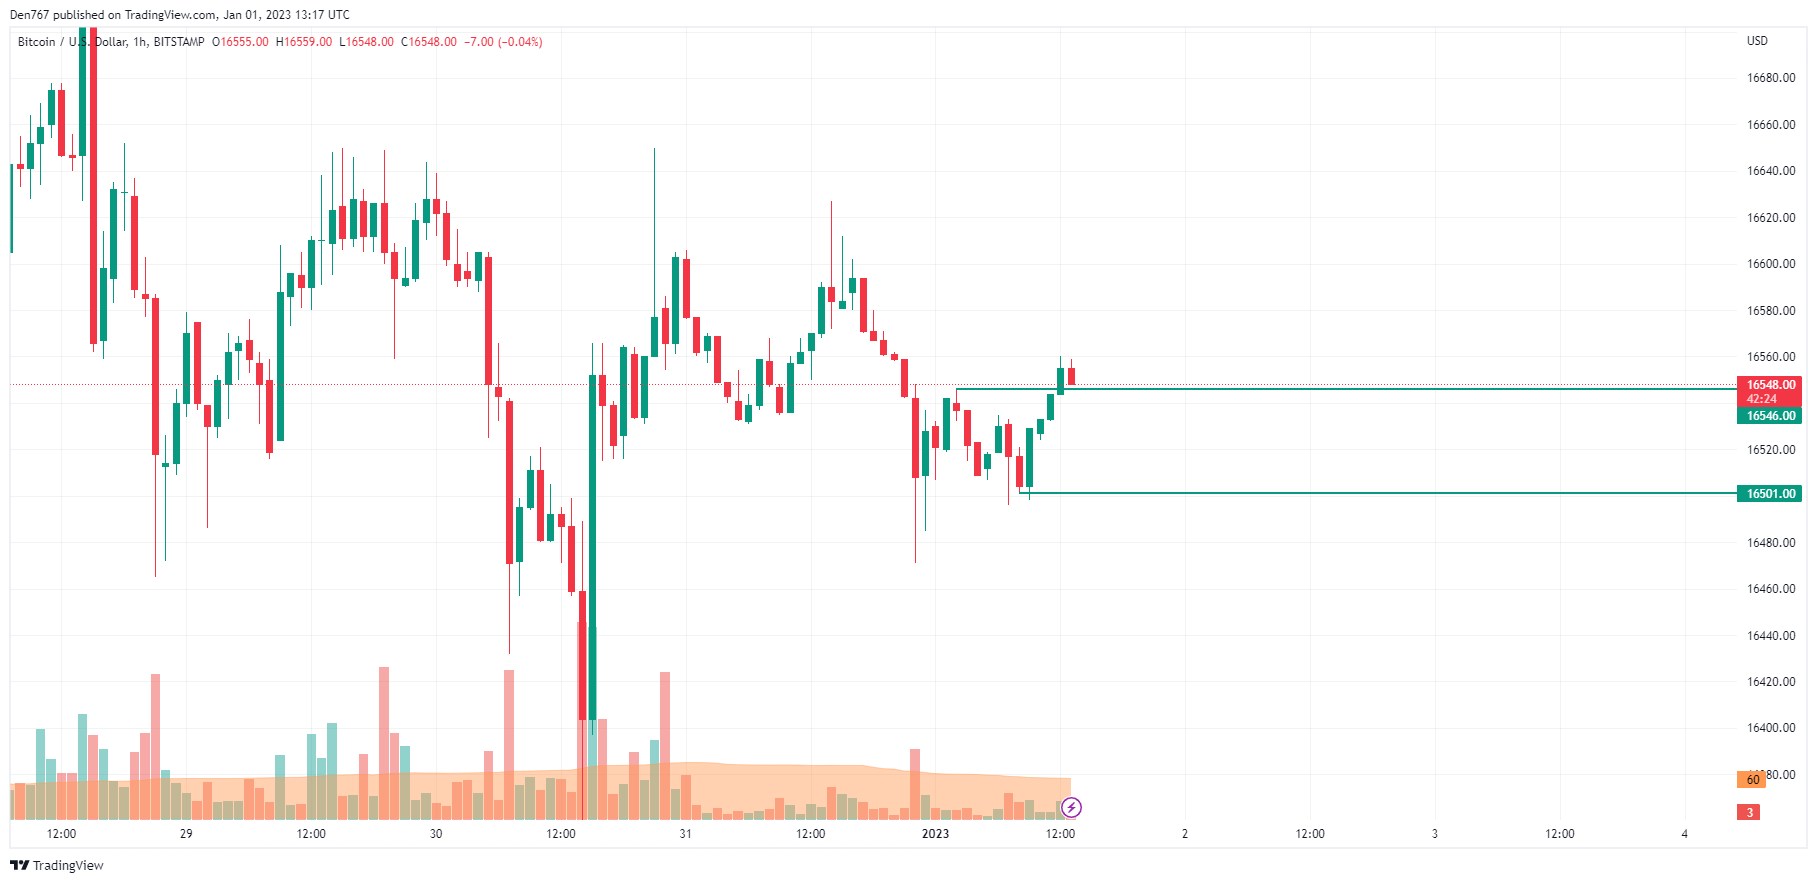
On the hourly chart, one should point out the local support level at $16,501. At the moment, the price is trying to fix above the resistance at $16,546.
If buyers can hold the gained initiative, the growth may continue to the $16,600 zone tomorrow.
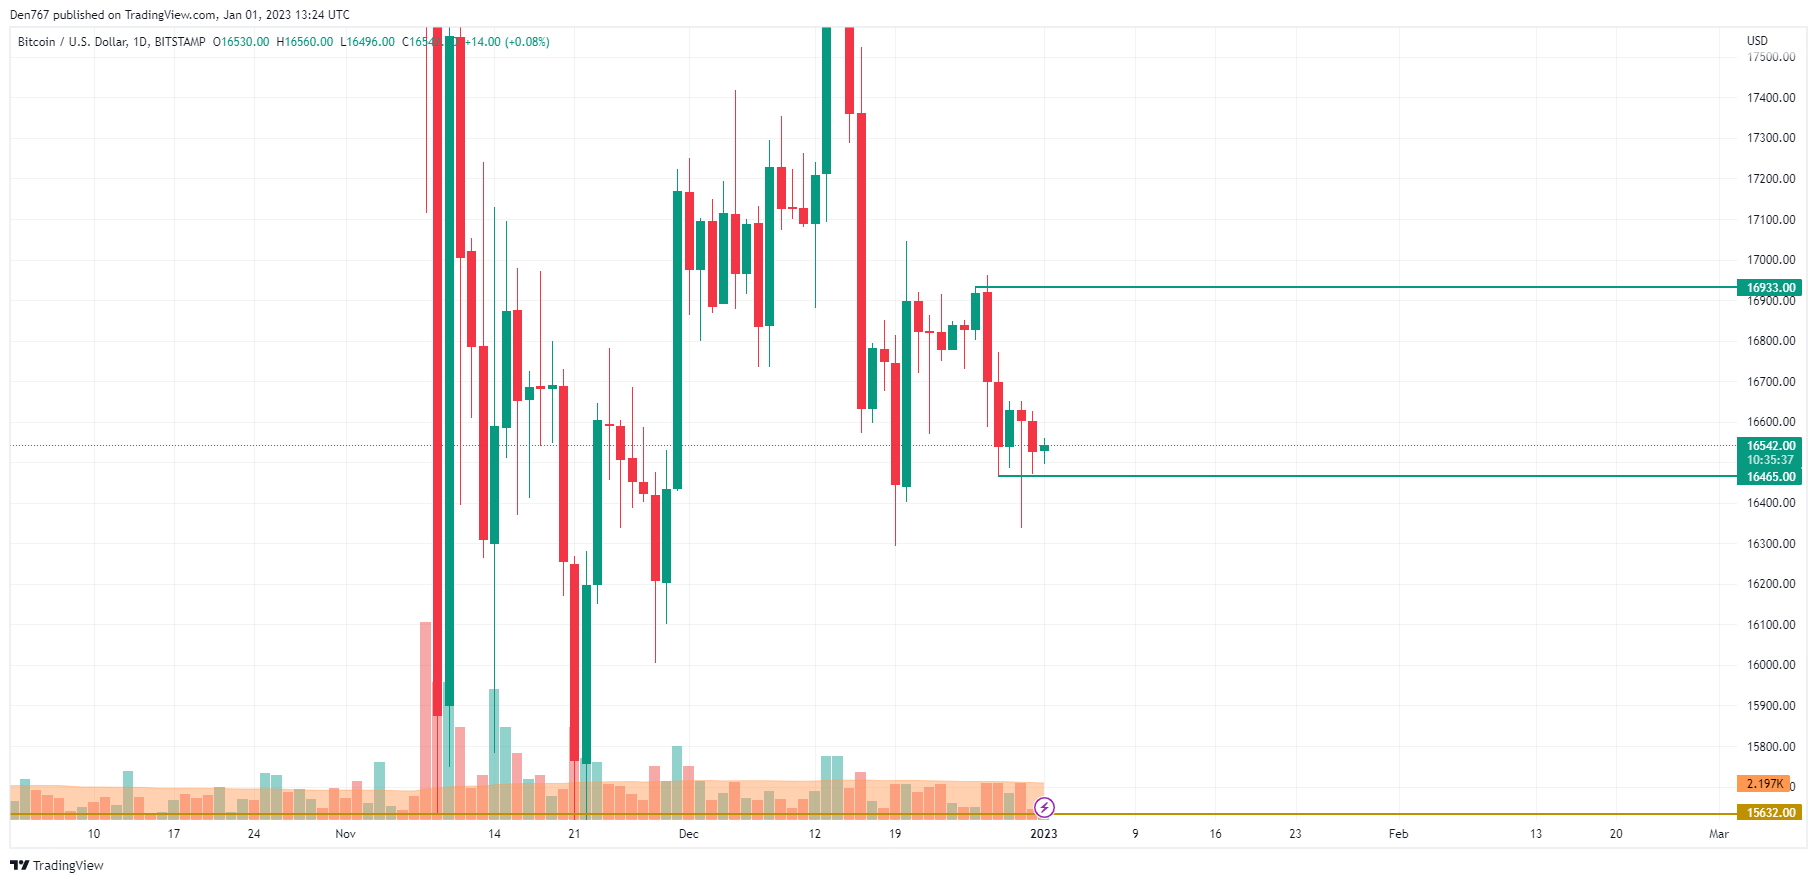
On the bigger time frame, the situation is less positive as the price remains near the support level of $16,465. If growth does not happen soon, the next approach to the aforementioned mark may be a prerequisite for a breakout. In this case, there is a high possibility to see a test of the $16,200 area.

On the weekly time frame, the candle is about to close bearish. The price is far away from the key levels, however. Currently, the important zone is $16,000, a breakout of which may lead to a test of the support at $15,632.
Bitcoin is trading at $16,543 at press time.