The much talked about 30% correction in Bitcoin price was hit pretty much spot on during yesterday’s US trading session. Many are now questioning whether they missed the dip and whether the bull run has resumed as BTC trades back above $11000 again today.
Bitcoin Price Drops Exactly 30%
Over the past 24 hours, Bitcoin price is back up again adding 9% on the day. Analysis of previous market cycles has shown that following an almost parabolic surge, BTC pulled back ~30% eight times in the past uptrend. A correction of similar magnitude has been expected this time and the target was hit a few hours ago.
From its recent high of $13,800, a 30% dip would send Bitcoin price back to $9,600. According to Tradingview.com BTC dipped to $9,620 marking a pullback of 30.3%, right on the money.
BTC price 1-hour candles. Tradingview.com
Back Above $11000
Since the short-lived dump, BTC price surged back above $11000 over the next few hours to settle at around 00 where it currently trades.
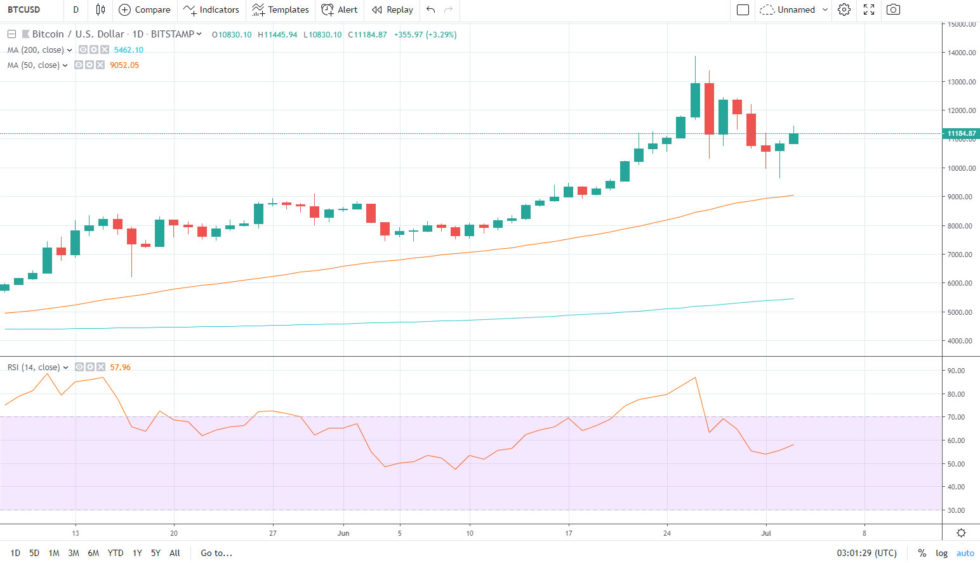
Trader and analyst ‘CryptoFibonacci’ noticed that the bounce touched the 200 EMA on the four-hour chart before returning to the 50 EMA where it may find resistance again.
“So, we did lose 10,900 and did fill one of the gaps. But, it did hold the 200 ema on this chart. A move back over the 50 ema here would do wonders for bulls. A rejection of it could lead it back down to fill that last gap.”
$BTC 4 hour chart.
So, we did lose 10,900 and did fill one of the gaps. But, it did hold the 200 ema on this chart. A move back over the 50 ema here would do wonders for bulls. A rejection of it could lead it back down to fill that last gap.#BTC pic.twitter.com/uYpJNPmZ2h
— CryptoFibonacci (@CryptoFib) July 2, 2019
Fellow analyst, Josh Rager has looked at the bigger picture on the current weekly chart noting that the formation of a second doji indicates further indecision, a possible precursor to range-bound trading.
“The current $BTC weekly chart is quite hilarious with those wicks. Trends is still bullish even though we could go sideways here and range between a couple thousand dollars in the coming weeks.”
The current $BTC weekly chart is quite hilarious with those wicks
Trends is still bullish even though we could go sideways here and range between a couple thousand dollars in the coming weeks pic.twitter.com/8NDBsgsgqk
— Josh Rager 📈 (@Josh_Rager) July 2, 2019
Bitcoin Price Could Fall Back Again?
The trading week is far from over yet and BTC could fall further back, but considering its epic recovery from the mid $9,000s over the past few hours this does not seem to be likely at the moment.
With two $500+ hourly candles overnight the bulls appear to be back in force so the next few hours will be critical for Bitcoin price. The big green hammer on the daily chart is also a strong sign that the short-lived downtrend has just reversed.
Many will be waking in Asia and Europe today wondering if they had missed the dip.