Our last analysis two days ago was titled ‘The calm before the storm.’ Bitcoin was trading around the $12K mark at the time. As of this article’s writing, everyone knows about the storm currently battering the Bitcoin price, as the coin is again trading at under $10,000.
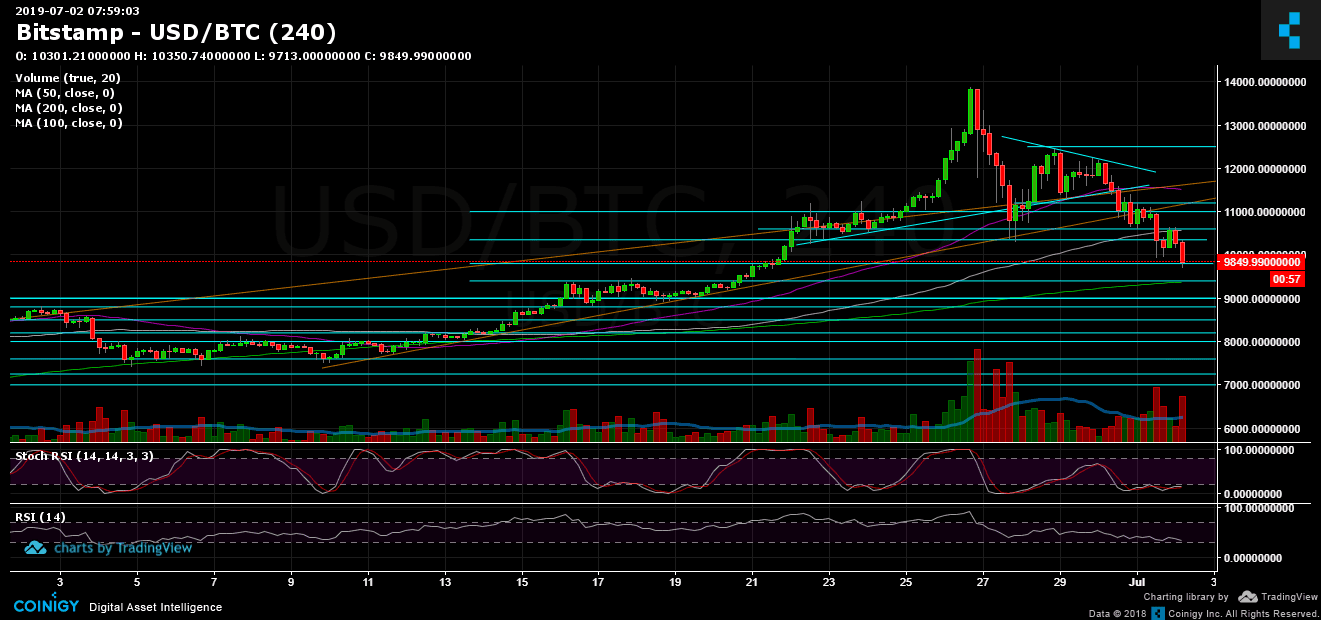
We previously mentioned a triangle pattern along with the strong ascending trend line support (as can be seen on the 4-hour chart). Since breaking bearish at $11,500, the king of the cryptocurrencies has taken an almost $2,000 hit to its value.
Things happen quickly. As has been said here before, violent bullish moves precede violent moves to the bearish side. From $7,500 to $13,880 (the current 2019 high), Bitcoin didn’t undergo any significant correction. This bloody move is the result.
Total Market Cap: $291.6 billion (Back under $300B)
Bitcoin Market Cap: $175.4 billion
BTC Dominance Index: 60.1% (Support here?)
*Data by CoinGecko
Now What?
Support/Resistance: Bitcoin broke below almost all support levels mentioned on our previous price analysis. Bitcoin is now facing its next support level, around $9,800. This level as well as the next one – the double top from mid-June at $9,400 – are significant. In my opinion, $9,400 would still be considered a healthy correction to the recent parabolic move (up to almost $14K).
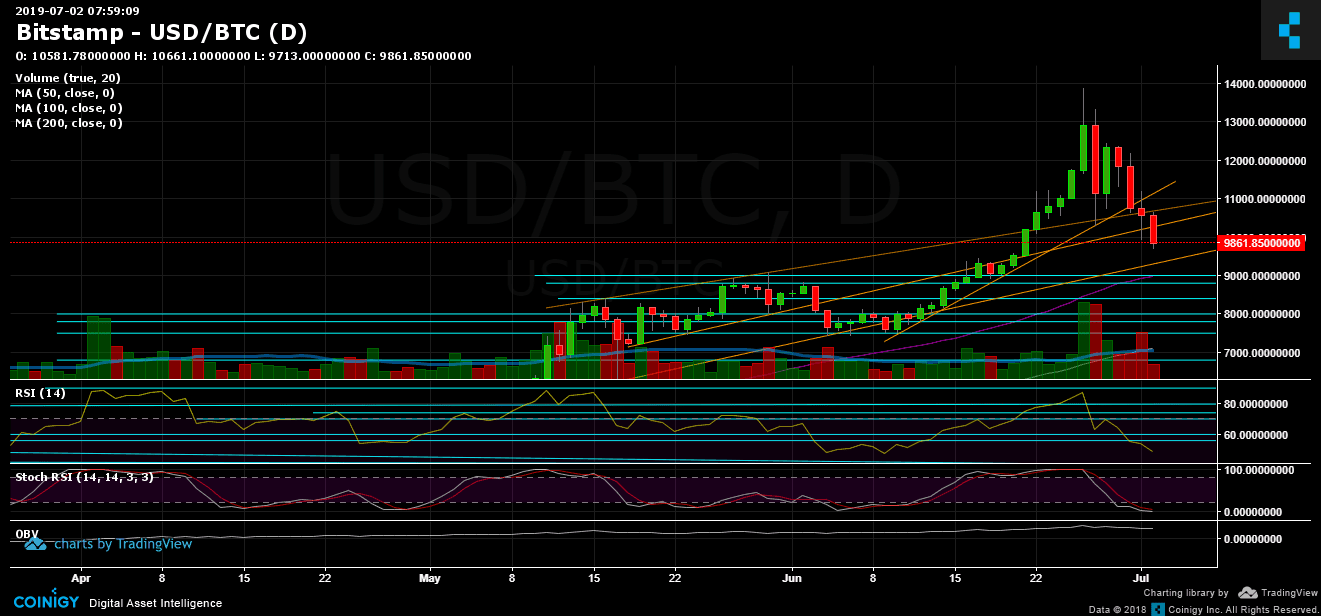
Further below lies the $8,800 – $9,000 zone which contains the critical 50-day moving average line (marked in purple on the daily chart). More support is located at $8,500, $8,200, $7,800, and $7,500.
On the bullish side, the next resistance level is $10,000. Above lie $10,300 and $10,600 (the recent high shown on the 4-hour chart). Further up are the $11,000, $11,200, and $11,500 levels.
Daily chart’s RSI: How quickly things change. The RSI reached its highest level at nearly 90 just a week ago. As of now, the important momentum indicator is about to enter bearish territory below 50. However, the Stochastic RSI Oscillator is in the oversold area, and in the case of a bullish crossover, a correction may be imminent.
Trading Volume: Yesterday’s volume was quite high. This was selling volume, which is unfortunate for Bitcoin bulls.
Bitfinex open short positions: We saw this once in May, and now again. On the day following an odd drop in the amount of short positions, Bitcoin’s price dropped significantly. This is exactly what we wrote here yesterday.
The current amount of short positions is 10.8K BTC, which is near the yearly low.
BTC/USD BitStamp 4-Hour Chart

BTC/USD BitStamp 1-Day Chart

 cryptopotato.com