Bitcoin has been recording massive dips ever since Bitcoin hit its year-to-date highs on June 26. It has been a downward spiral for Bitcoin since, slumping by a massive 30% in only 6 days.
Joe McCann, trader and Founder of Node Source, tweeted his thoughts on Bitcoin’s recent slump below the $10,000-level. He tweeted,
2/ After a punch through $10,000, bitcoin rose another 38.67% in just 4 days after the $10,000 breach. However, the price hit strong resistance at $13,900; $13,863.13 is the highest monthly close on record (December 2017). pic.twitter.com/MXi6mX2fvG
— Joe McCann (@joemccann) July 1, 2019
Price and Moving Average
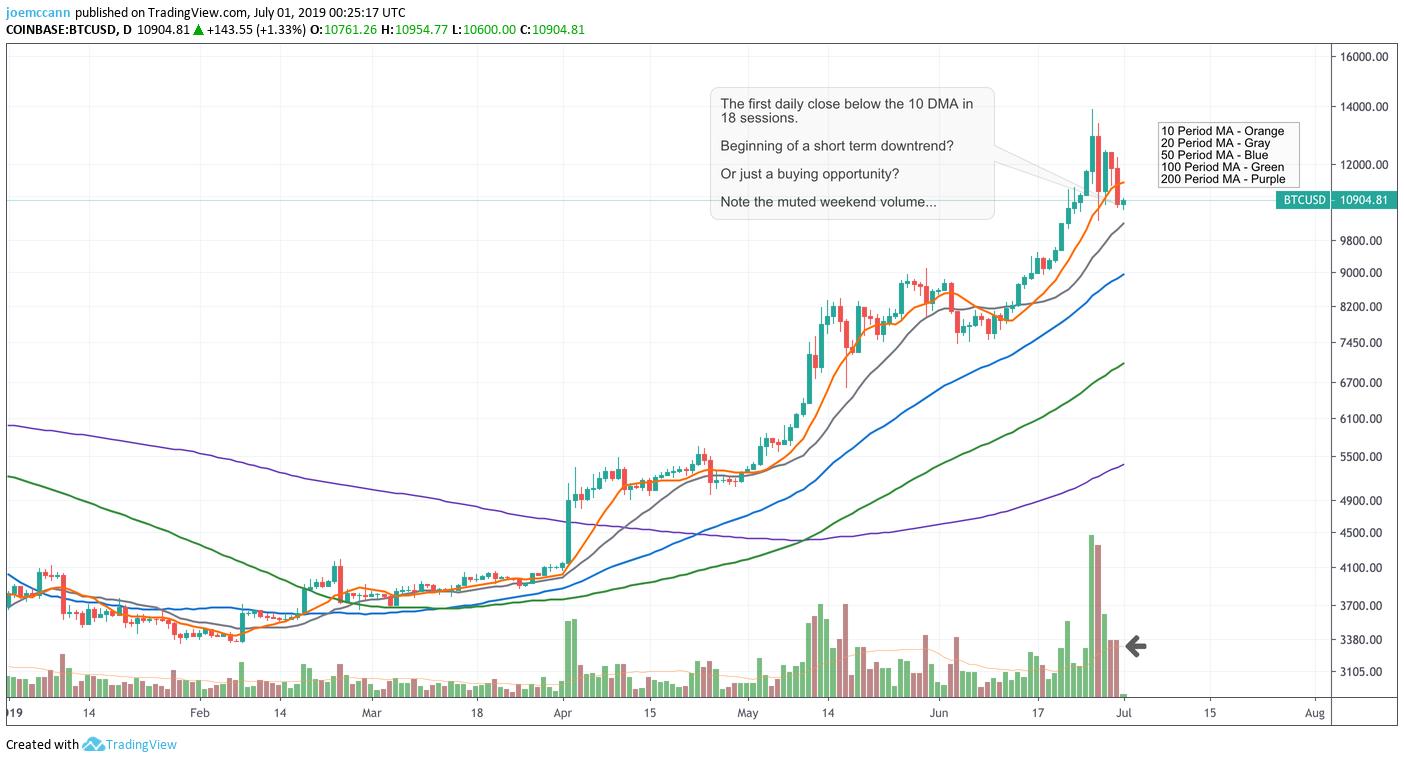
Source: Twitter | Joe McCann
As seen in the chart, the price of Bitcoin has dipped below the 10-day moving average after staying above it for 17 sessions straight. Due to the latter, McCann stated that “we must remain defensive on the long side and opportunistic on the short side.”
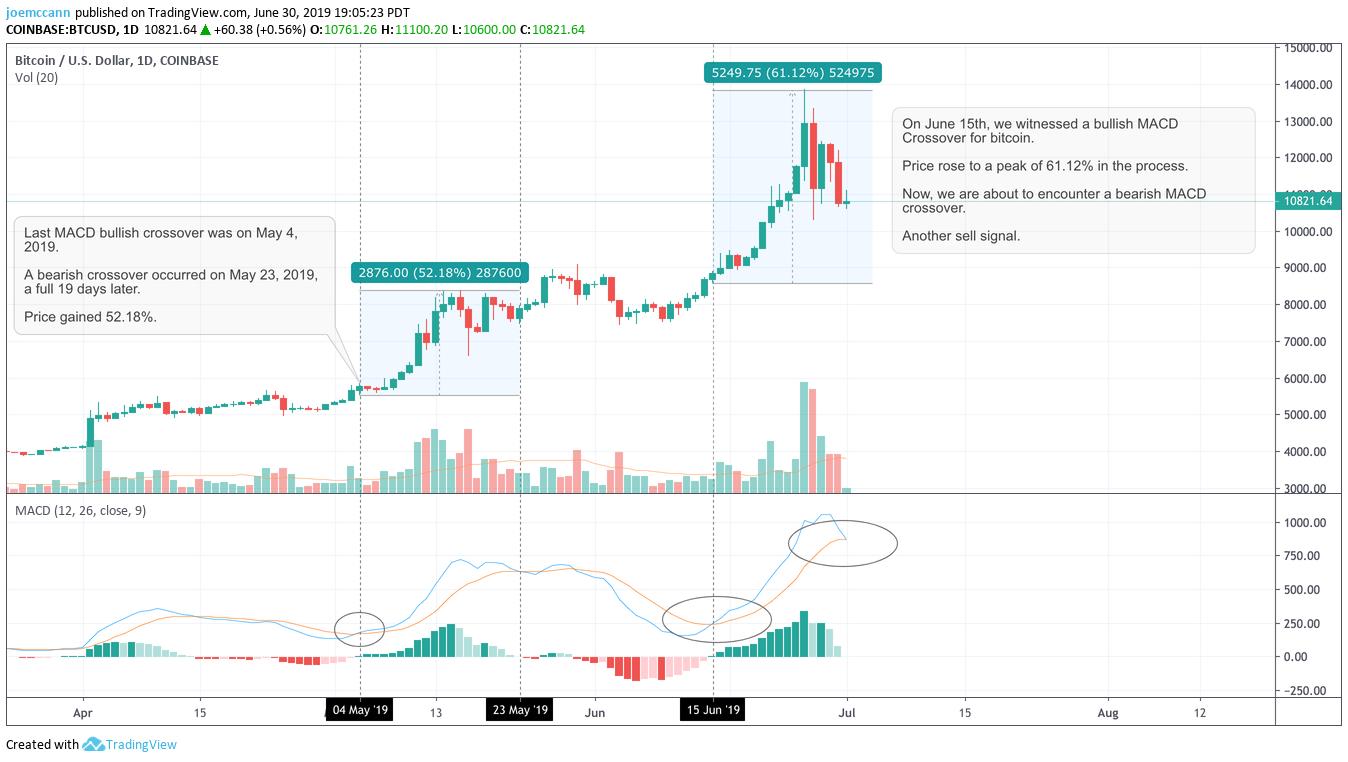
Momentum Indicators

Source: Twitter | Joe McCann
He added,
“As we look at the momentum indicators, we peeked outside the upper Bollinger Band on June 26th when we hit YTD highs and have since been selling off. This should be expected as anything greater than the upper BB is more than 2 standard deviations from the 20 DMA.”
Additionally, the RSI indicator also seems to be collapsing, following the same trend as the Stochastic and the Williams %R indicator, which is reaching the oversold zone, further adding to the bearish momentum of Bitcoin.
Source: Twitter | Joe McCann
Finally, the MACD indicator seen in the chart above indicates a bearish crossover. Joe McCann tweeted,
“On June 15th, we witnessed a bullish MACD Crossover for #bitcoin. Price rose to a peak of 61.12% in the process. Now, we are about to encounter a bearish MACD crossover. Another sell signal.”
Over a weekly time frame, the price of Bitcoin has formed a gravestone Doji candle, which is massively bearish and indicates a sell signal. The weekly candle after the Doji candle is a massive red candle and closes another day.