Bitcoin (BTC) Price Analysis – July 1
The past few days of trading has subjected the Bitcoin market to experience a bearish scenario due to the significant price drop in the market. The cryptocurrency is now moving closer to $9000 after confirming a break-down at the $10,500.
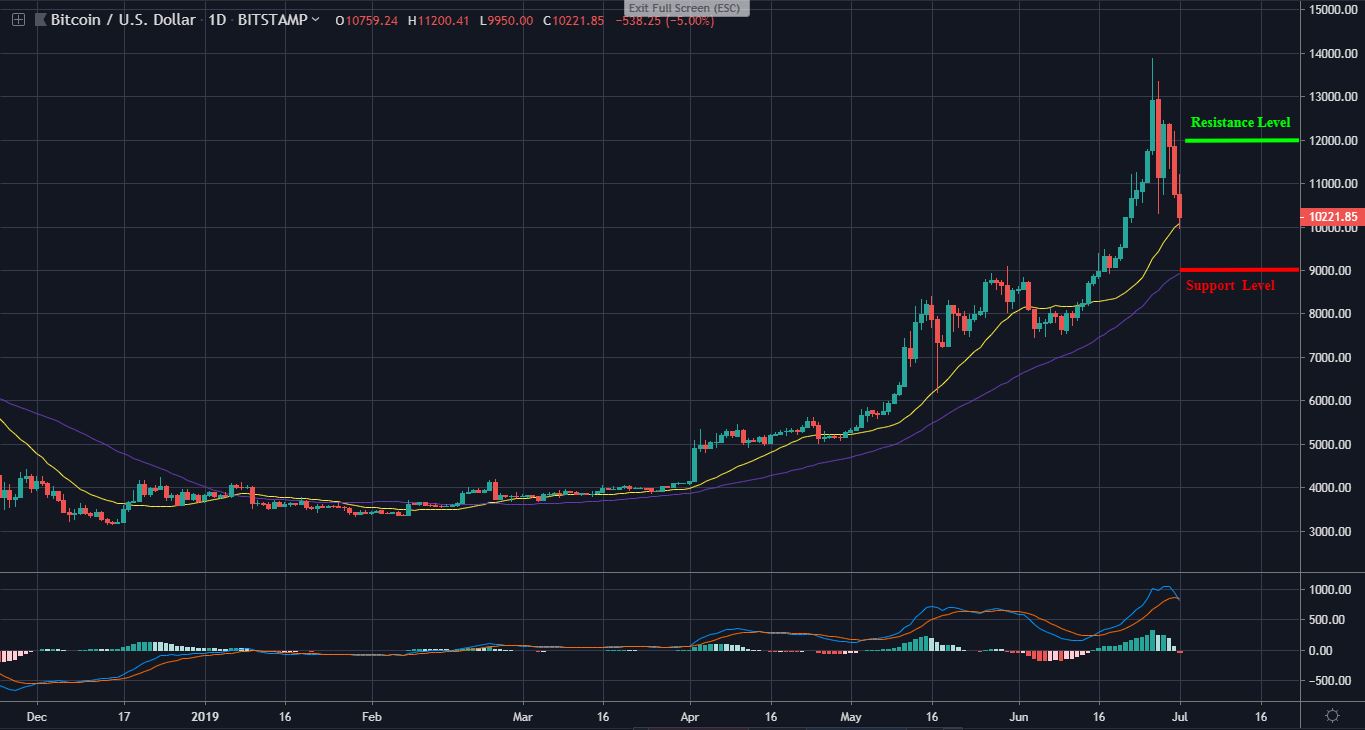
BTC/USD Long-term Trend: Bearish (1D chart)
Key Levels:
Resistance levels: $12000, $13000
Support levels: $9000, $8500
For the past few months, Bitcoin trading has been respecting the blue 50-day MA as the market currently test the yellow 21-day MA at $10,200, the currency trading price of Bitcoin. A notable break below the yellow line could bring the token to strong support at $9000, where the blue line lies. Below the mentioned support, ETH bears may further locate support at $8500 and below.
As pictured on the 4-hours MACD, Bitcoin is about to see another bearish move in the market. For a bullish continuation, the buyers need to show a strong reaction to send the price higher to $12000, $13,000 and $14,000 resistances. Still, the market is rising on a short-term bearish scenario.
BTC/USD Medium -term Trend: Bearish (4H Chart)
In the medium-term, Bitcoin’s price has witnessed a significant drop in the past five days, amounting to about 25% loss. The 4-hours MACD which is about to see a cross-down, the moving averages are now sloping downward as the price action breaks down. However, the bears are gaining control of the market.
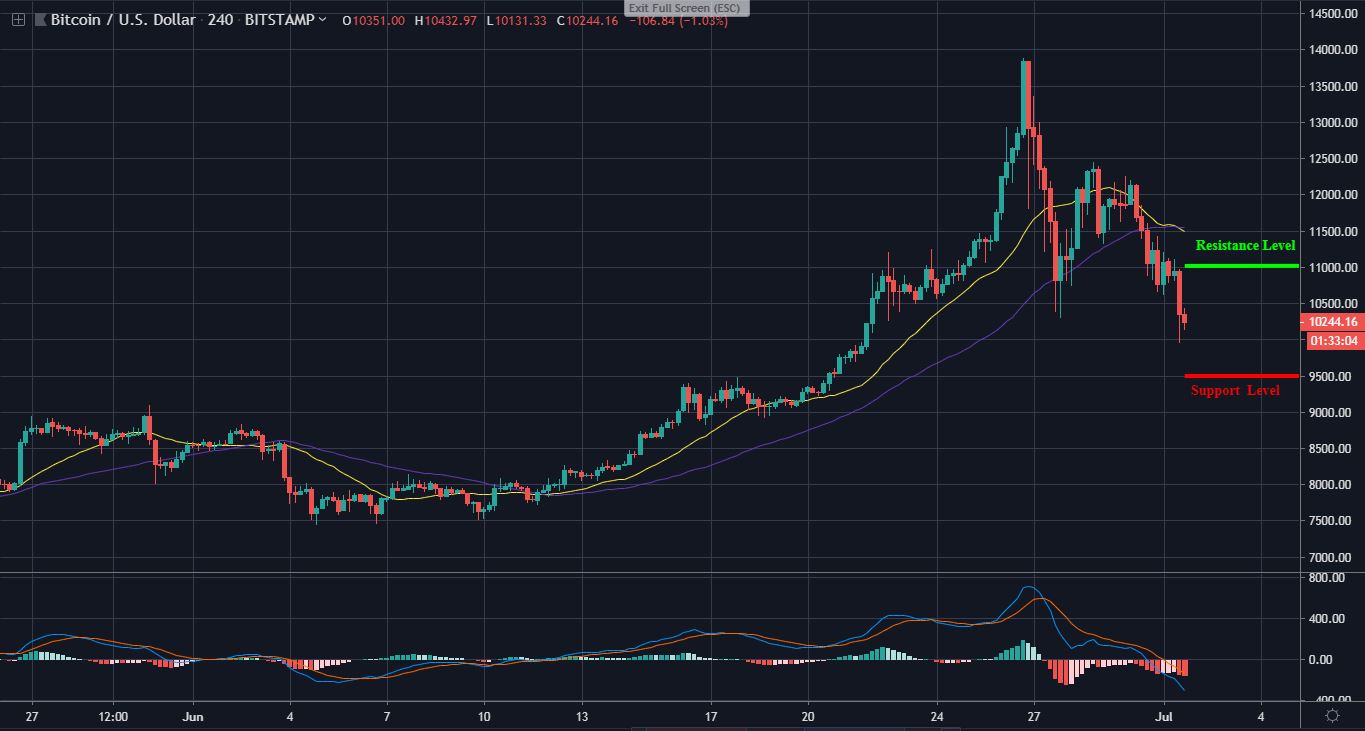
Following the recent $10500 break, which has been acting as a strong level for a while now; Bitcoin may further move at the $9,500, $9,200 and $8800 supports. The 4-hours MACD has now seen a downward move to the negative zone. If the market retraces, the bulls may find levels at the $11,000, $11,500 and possibly $12,150 resistance.
Please note: Cryptovibes.com is not a financial advisor. Do your own research before investing your funds in any financial asset or presented product or event. We are not responsible for your investing results.