At press time, the price of the crypto market leader has fallen 1.91% over the last 24 hours according to the crypto market tracking website, CoinMarketCap. As a result, the price of Bitcoin (BTC) is trading at $15,705.41, and BTC’s weekly price performance has further declined, standing at -7.21% over the last 7 days.
Altcoins have also gained a slight upper hand on BTC when it comes to market dominance, as BTC’s dominance has dropped 0.05% over the last day. Currently, BTC’s market dominance stands at 38.70%.
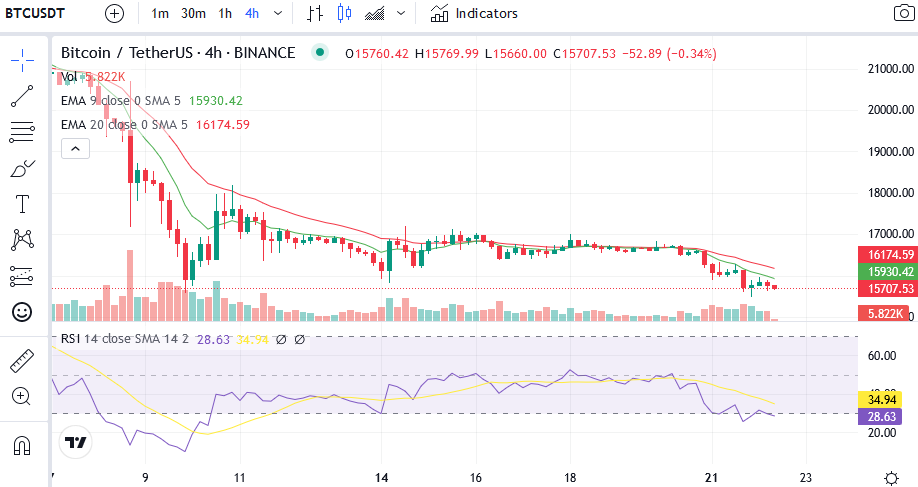
BTC’s price is currently being held down by the 4-hour 9 EMA line as it hovers just above the support level at $15,650. The 4-hour 9 EMA is currently positioned below the 4-hour 20 EMA line, which indicates that the selling pressure for BTC is stronger than the buying pressure. The relative positions of these EMA lines suggest that the bearishness will continue for the next 4-12 hours.
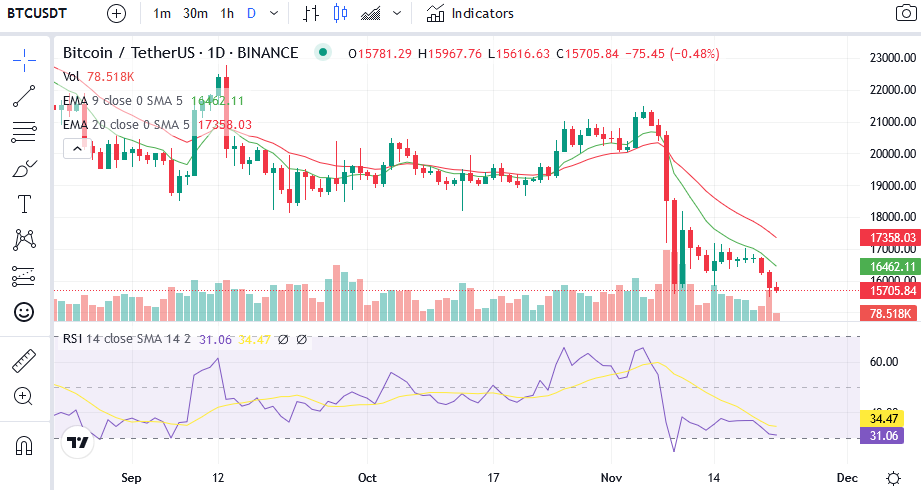
When looking at the daily chart for BTC/USDT, the price of BTC is breaking away from the daily 9 EMA line as the bearish trend continues for the largest crypto by market cap. The relative positions of the daily 9 and 20 EMA lines and their respective negative slopes suggest that there is a further price drop on the cards for BTC.
The daily RSI indicator also supports a bearish thesis as the daily RSI line is positioned below the daily RSI SMA line and is sloped negatively toward oversold territory.
Disclaimer: The views and opinions, as well as all the information shared in this price analysis, are published in good faith. Readers must do their own research and due diligence. Any action taken by the reader is strictly at their own risk. Coin Edition and its affiliates will not be held liable for any direct or indirect damage or loss.