The situation has almost not changed since yesterday as bears remain more powerful than bulls.
BTC/USD
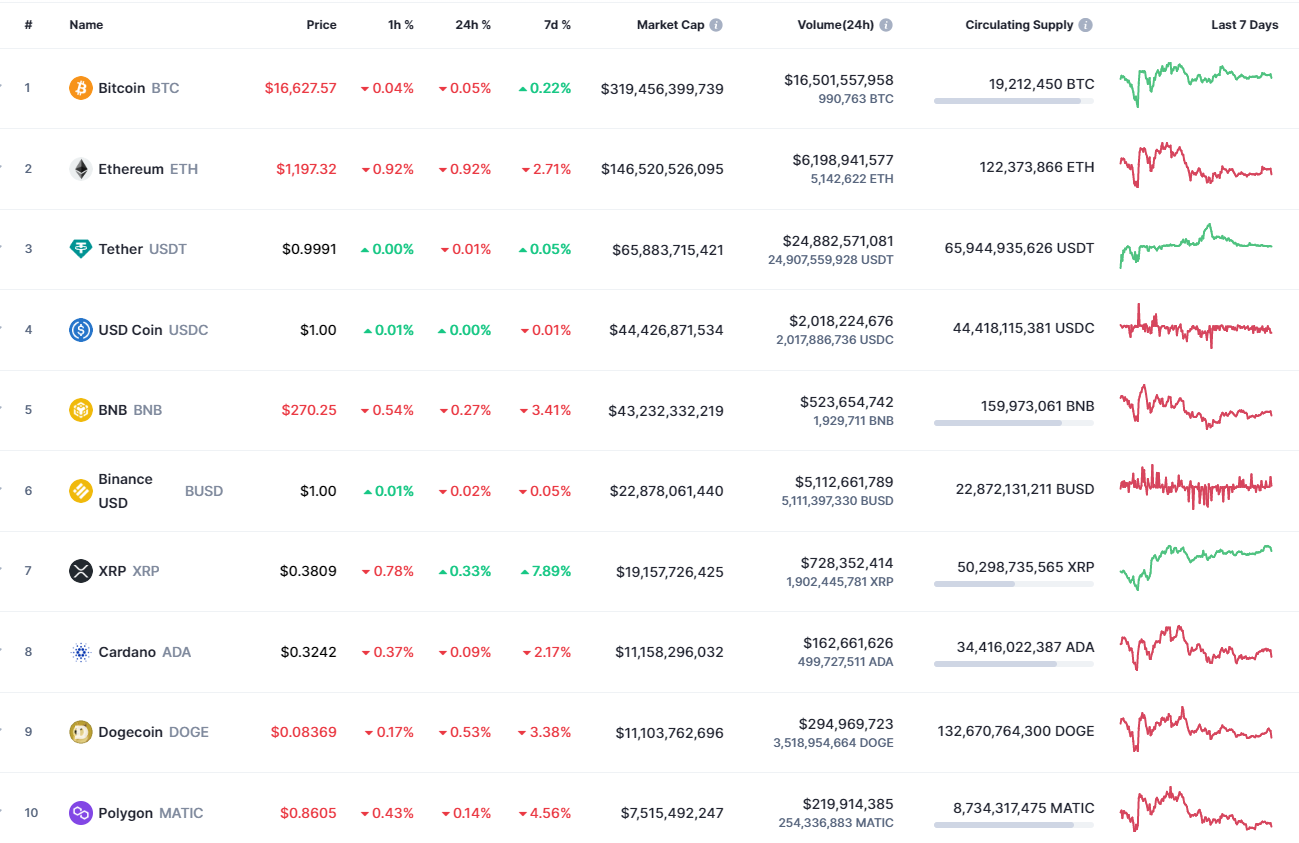
Bitcoin (BTC) is one of the least falling coins, going down by only 0.05% over the last 24 hours.
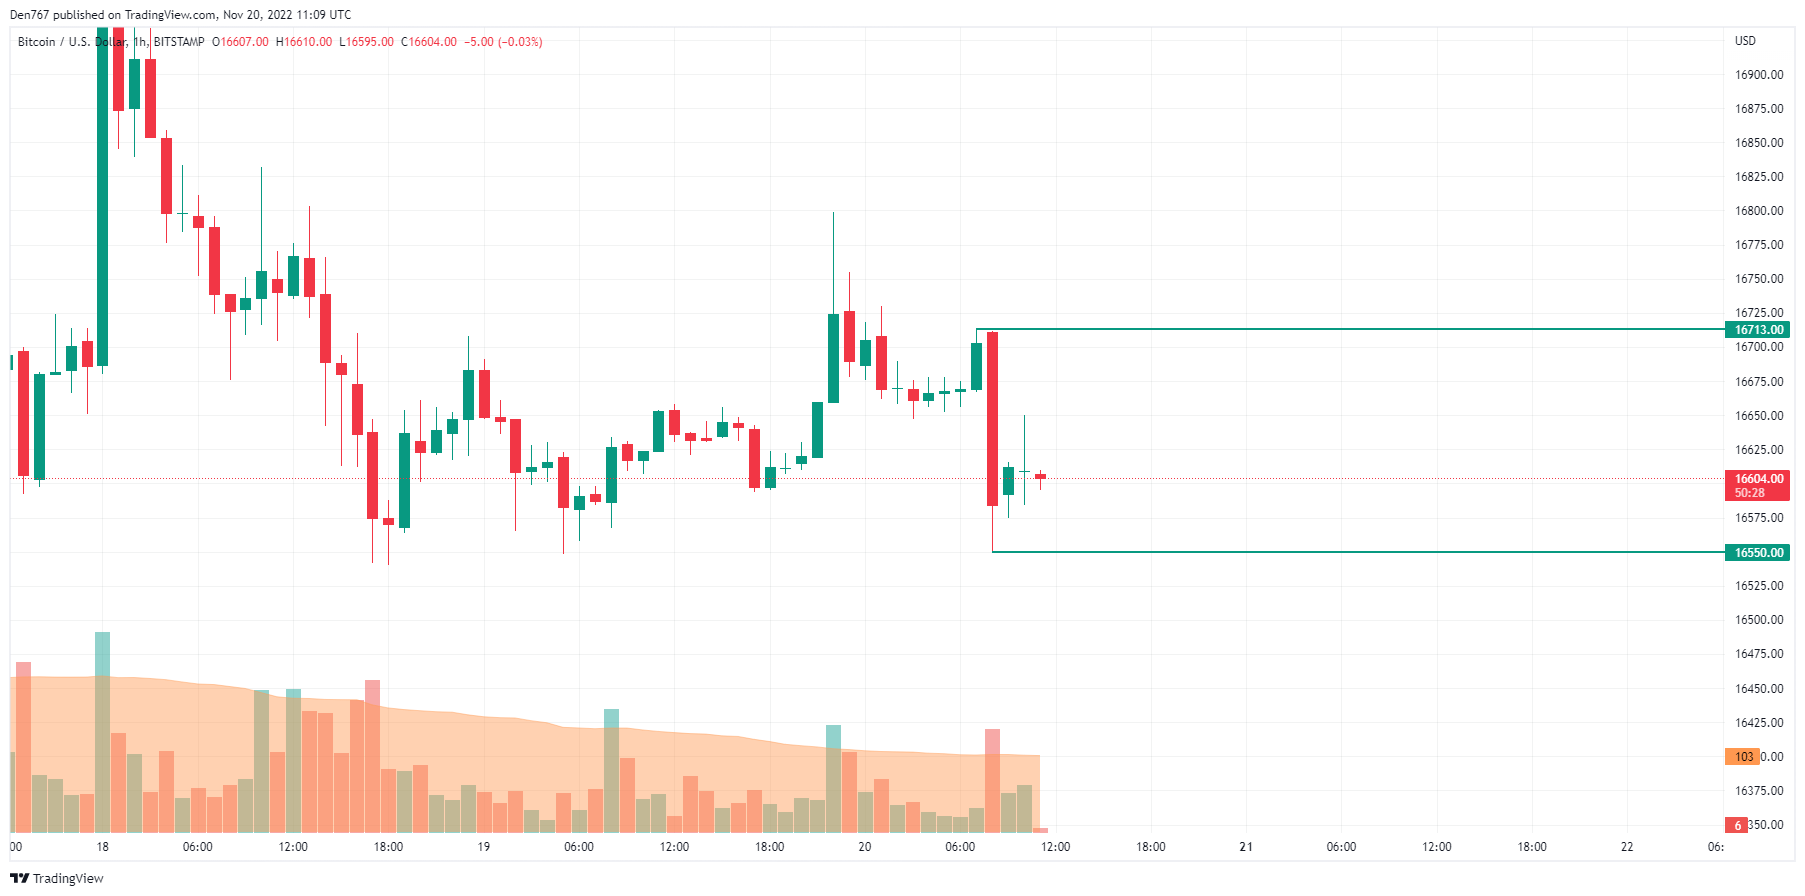
On the hourly time frame, Bitcoin (BTC) is trading sideways between the support at $16,550 and the resistance at $16,713. The daily ATR has almost passed, which means one should not expect any sharp moves until the end of the day. Thus, a new gap will be formed at the $16,530 mark, where trading on CME closed.
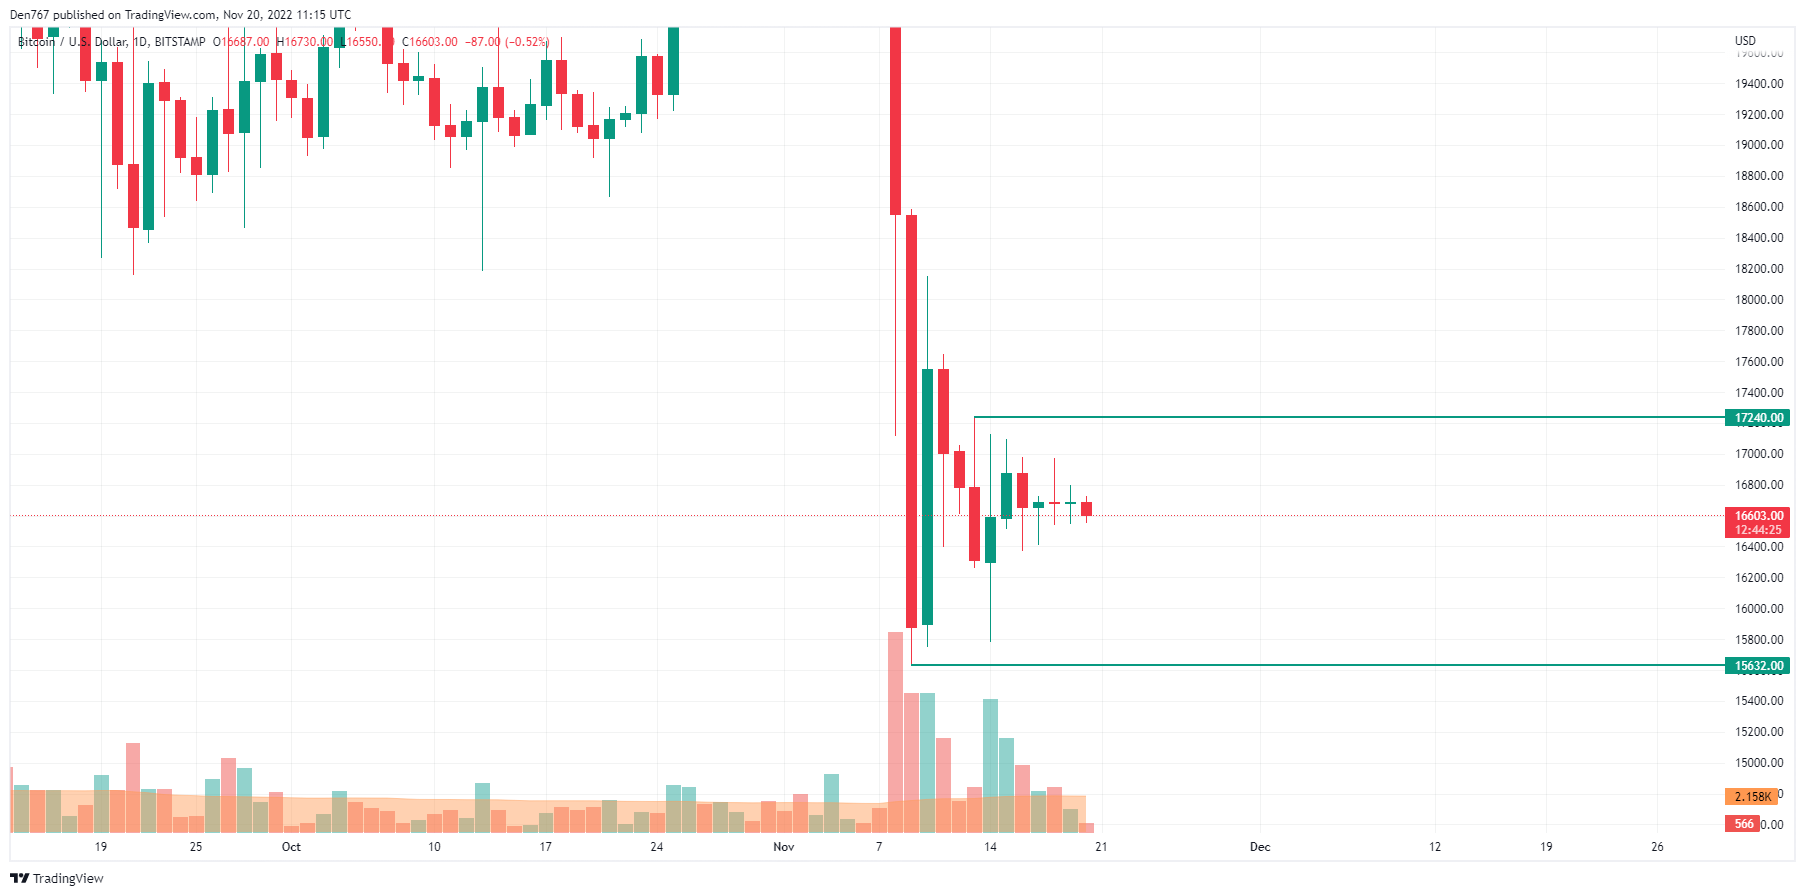
On the bigger chart, today's drop has not affected the position of Bitcoin (BTC). The price keeps trading sideways with neither bullish nor bearish signals.
However, if buyers want to seize the initiative, they should bring the rate back to the nearest resistance level at $17,240.
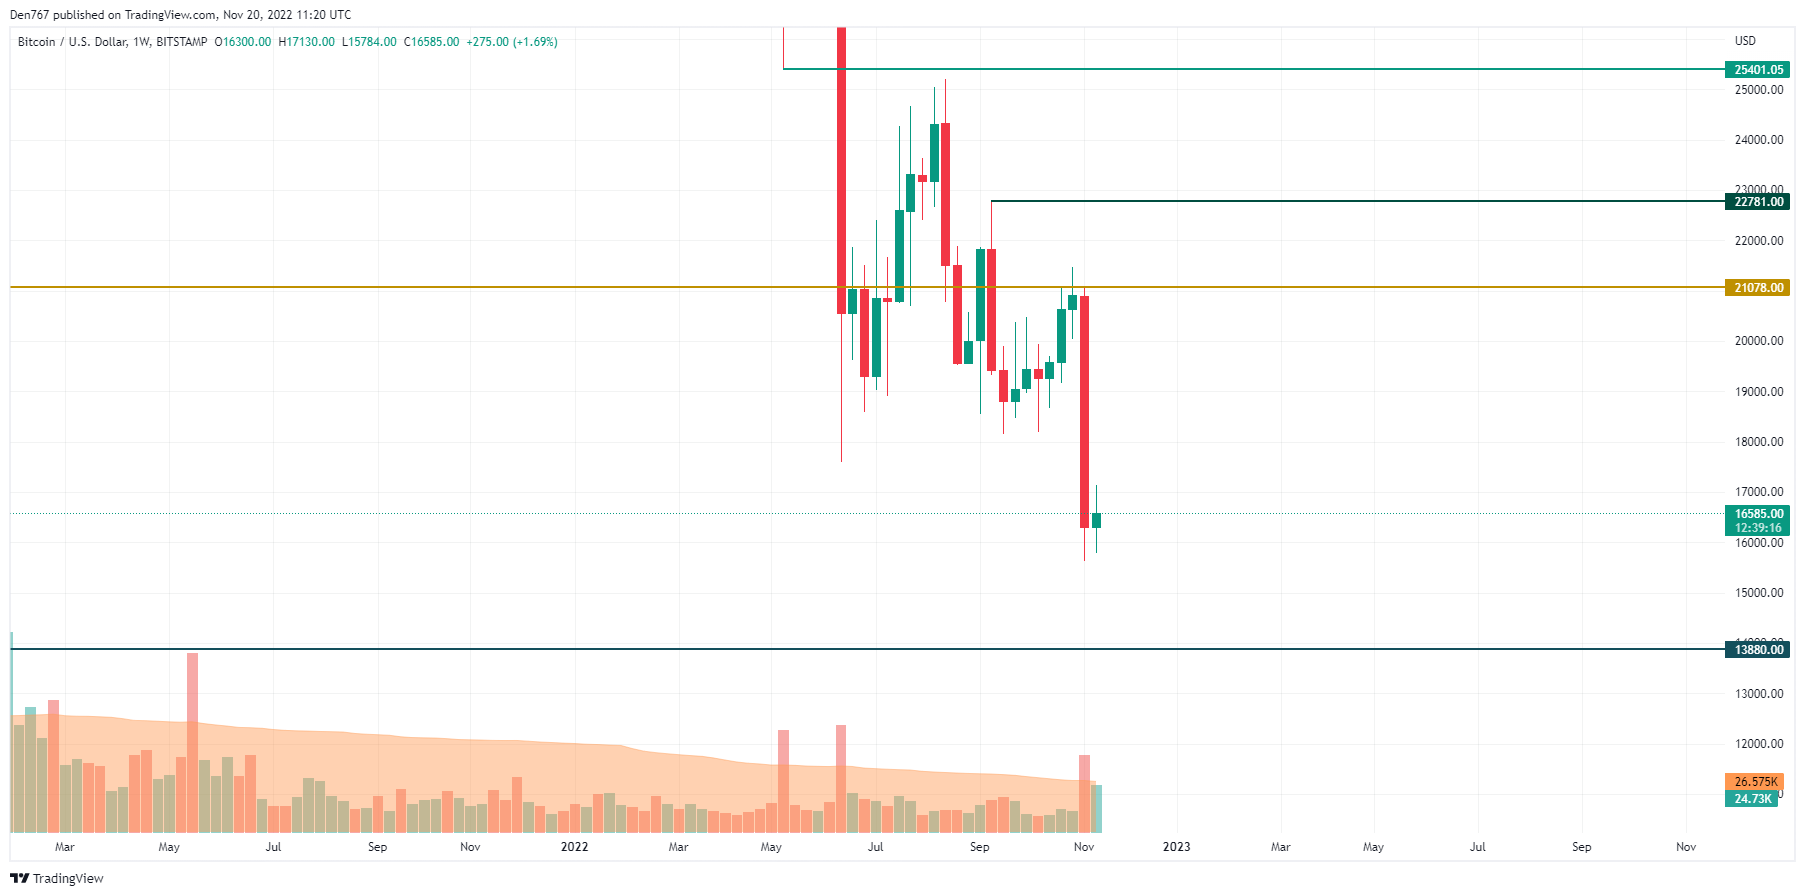
Even though the previous weekly candle was bearish for Bitcoin (BTC), the current one is likely to close in the green area. If that happens, traders might hope for a short-term correction to the resistance zone around $18,000.
Bitcoin is trading at $16,588 at press time.