In our recent BTC price analysis from two days ago, we stated that ‘There is no such asset that only points upwards, corrections are healthy in building a steady growth.’
As a crypto trader, you can never know when the Bears will pull the trigger and plunge the price following the bullish move. In under 8 hours, Bitcoin recorded a new 2019 high around $9100 (Bitstamp) and quickly reversed dropping down to the $8000 support area (a loss of $1100).
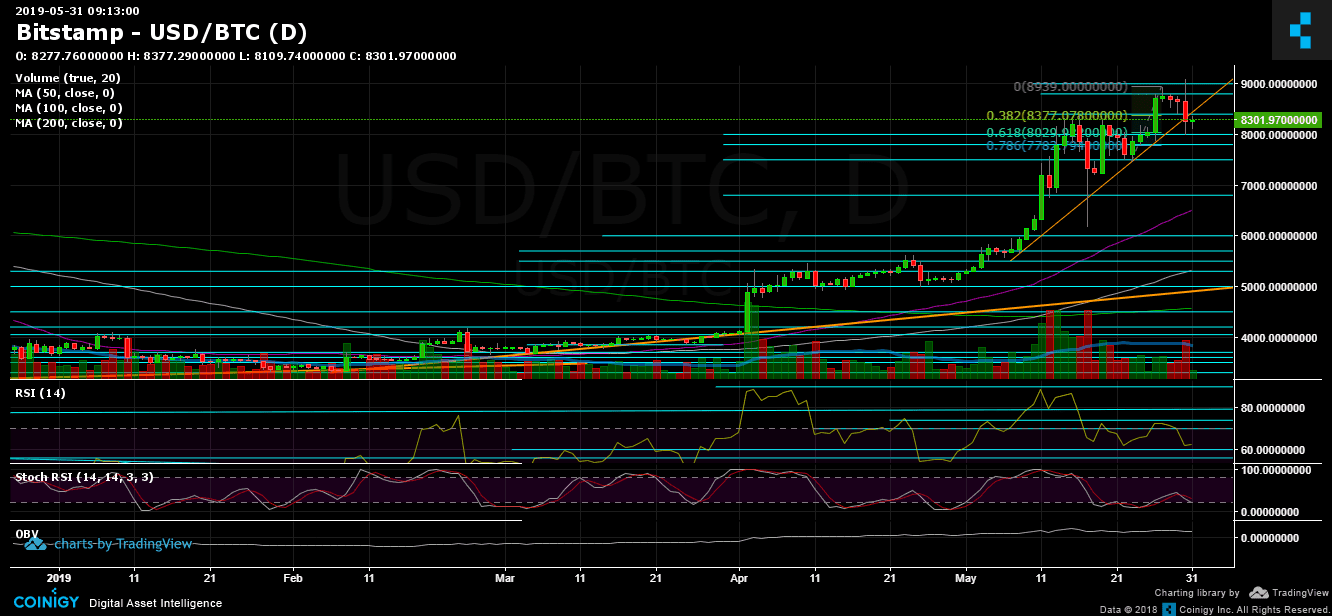
As mentioned above, the recent parabolic move from $6000 to $9000 just ‘ordered’ the violent correction. Will $8000 hold? Time will tell. But if not – it doesn’t mean the markets turn bearish again. $8000 is considered a very strong support area, along with the 61.8% Fibonacci retracement level (1-day chart).
Two Red Flags
One thing that I would like to point out is the negative divergence in the daily chart’s RSI. This kind of formation points out that strong hands are not the ones currently controlling the markets.
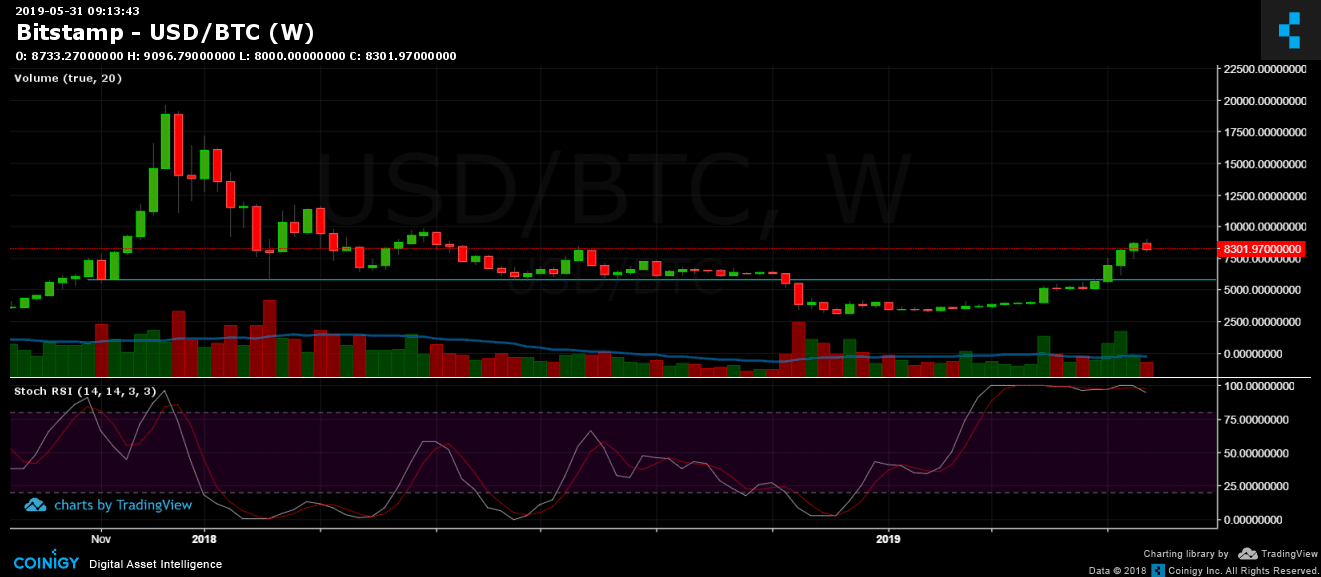
The second thing is the following weekly chart: As can be seen, the significant oscillator, the Stochastic RSI, had crossed over pointing down. Yet, not entering the bearish territory but better watch closely during the coming-up June. The last time we’d seen such a crossover took place back in December 2017, while Bitcoin was trading around $17,000.
Total Market Cap: $262 Billion
Bitcoin Market Cap: $147 Billion
BTC Dominance: 56.3%
Looking at the 1-day & 4-hour charts
– Support/Resistance:
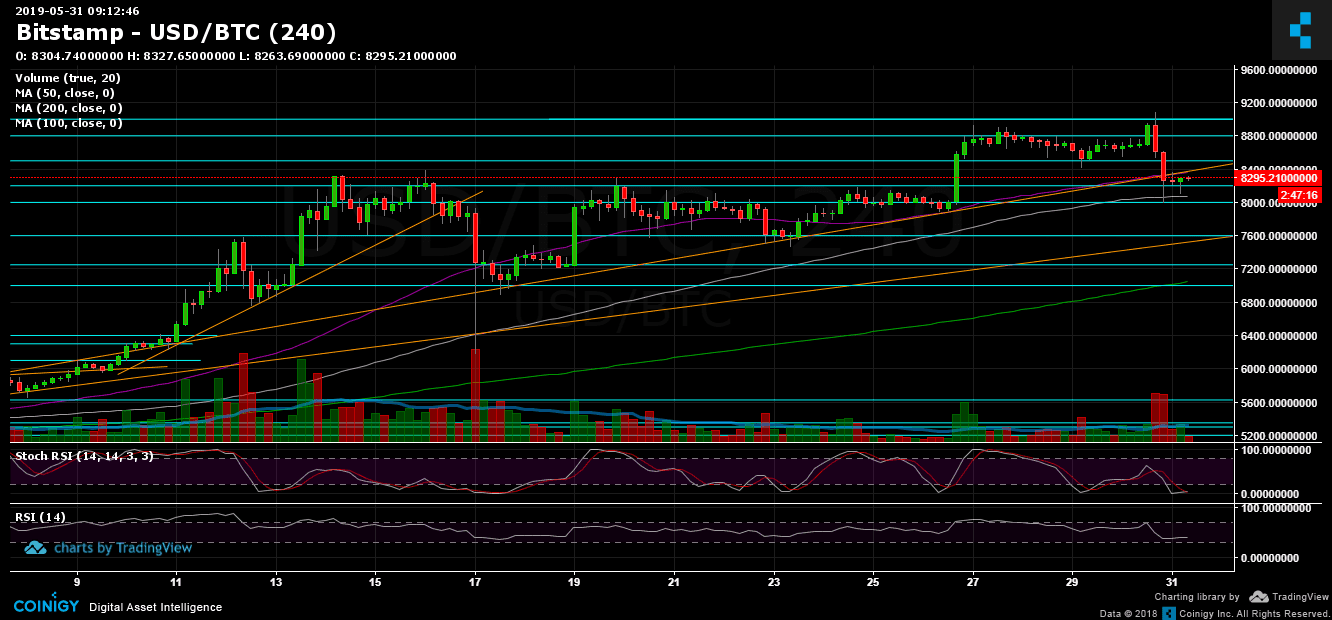
Following the breakdown of $8400, the next significant support lies at $8200. Further below lies $8000, $7800 and $7600. The last is the past week’s low along with the 4-hour MA-100 and the mid-term ascending trend-line (shown on the 4-hour chart). Further below is $7250 and $7000.
From above, the closest resistance the last week’s double top at $8400. Above lies $8500 and then the $8800 – $9000 resistance area. Higher above lies the $9200 – $9300 zone, before reaching the $9700 – $9800 area which was the highest of May 2018, and that is the last barrier before BTC reaches $10,000.
– Trading Volume: Yesterday’s trading was followed by a very high amount of volume, the highest volume in two weeks. We’ve pointed out that the recent rise of the past week was followed by a lower amount of volume (a low number of buyers).
– Daily chart’s RSI: The RSI is facing now the significant 60 support level. The Bulls hope to find support here. However, the RSI looks like losing its bullish momentum.
– BitFinex open short positions: Since our recent price analysis, there hasn’t been much change, whereas the open short positions number stands around 20.4 K BTC positions.
BTC/USD BitStamp 4-Hour Chart
BTC/USD BitStamp 1-Day Chart