Bitcoin is struggling to continue the recent rally, as the price has been retracing over the last few days. However, considering the significant support levels available, the short-term future is still looking bright for the bulls.
Technical Analysis
Technical Analysis By: Edris
The Daily Chart:
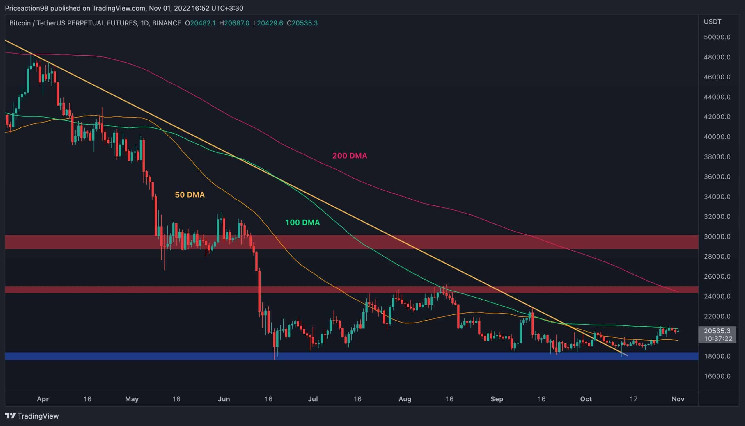
Looking at the daily timeframe, the last week’s rally has come to a halt, as the price is yet to break above the $21K mark. The 100-day moving average is currently acting as an obstacle, rejecting the price to the downside. Thus, a short-term correction has seemingly begun over the last couple of days, and the price may retest the 50-day moving average, located around the $19,500 level, which would be considered a significant dynamic support level.
In case of a pullback to the 50-day moving average and an eventual bullish breakout above the 100-day moving average, the significant $24K resistance level and the 200-day moving average, trending around the same area, would be the next likely targets for the rally.
The 4-Hour Chart:
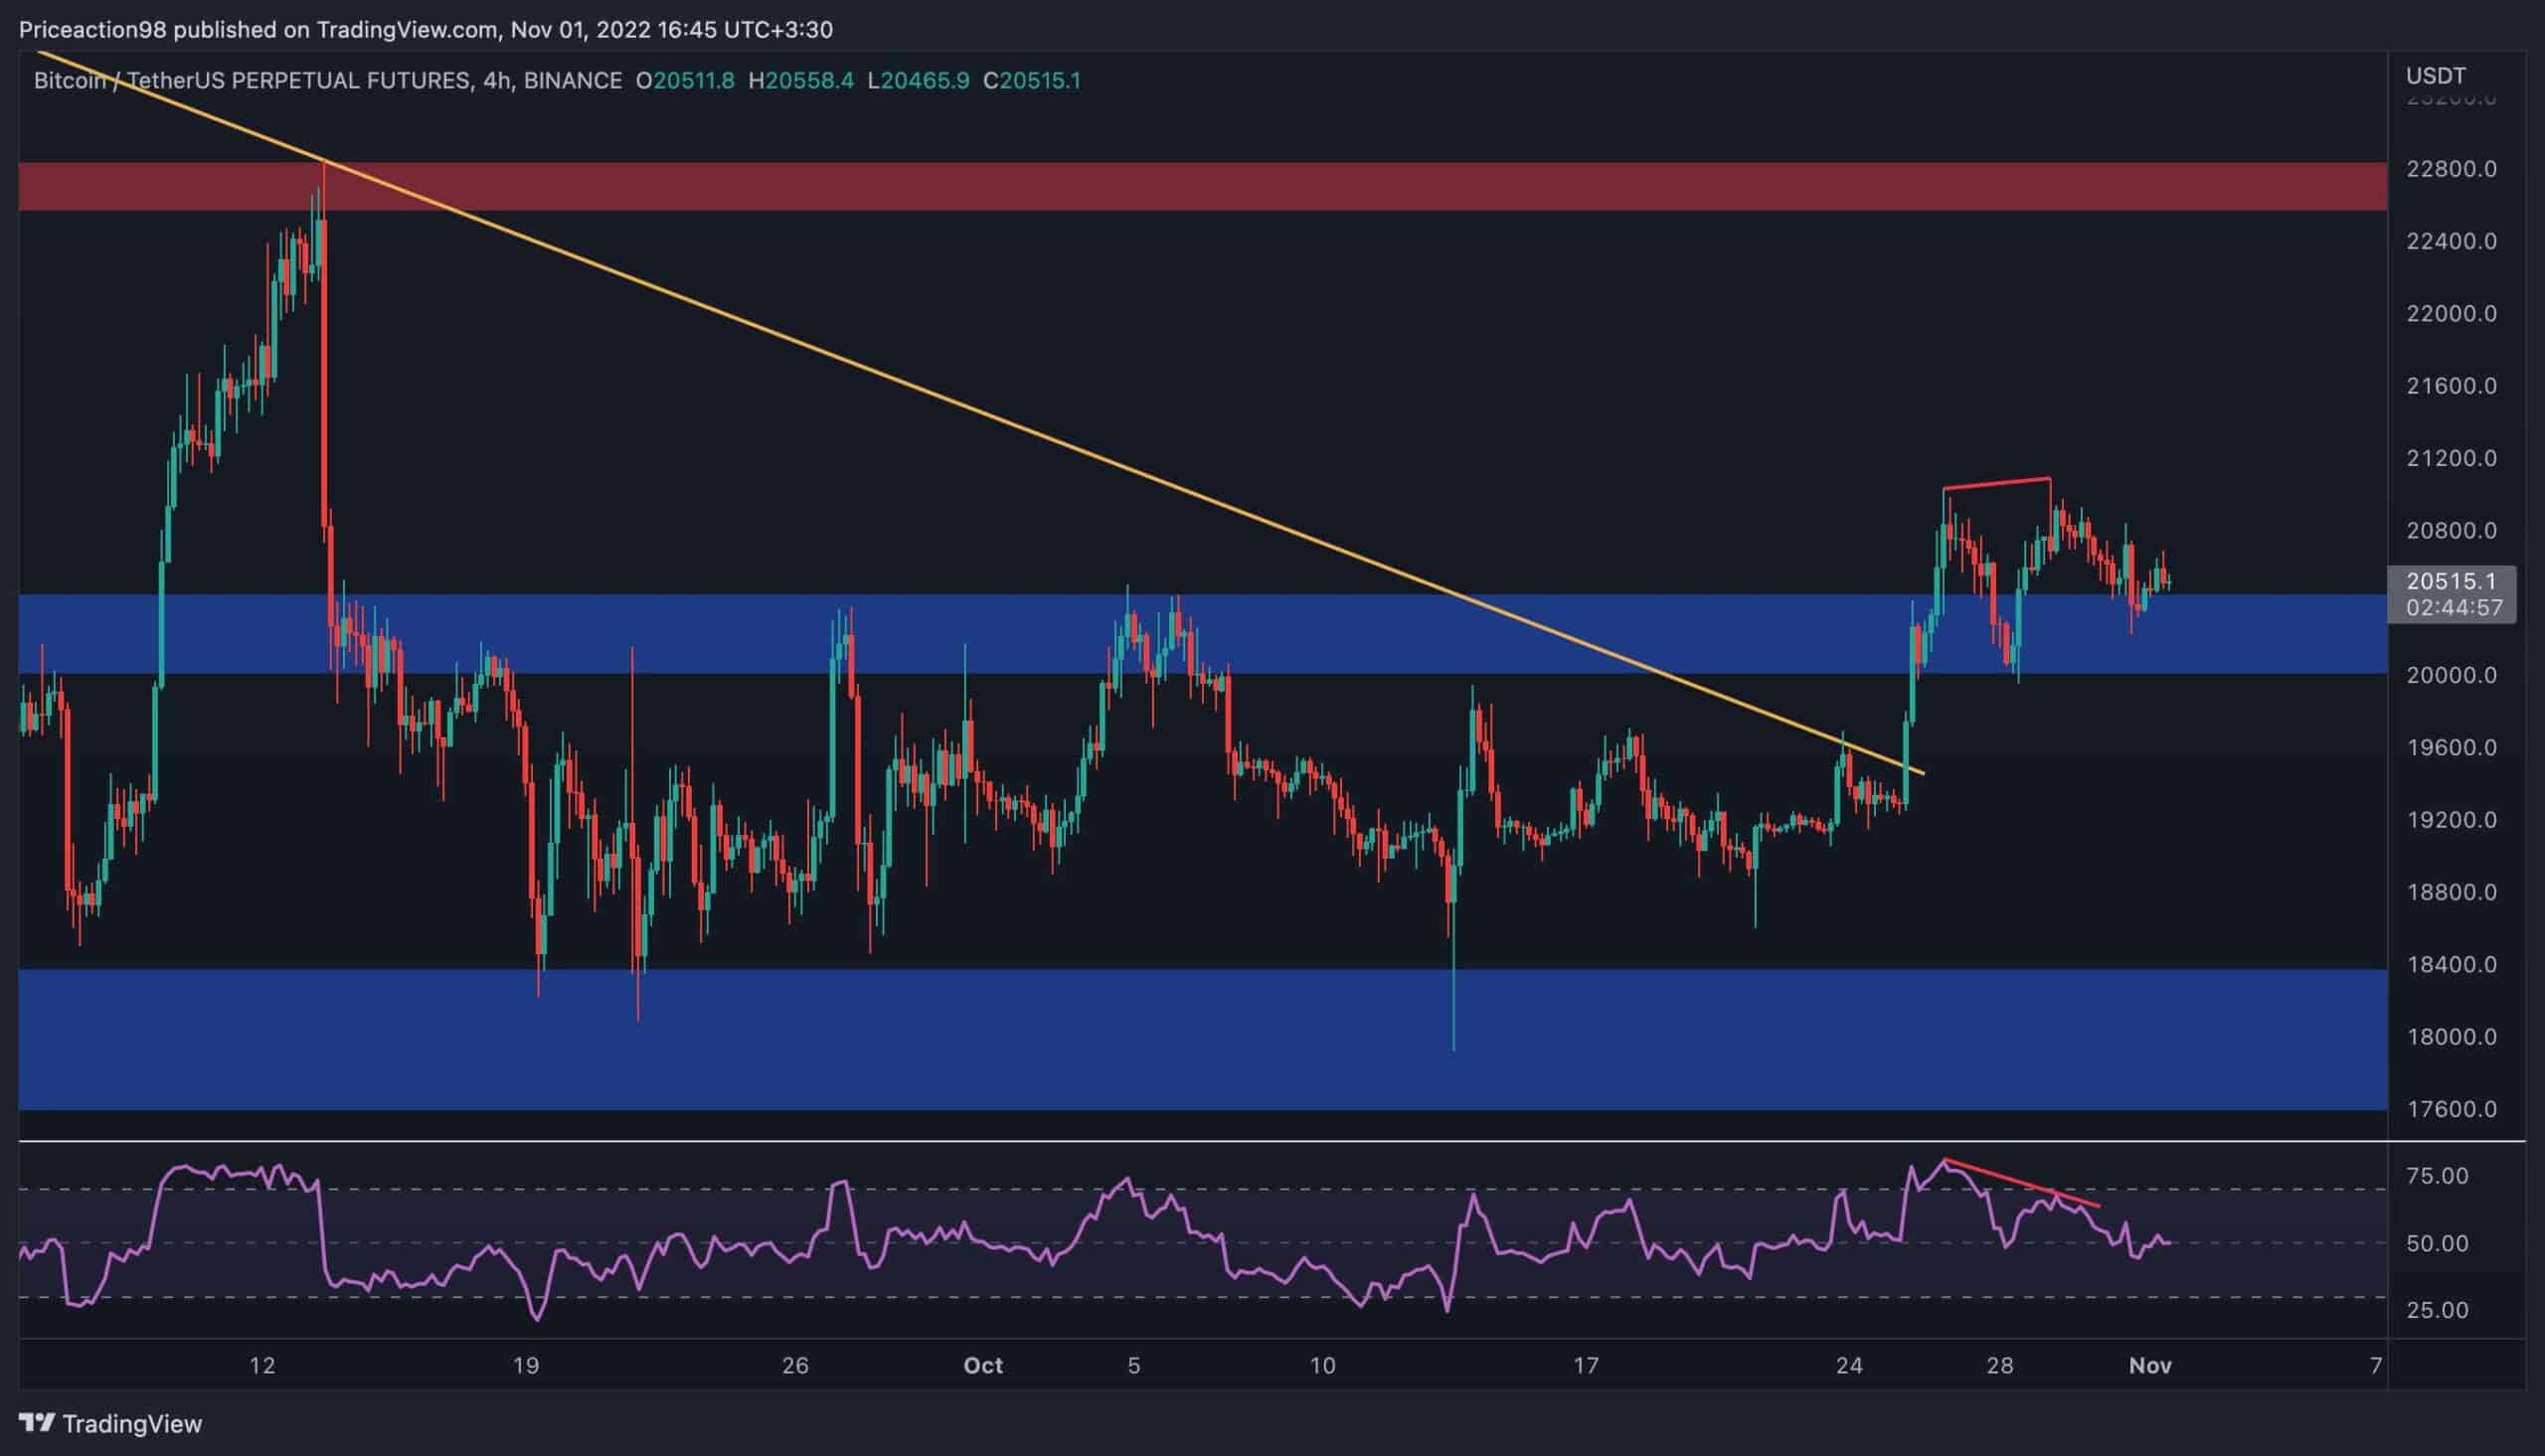
On the 4-hour chart, the price has been retesting the $20K level over the last few days after breaking above it for the first time in weeks. If the mentioned support level holds and successfully pushes the price to the upside, a rally toward the $22,500 level would be likely.
However, considering the fact that the RSI indicator has been showing a massive bearish divergence between the last two price highs, there is also a reasonable probability for a more profound drop below $20K which would make the recent rally a clear bull trap and could potentially lead to a bearish continuation below the $18K level. So, cautious decision-making would be essential as a result of conflicting signals between classical price action and momentum.
Onchain Analysis
Onchain Analysis By Shayan
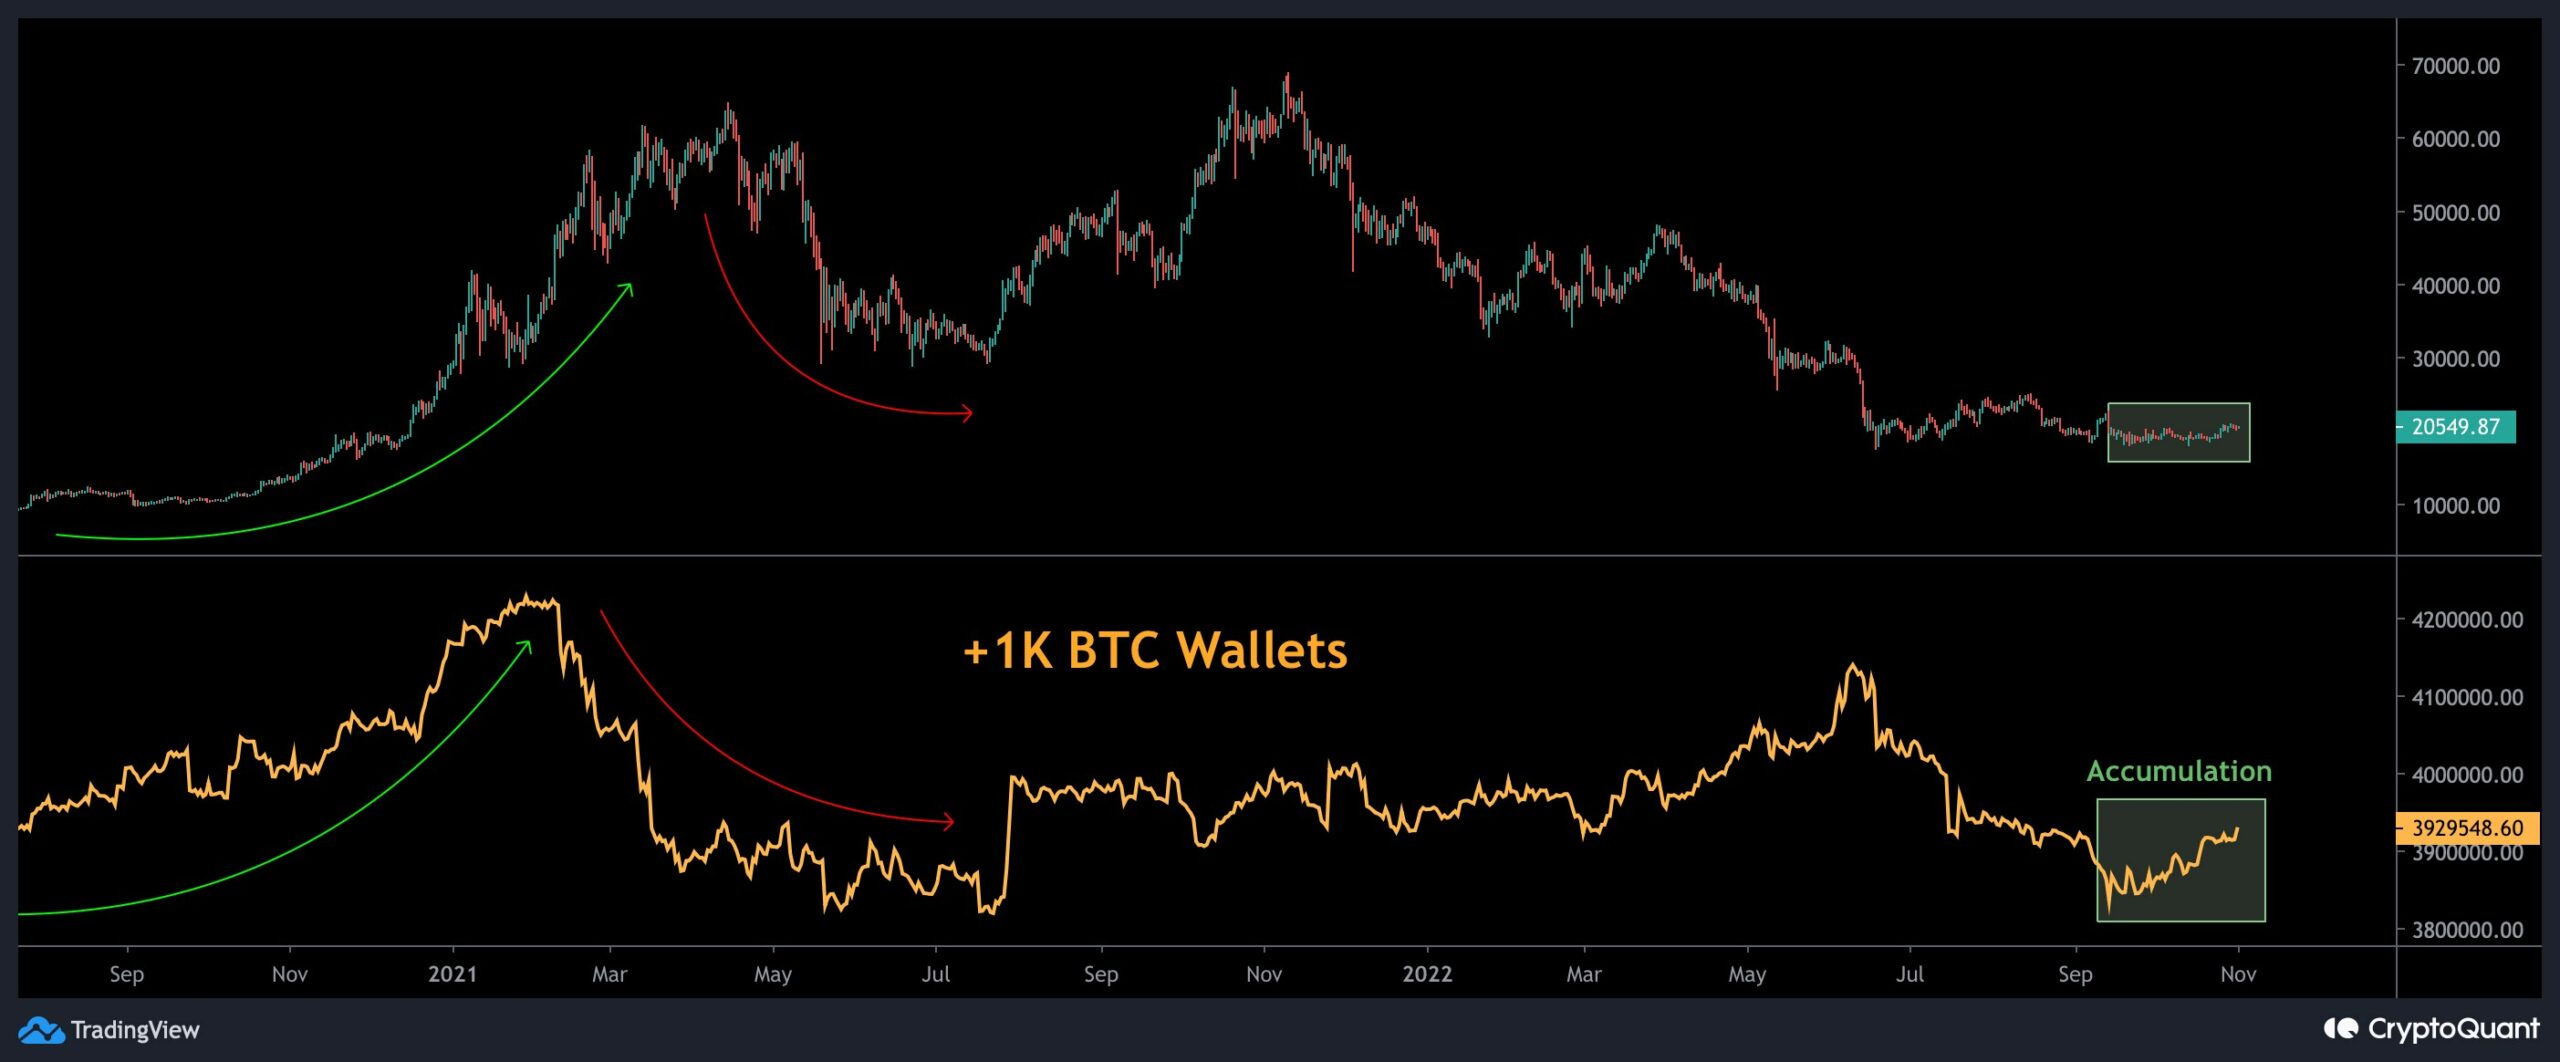
The following chart consists of the UTXO Value Bands(Wallets holding more than 1K Bitcoin) and Bitcoin’s price. The distribution of each UTXO is displayed using UTXO Value Bands. This indicator highlights the behavior of whales or retailers, broken down by the number of coins they hold and price movements.
The UTXO Value Bands(Wallets holding more than 1K BTC), which represent the whales, had surged significantly during the early stages of the 2021 bull run indicating massive accumulation. However, the metric plunged before Bitcoin marked the $65K top, demonstrating this cohort’s distribution behavior.
The metric declined after Bitcoin broke below the $30K decisive level in June and marked new lows. However, during the recent consolidation stage of the market, between the $18K and $21K levels, it reversed and has been rising steadily. This is indicative of whales accumulation. The bear market bottoms typically form during this stage.