https://www.tradingview.com/x/FZrhFbvl/
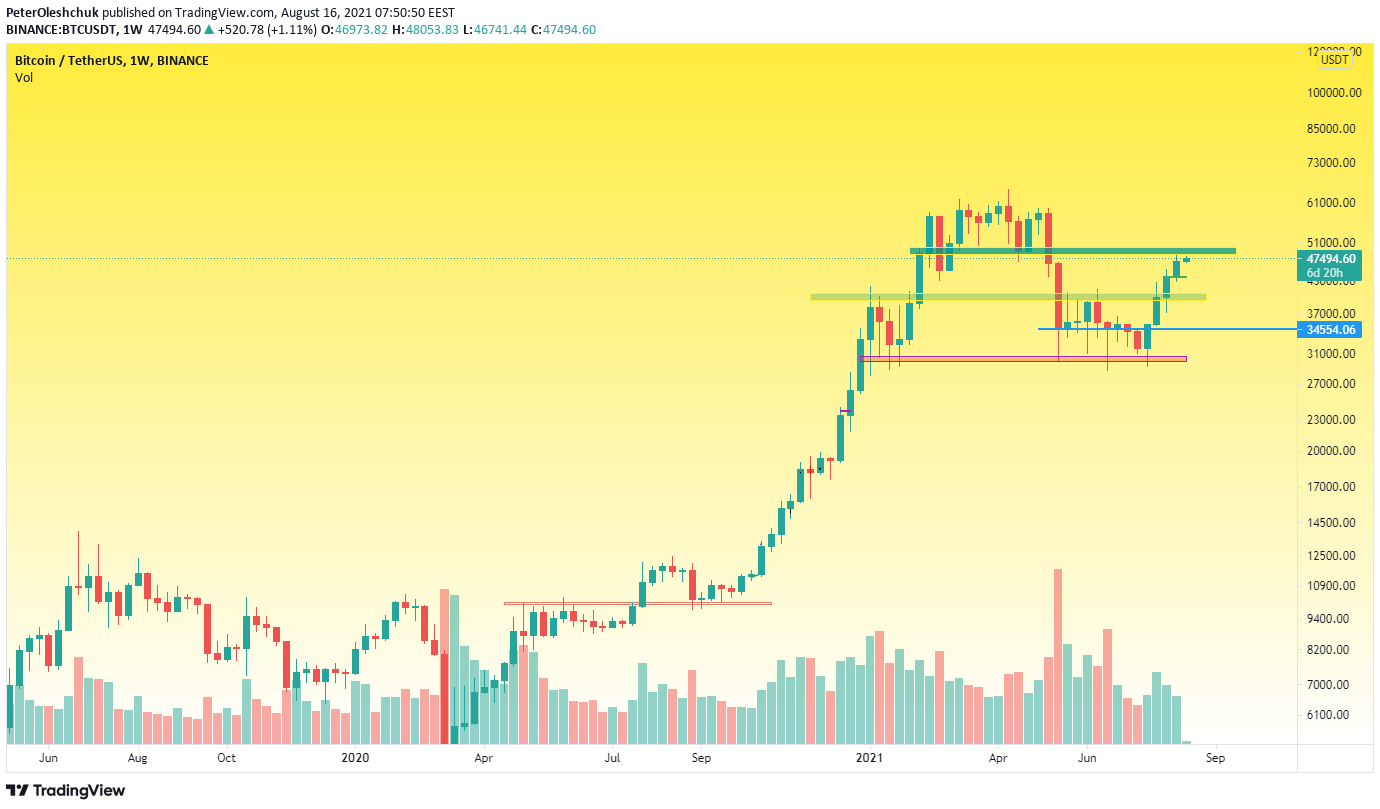
The trading week in the BTC market started on a positive note. Although last week's candle closed at lower volumes than the previous one, sellers did not show serious resistance. Closing the week at $46,973, buyers prepared a foothold for an attack in the range of $48,000-$50,000 this week. The test of this range is the main scenario, which we wrote about in our previous analysis.
The fact is that this range is the starting point for a new medium-term trend for both buyers and sellers. Therefore, control over this liquidity zone will provide a significant advantage. Also, it determines whether the price will continue the global correction with the final target of $27,000-$28,000, or whether a new global growth wave has just begun.
Technical Analysis of BTC on a Daily Timeframe
Analyzing the daily timeframe, we see that sellers did not use the weekend for an unpleasant surprise:
https://www.tradingview.com/x/6WmNsrJh/
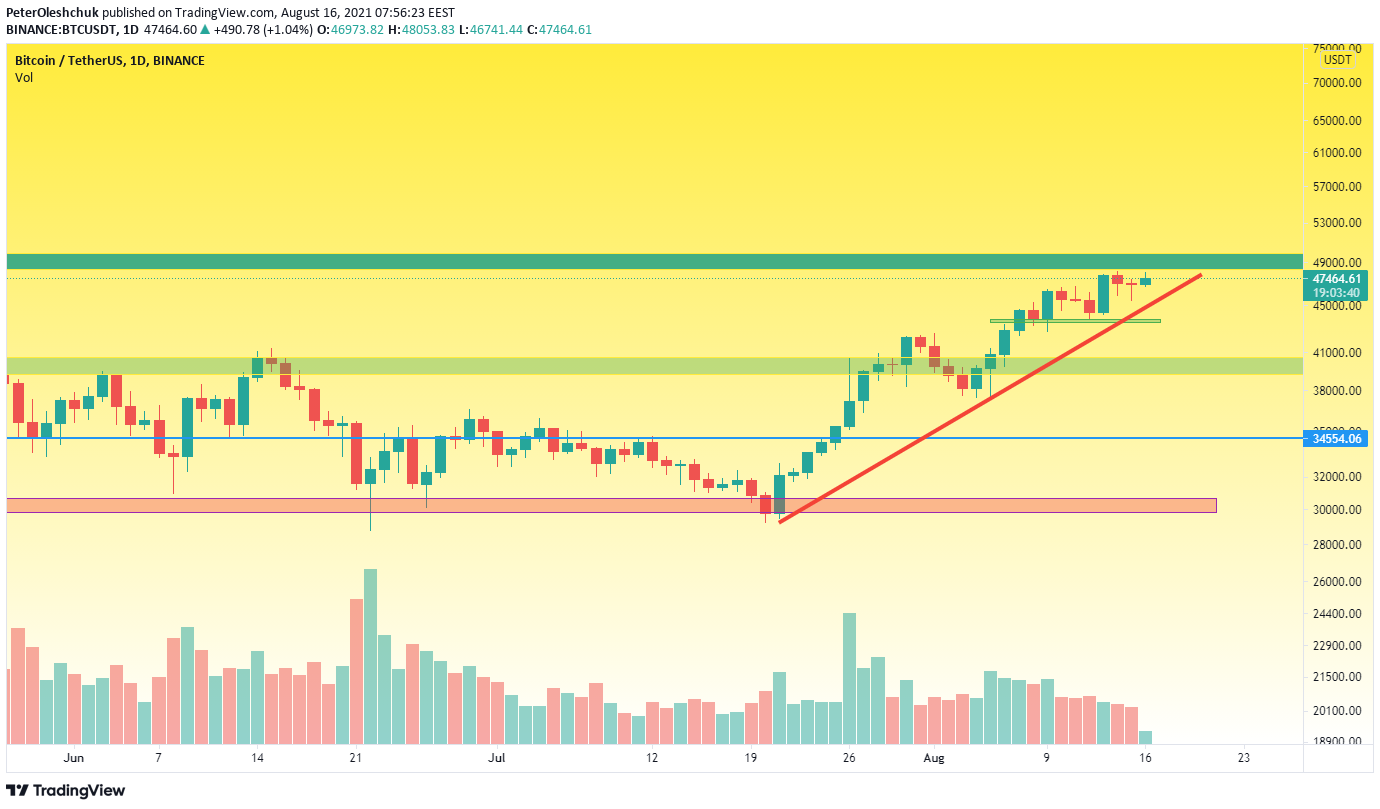
On the chart, we see that the price is dangerously drifting between the red trend line and local highs. Due to the low activity of BTC buyers, the update of highs looks weak. So, sellers need little effort to change the local trend.
However, each local attack of sellers in the daily timeframe ends with the daily candle closing with the pins down. The slowdown of the BTC local growth trend is caused by a decrease in the Bitcoin impact on the cryptocurrency market. This happens systematically starting from 1 August:
https://www.tradingview.com/x/eW0N38tG/
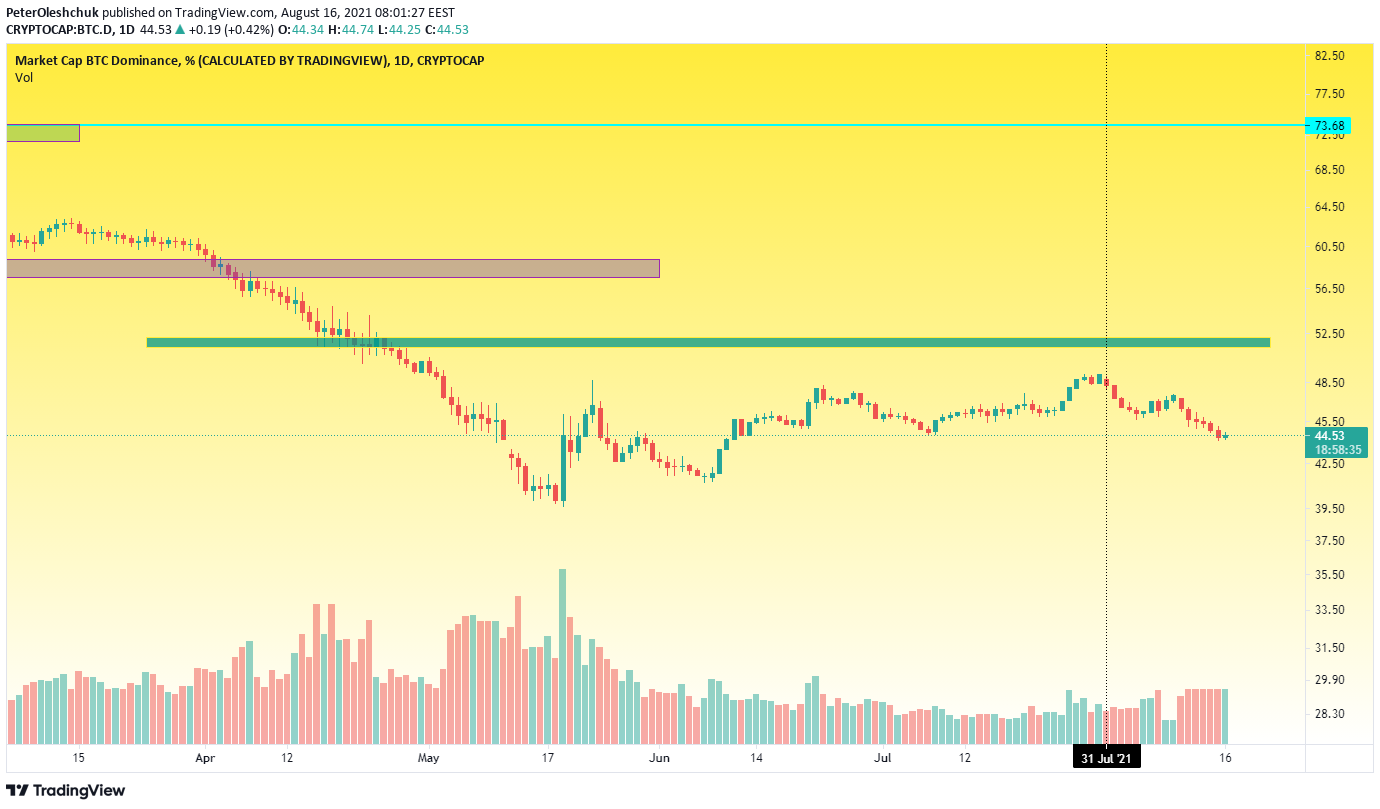
Decreased Dominance of Bitcoin Has a Positive Effect on Altcoins
This fact opens the way for other altcoins to freedom and loud shots of their prices up. In this way, most altcoins reach the upper limits of their consolidations, which were set in early June.
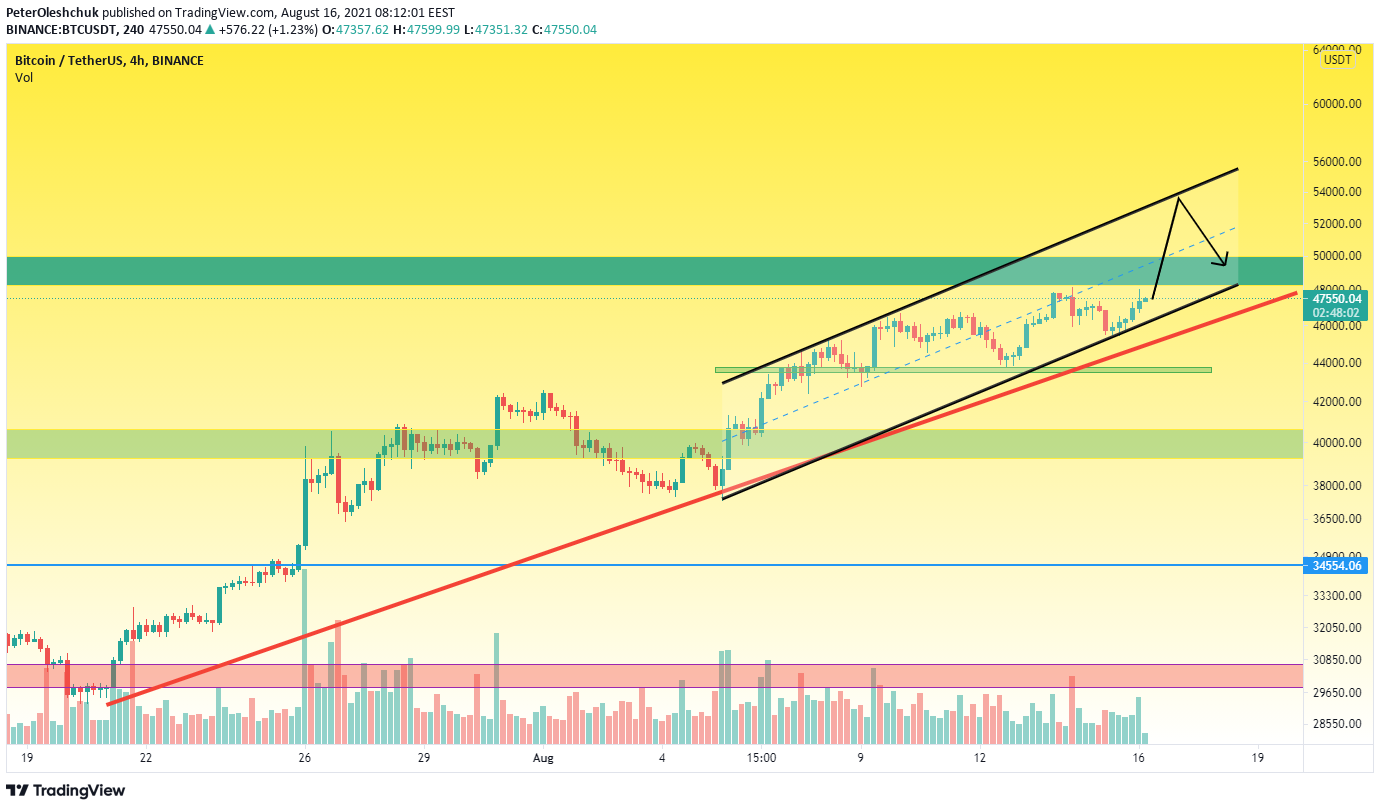
Given the low aggression of sellers in the BTC market and the lack of braking volumes, on the way to the price range of $48,000-$50,000, we can safely predict the scenario of breaking the critical range up. In this scenario, the BTC price will stop at $53,000 and begin its correction to $48,000-$50,000:
https://www.tradingview.com/x/CVEQRYuA/
It is the price above the range of $48,000-$50,000 at least a 4-hour timeframe that will confirm this scenario. Though, the appearance of critically high trading volumes in the range of $48,000-$50,000 and the beginning of sharp local rebounds will indicate the preparation of sellers of the foundation for a new fall wave.