Yesterday’s BTC price action shook traders throughout the day with rounds of short and long liquidations. Bitcoin’s price managed to hold the 200-day moving average at $45.3k as support, making an intra-day wick to $46k, and pushing higher into yesterday’s daily close at $47.1k
So far, today’s price action appears similar to yesterday’s wild swings. It’s another low-volume pullback that liquidated longs. This time, BTC nearly touched critical support at the 200-day moving average – around $45.4K – before wicking back up, as of writing these lines.
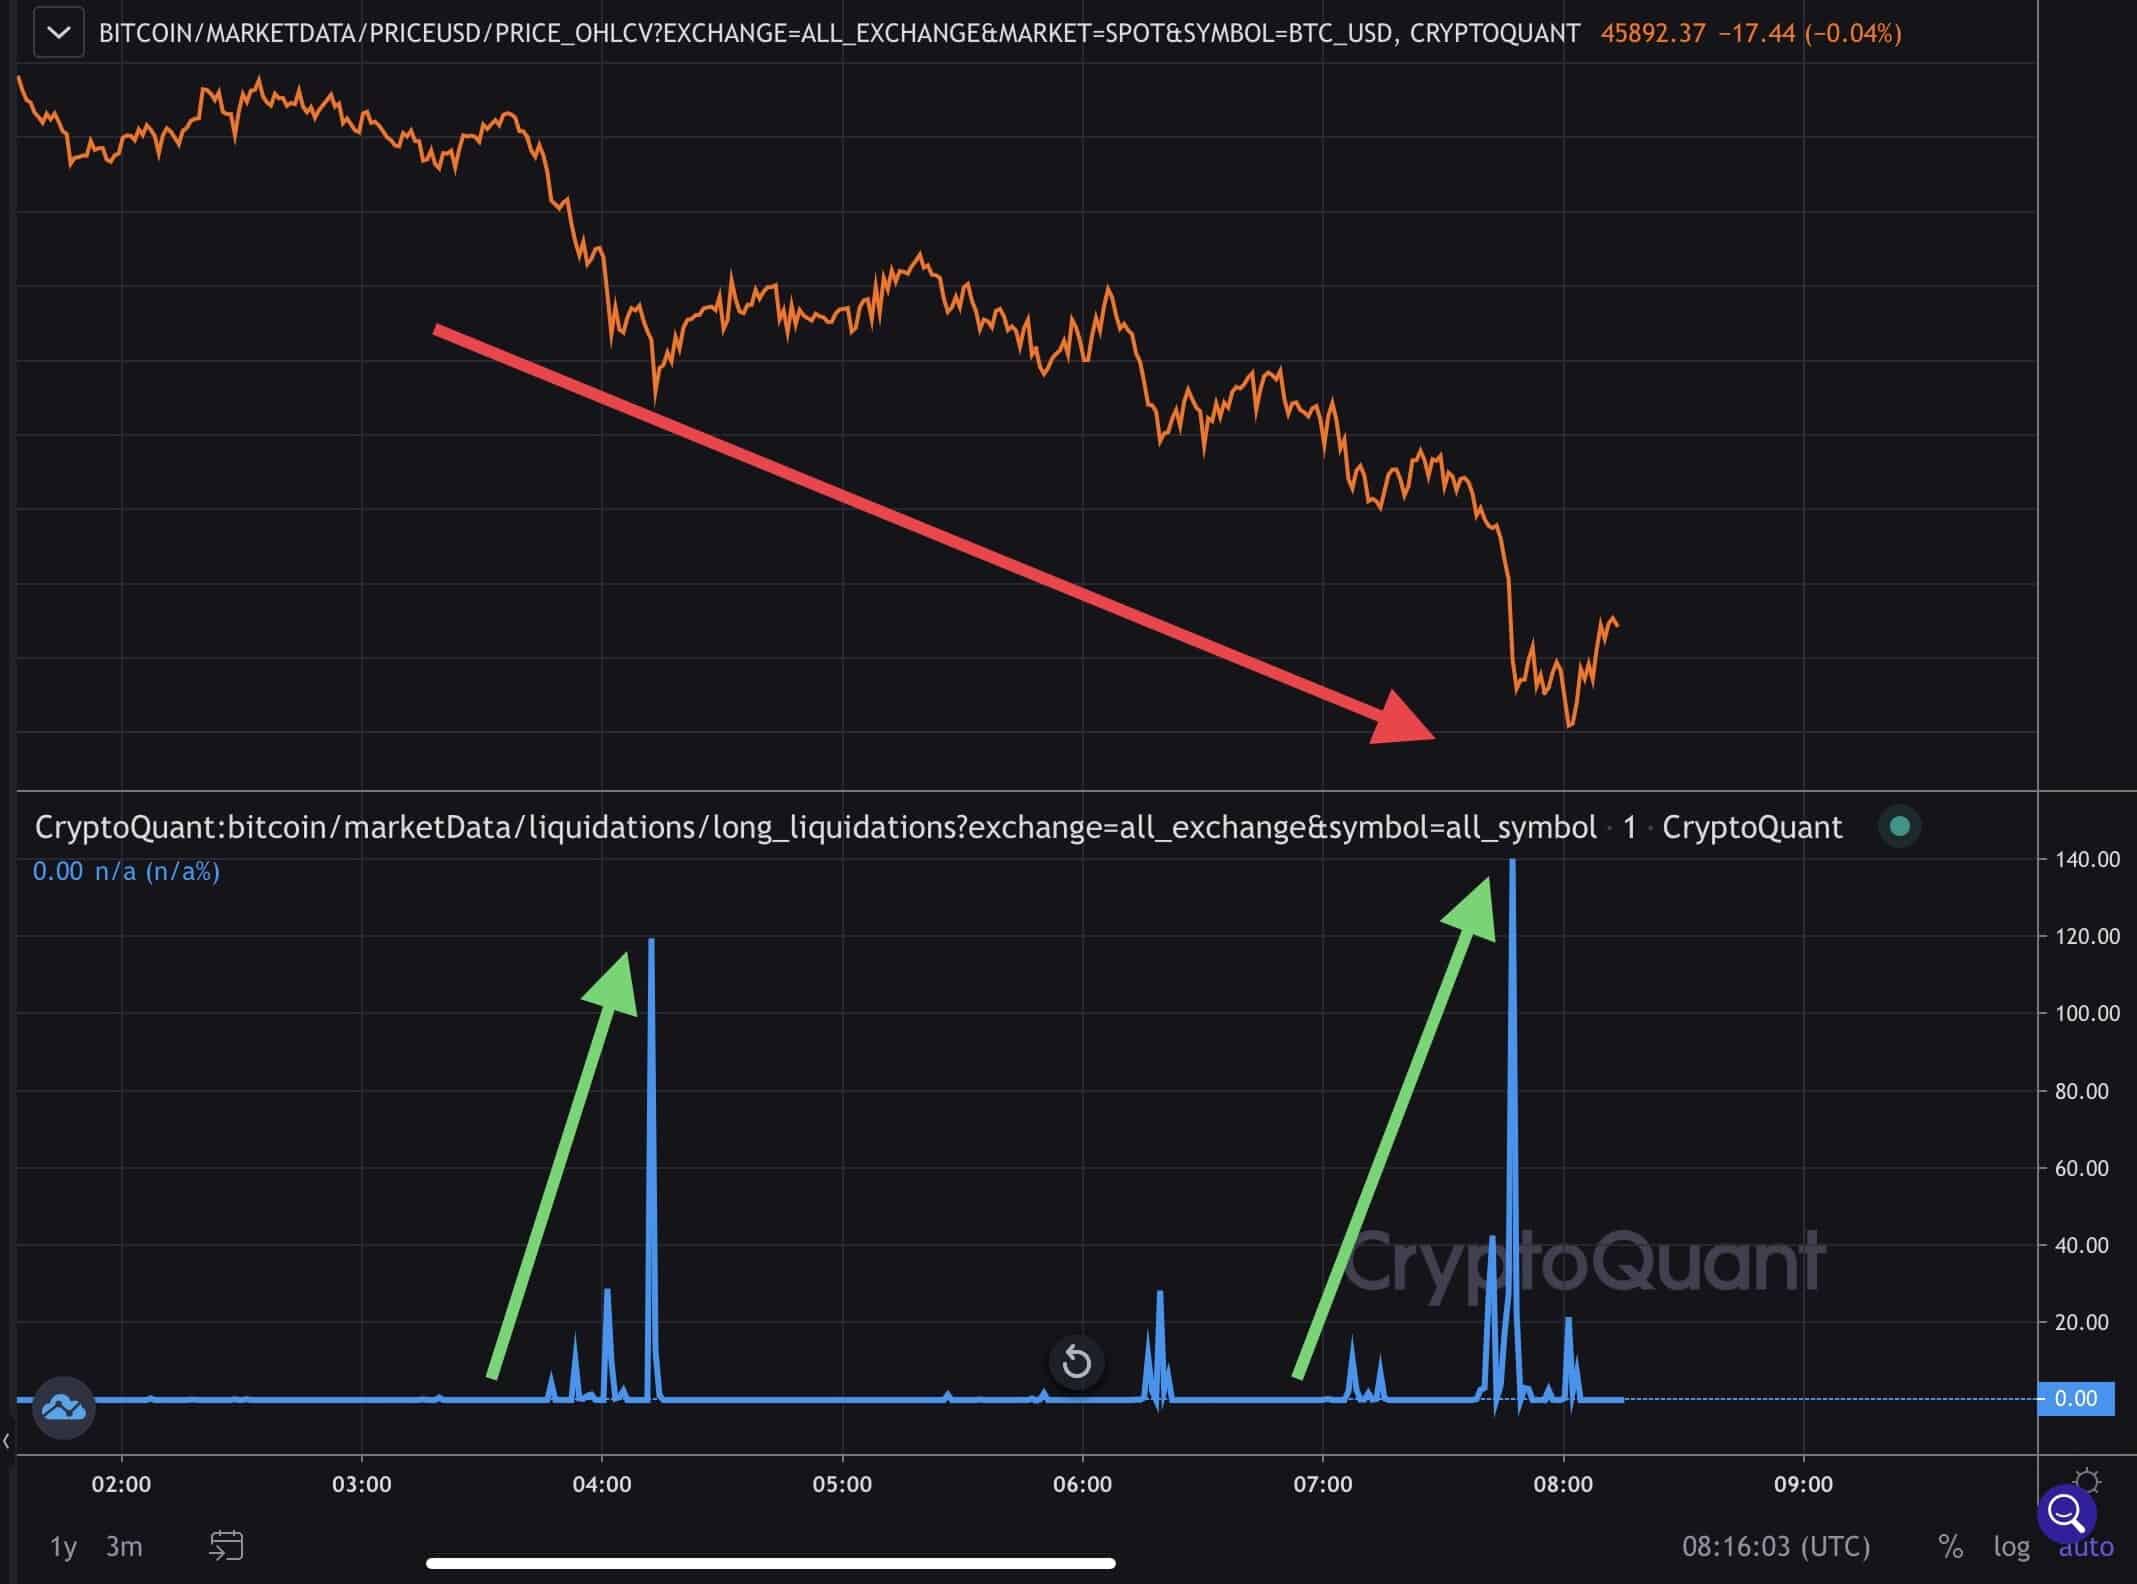
It’s important to note how low volume pullbacks signal weak selling pressure. In comparison, high volume pullbacks with closes at the day’s lows are a bearish signal, indicative of large entities selling. Low volume pullbacks tend to be related to technical selling and moderate leverage liquidation on a near-term basis.
The Importance of Volume Levels
A great example of a low volume pullback is the BTC daily close below $30k on July 20th, 2021. The selling on this particular day confirmed by on-chain analysis came from short-term holders, retail hands, traders getting liquidated and small miners.
The aggregate volume on this day was 88% lower than the selling climax when BTC hit an intraday low of $28.8k.
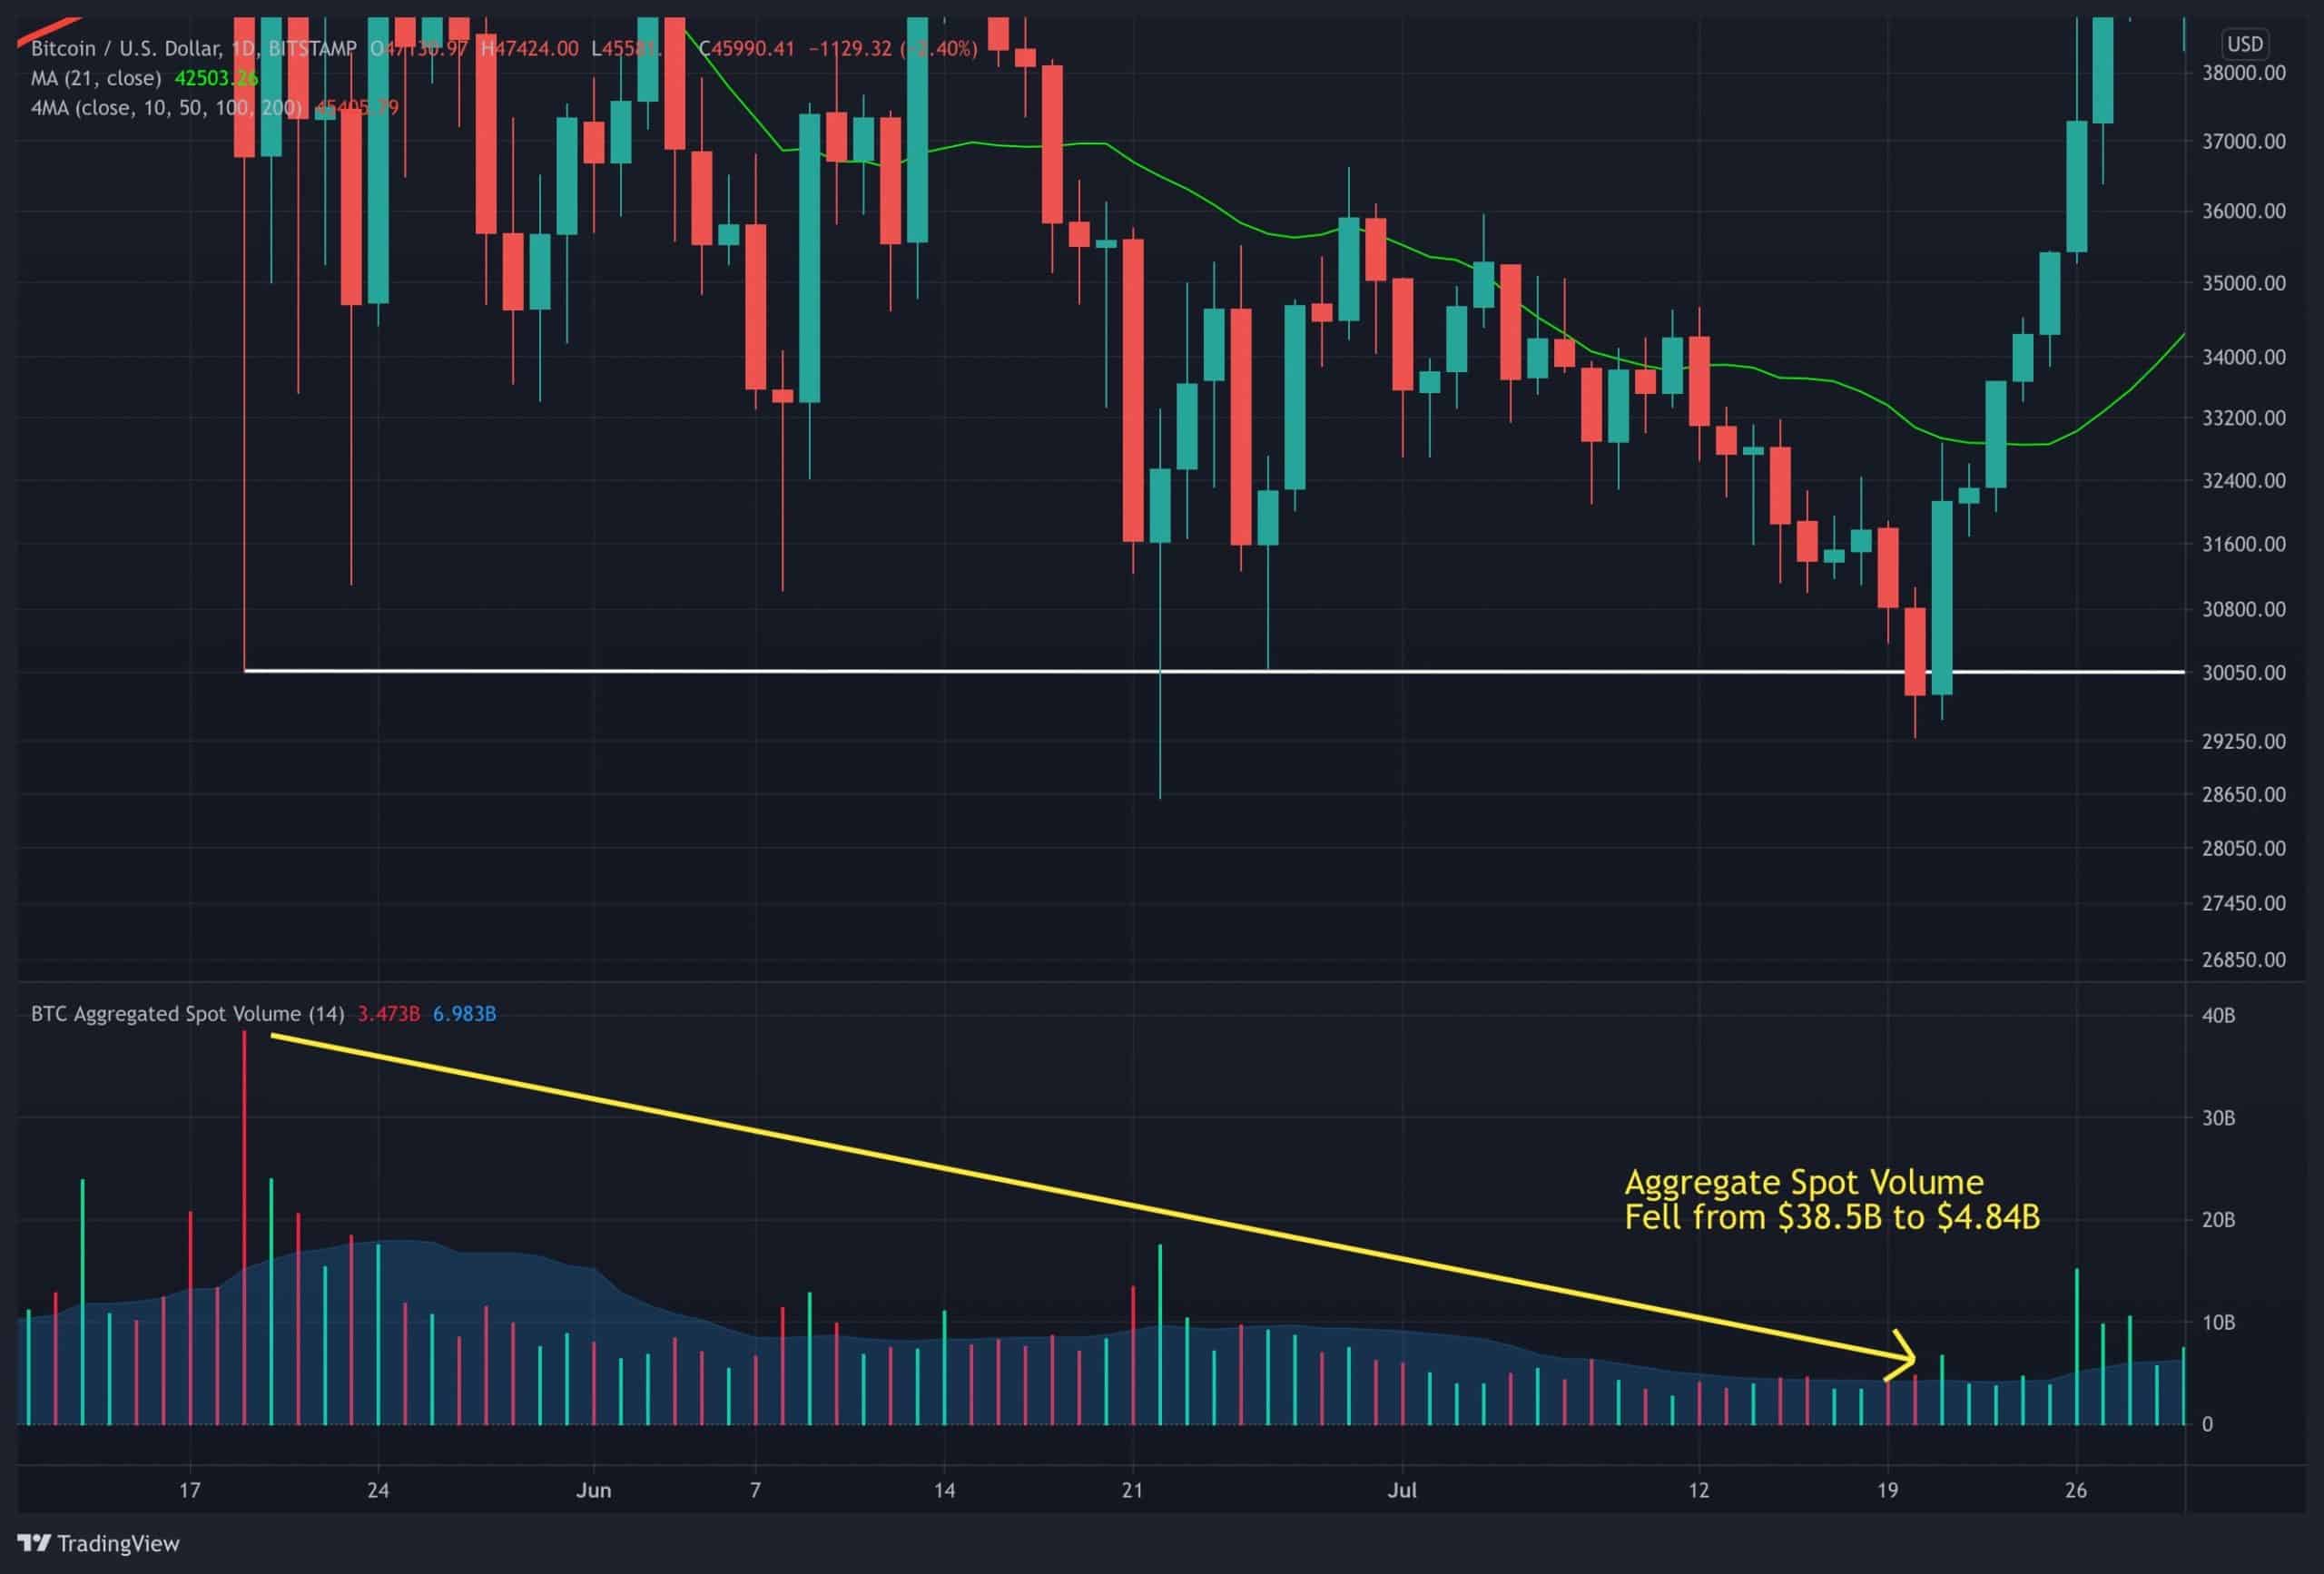
On-chain analysts argued that if long-term holders and large entities holding large amounts of illiquid supply were selling on July 20th, 2021, we would have seen tens of billions of dollars in aggregate spot volume.
Instead, aggregate spot volume was down 88%, and formed what the analysts are calling the completion of the largest “bear trap” of the current bull market. The day after, BTC printed a large bullish engulfing candle and began attempting to re-enter into bull market continuation.
This can be seen as a defining moment in BTC history as the bears were highly confident in $30k breaking, while the bulls remained steady and accumulated.
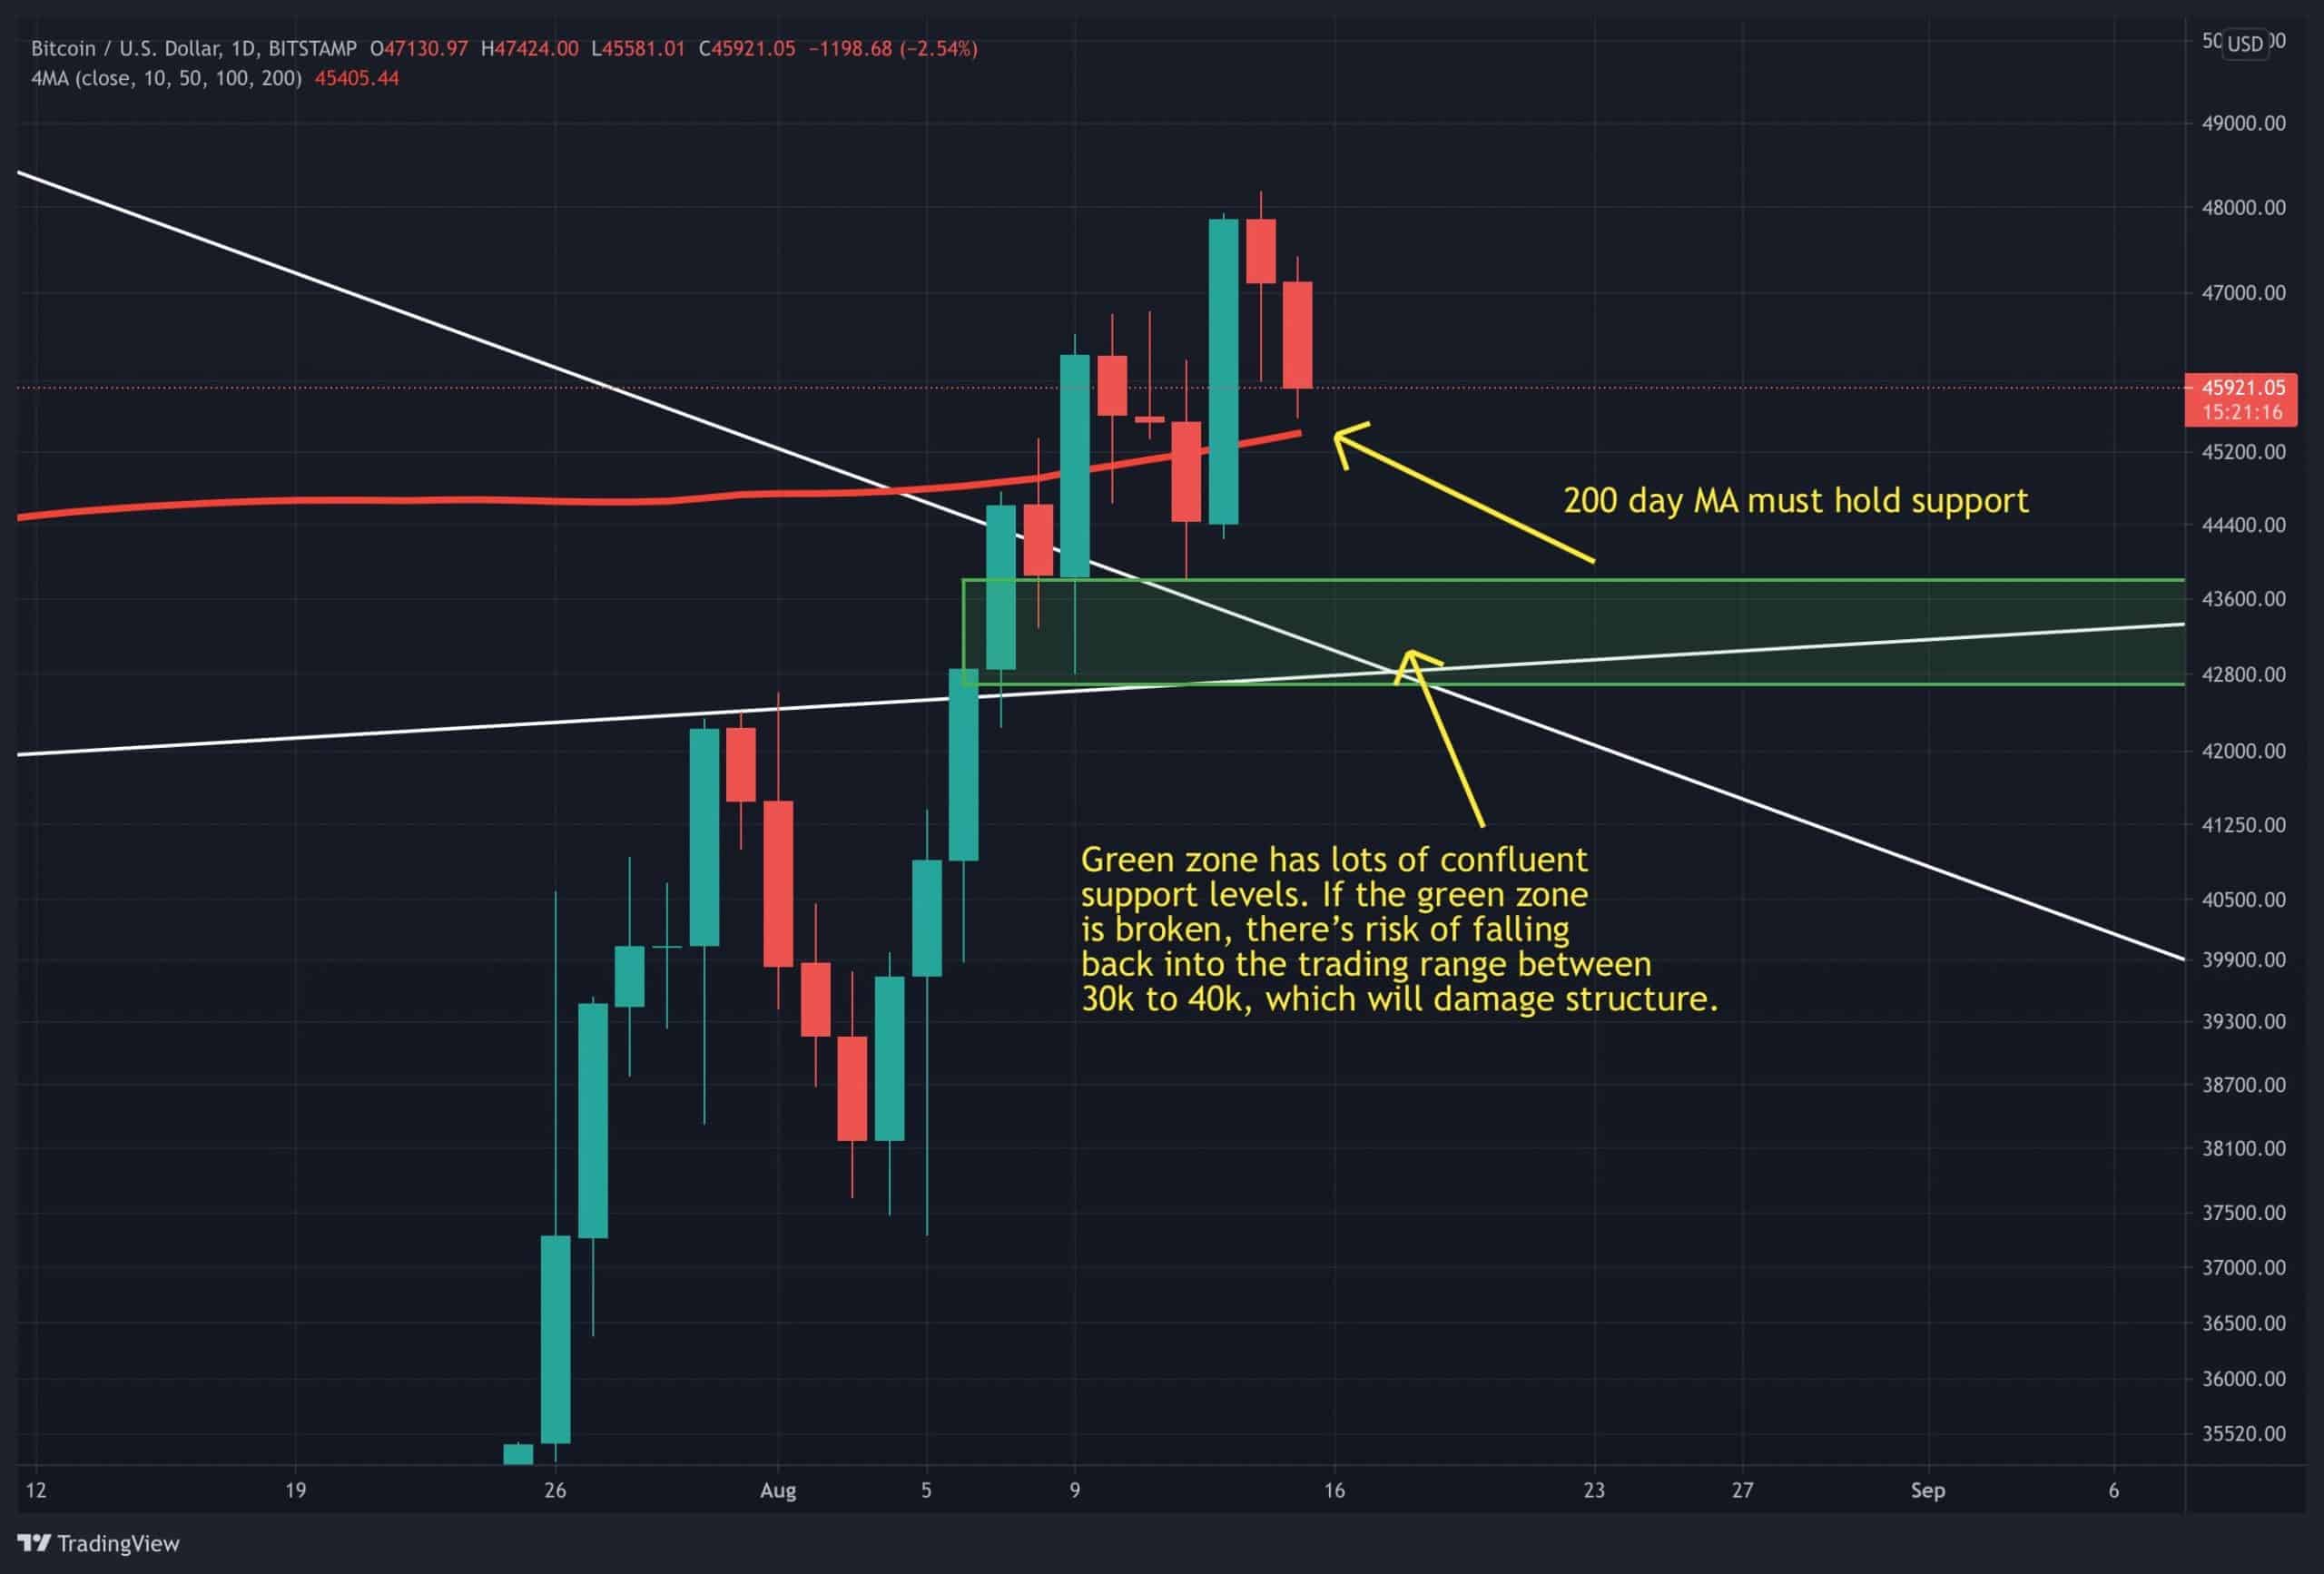
BTC bulls are now waiting for the weekly close as the most significant technical buy signal could flash if BTC closes above the 21-week moving average and 200-day moving average at $43.9k and $45.4K, respectively.
Bitcoin Price: What to Watch in the Near-Term
BTC needs to hold the 200-day moving average at $45.4K for the weekly close. If BTC falls below this key level, the next near-term zone of support is between $43.8k and $42.6k.
The structure will remain strong as long as this key zone holds and BTC pushes higher to reclaim the 200-day. If BTC falls below $42.6k, the risk of retesting the top of the trading range at $41.3k to $40.9k will increase significantly and the technical structure will weaken. Ideally, bulls should avoid this scenario and hold the 200-day moving average.
With just over half a day remaining until the weekly close, bulls and bears will continue to fight it out. The weekly close will likely determine the direction of BTC for the next few months. Strengthening fundamentals, improving momentum, and bullish on-chain metrics make the largest cryptocurrency’s mid to long-term outlook favorable.