The crypto market continues to go through a phase of uncertainty and low volatility alongside steady price action. Currently, Bitcoin is trapped in a range, and the direction it takes to break away from it would determine the cryptocurrency’s mid-term direction.
Technical Analysis
By Shayan
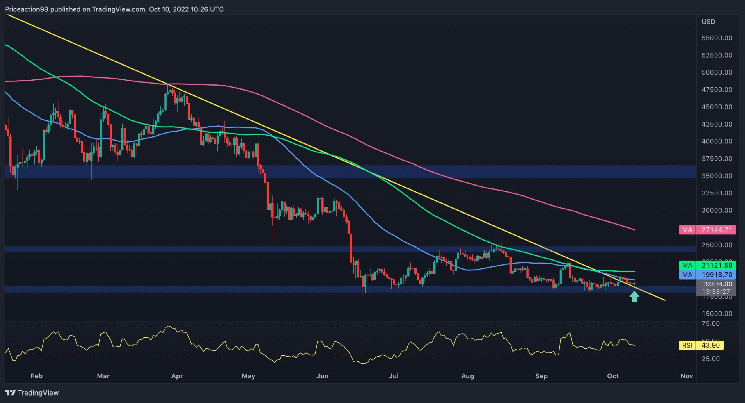
The Daily Chart
Despite the descending multi-month trendline acting as significant resistance, the price has broken through and formed a pullback. However, at this moment, the bullish momentum isn’t promising, as there is a substantial lack of demand in the market.
Alongside the declined bullish momentum, the price is facing two important resistances; the 50-day moving average at the $20K mark and the 100-day moving average at $21.1K. Bitcoin must break above these crucial resistance levels with great velocity to initiate surpassing the $25K significant sentimental resistance level.
Ultimately, regarding the market sentiment and diminished momentum, the price will most likely get rejected from these vital levels and undergo yet another drop.
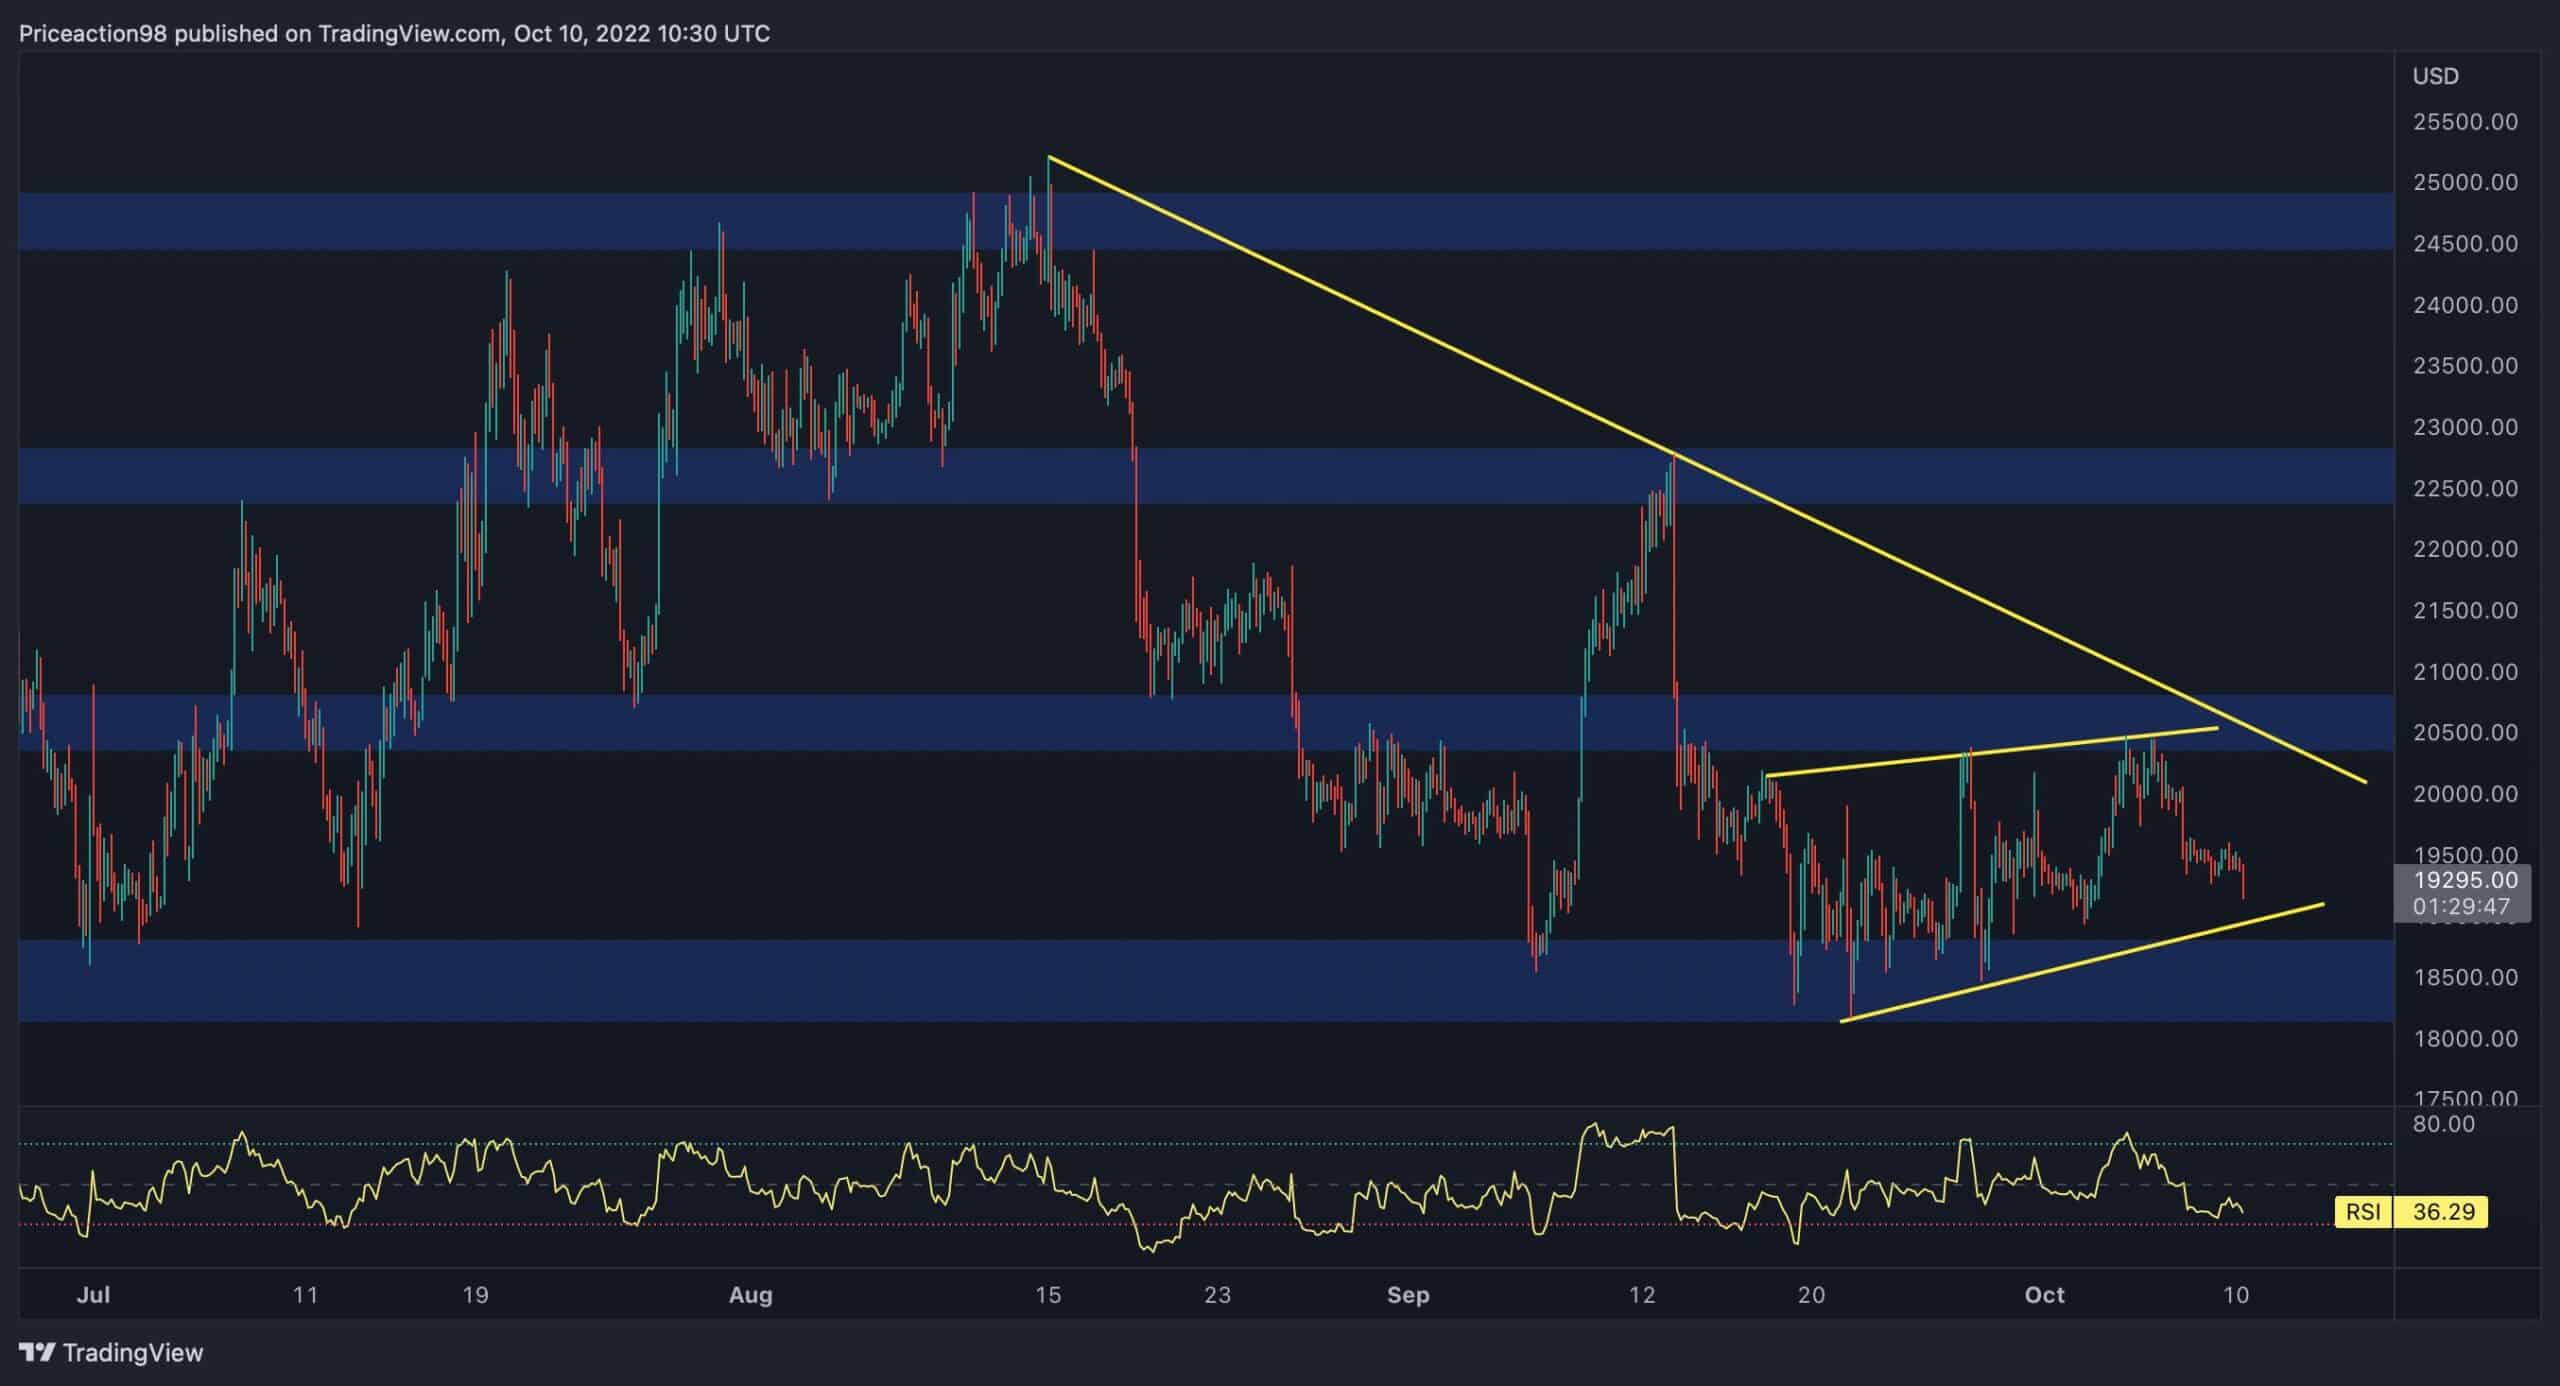
The 4-Hour Chart
In the 4-hour timeframe, the price has been stuck in a static range between the $21K level and the $18K level for quite some time now. Meanwhile, Bitcoin has been forming a bearish wedge pattern (as displayed in the chart below).
The price formed a double-top pattern, was rejected from the $20.5K resistance level, and is now testing the lower threshold of the wedge.
In the event of a decline, the market would aim for the essential $18K support level, which may be breached and fall even deeper. On the other hand, the upper edge must be broken upward to invalidate the bearish wedge.
In conclusion, the multi-week descending trendline is currently the main barrier in BTC’s path toward the $21.5K and $25K levels.
Sentiment Analysis
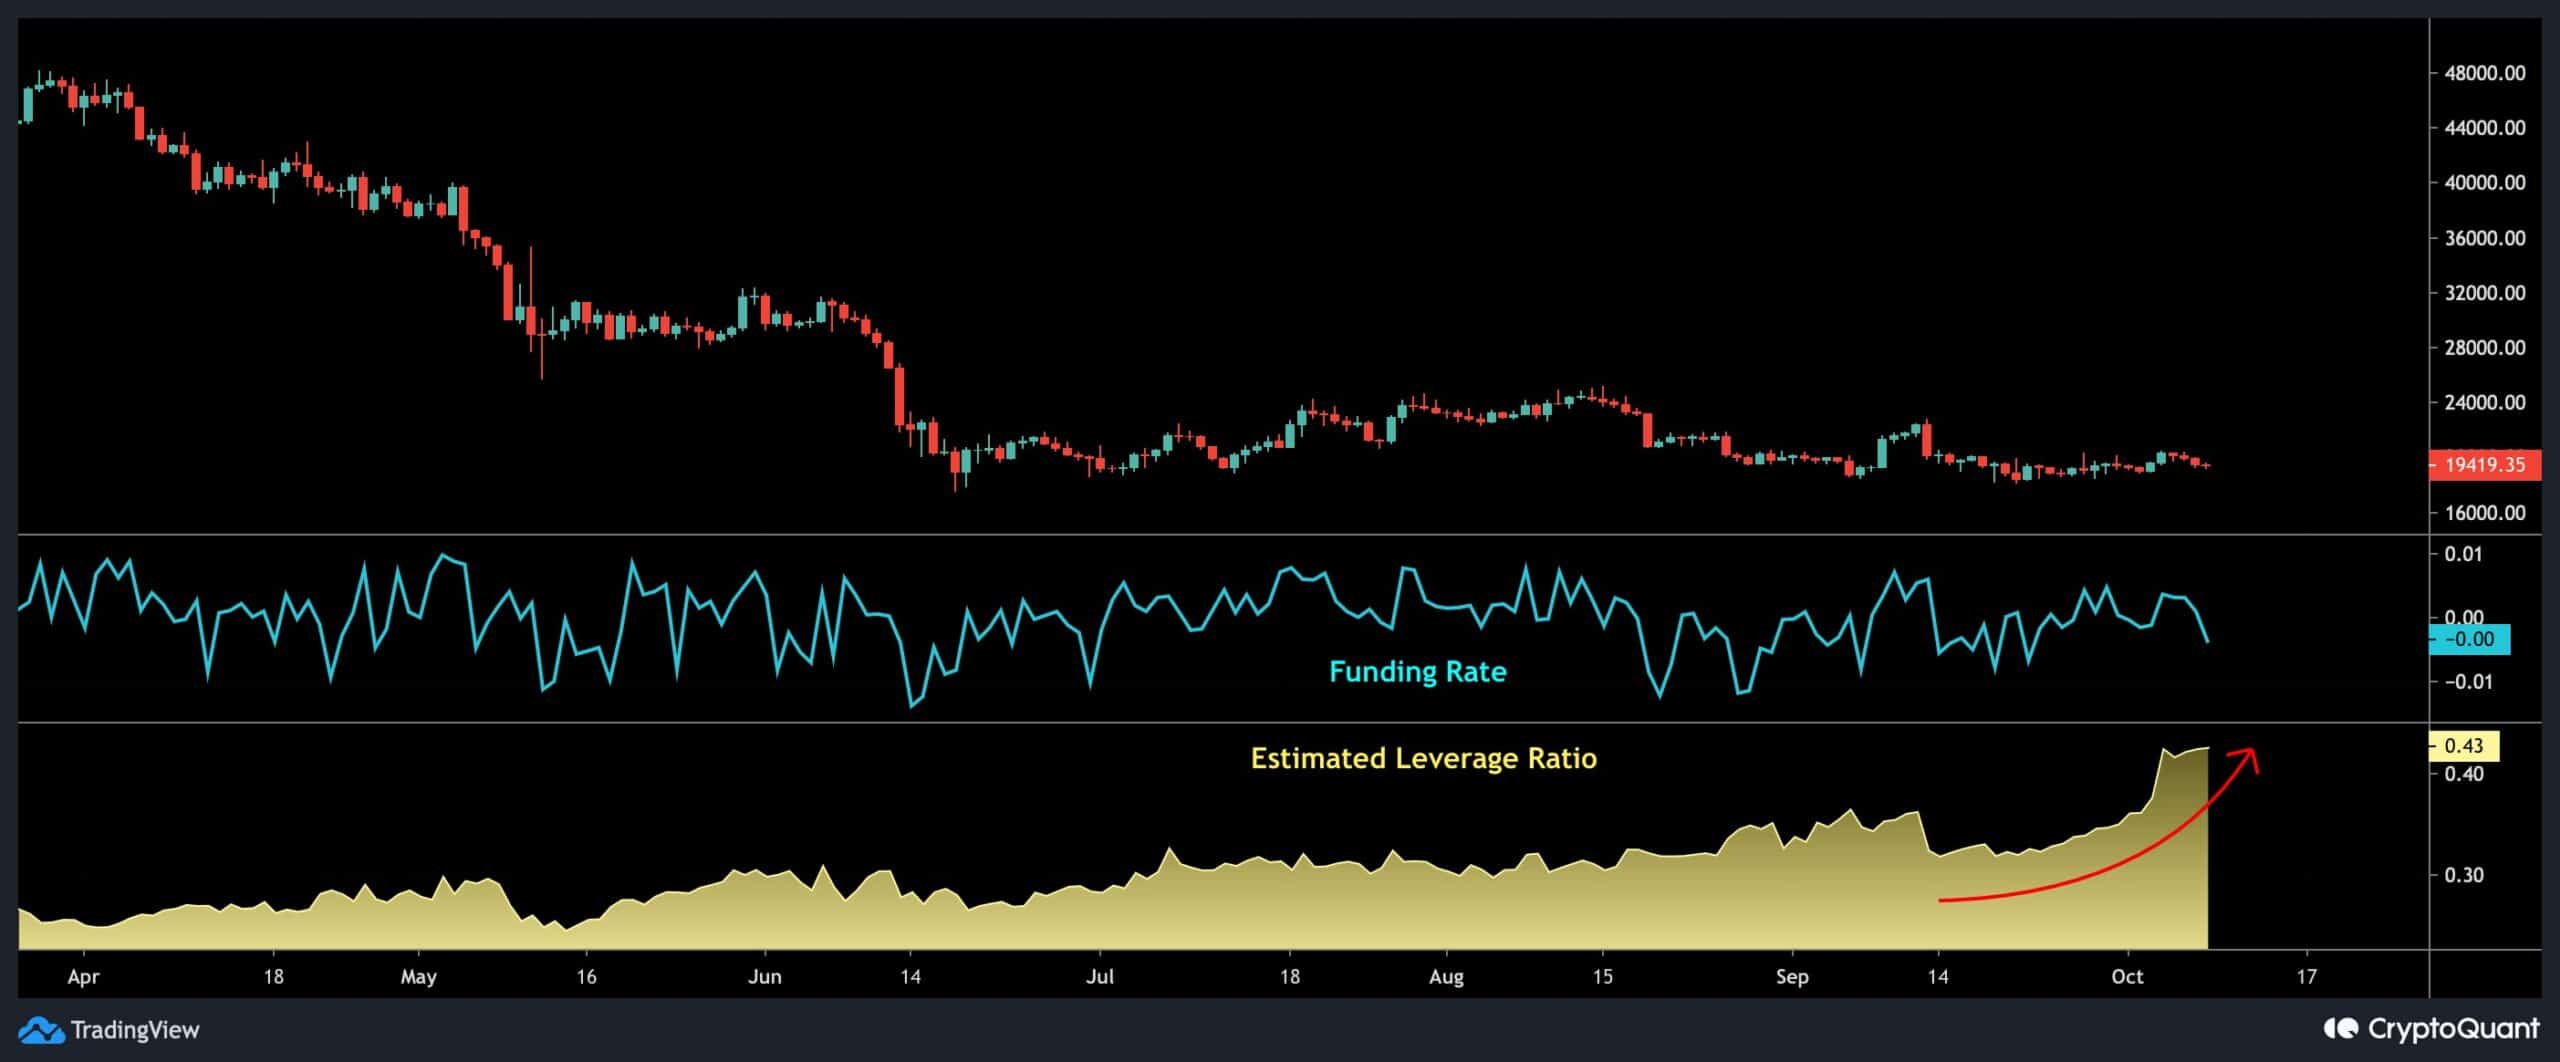
Estimated Leverage Ratio
The Exchange Netflow metric has printed a relatively higher volume of outflows from the exchanges in the last week. Although these may have been exchange-level wallet restructurings, the lack of positive sentiment caused them to extend the market activity.
The chart below illustrates the Estimated Leverage Ratio metric alongside the Funding Rate. Along with the significant outflows, the Estimated Leverage Ratio metric has also surged to an all-time high indicating that traders are using greater leverage at high risk in the futures market.
However, the absence of new retail investors demonstrates the prevalence of derivative market activity. Despite this week’s substantial exchange outflows and high leverage ratio, the relatively “neutral” funding rate appears to be why the price movement has not yet established a direction.
Hence, the market is potentially going through a prolonged range phase followed by doll price action.