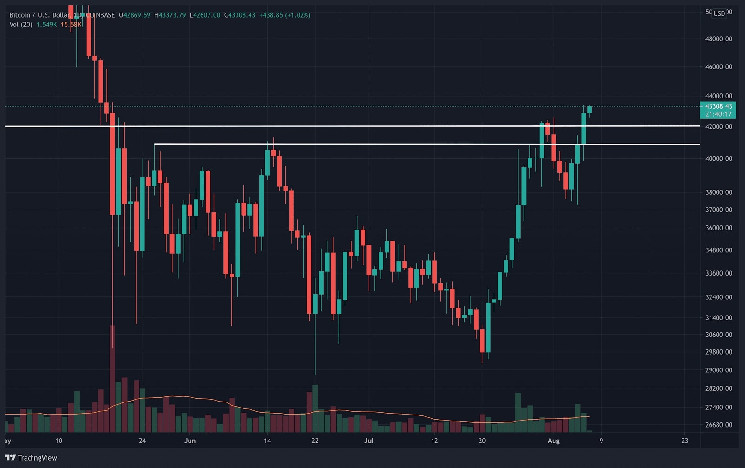
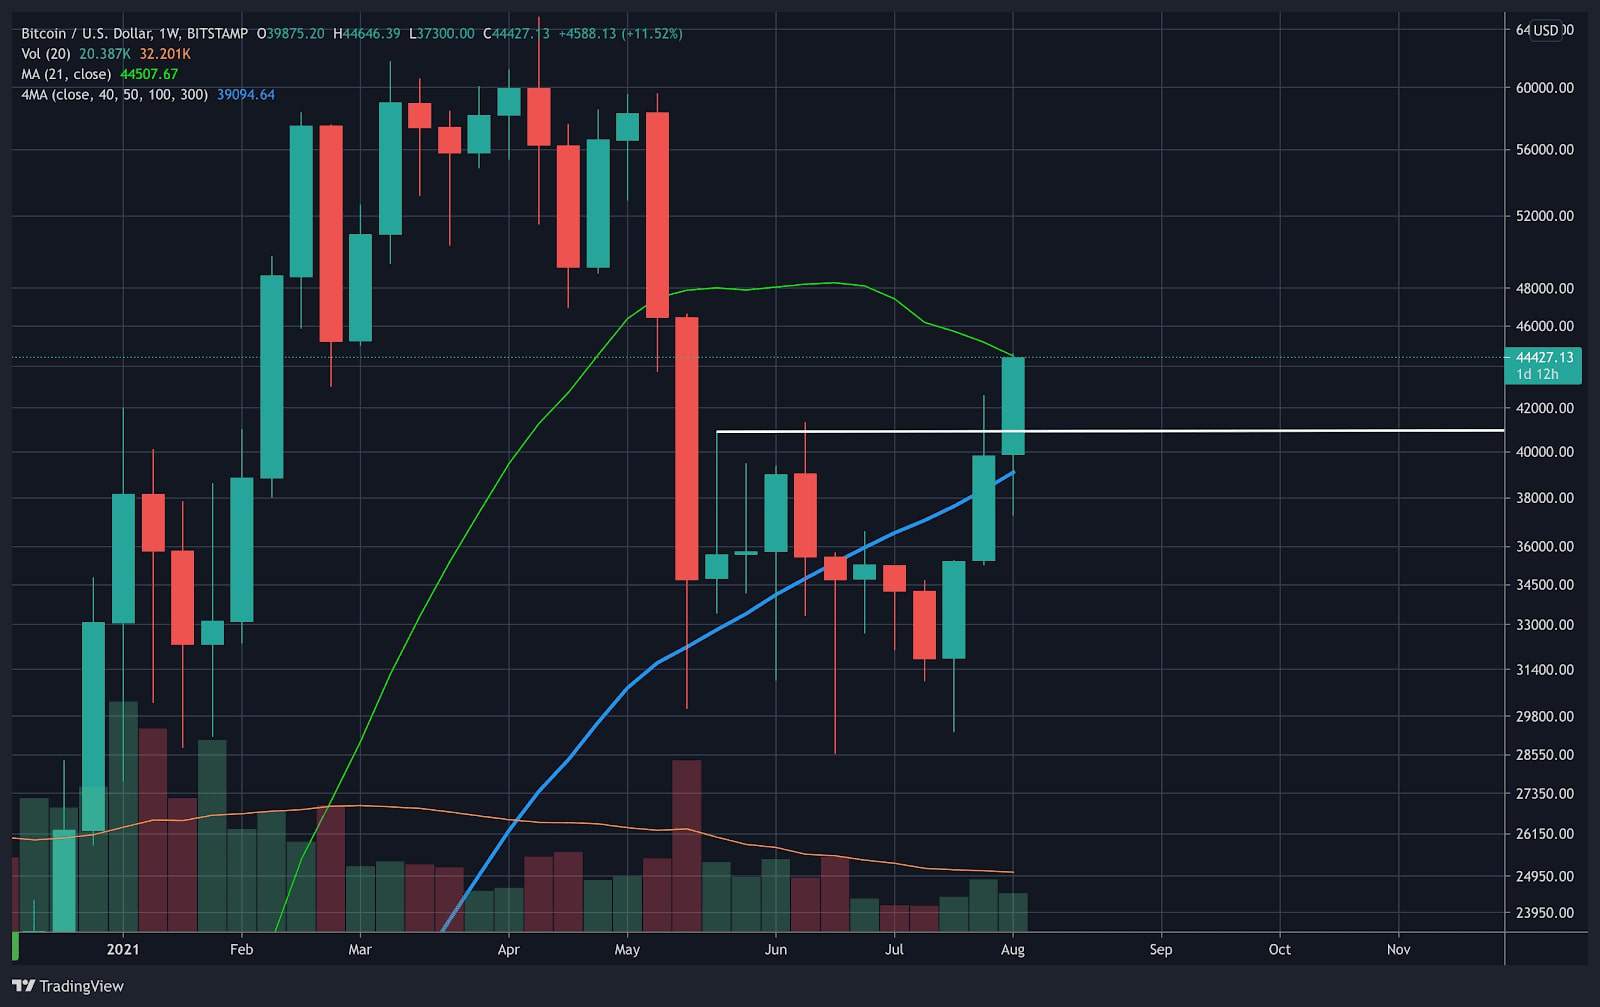
BTC made a strong daily close above the 3-month long trading range, confirming the first major step of a higher breakout. The largest cryptocurrency closed at $42.8k, blasting above the top of the trading range at $41.3k and the near-term high at $42.6k.
Near-Term Caution For Bitcoin’s Price
So far today, BTC continued to push higher even with weekend trading hours, reaching an intraday high of $44k before cooling off.
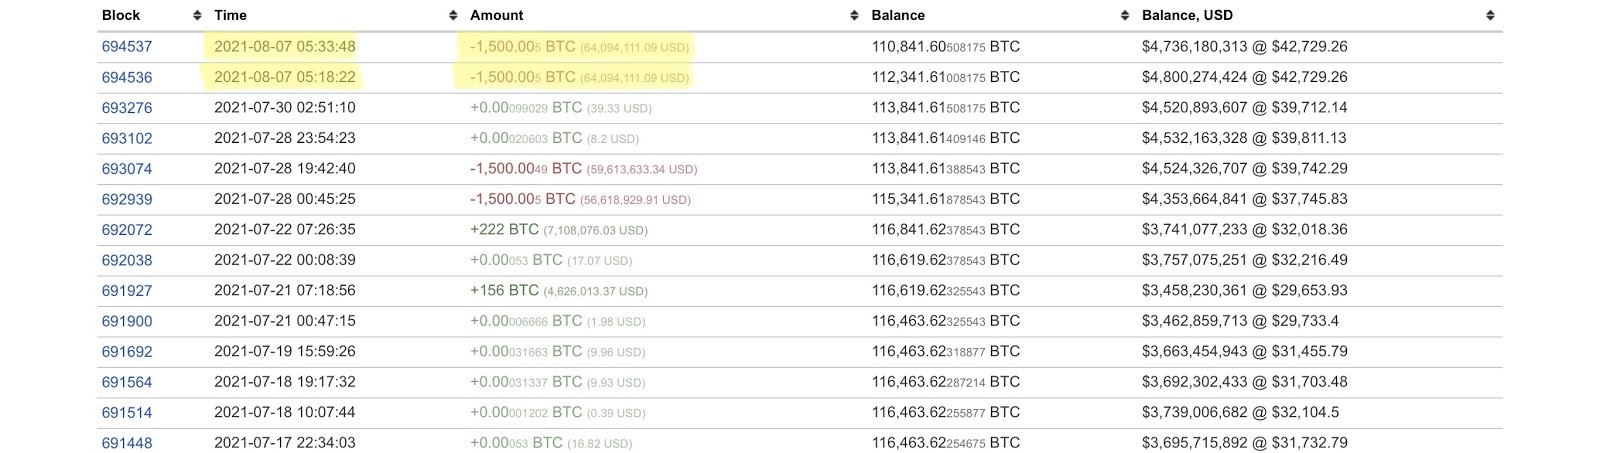
On Friday, the third-largest whale wallet we have been tracking transferred 3000 BTC into Coinbase, signaling near-term caution.
If the whale entity transfers BTC to Coinbase, and specific on-chain metrics and technical indicators are all flashing sell signals, the probability of a local top will increase.
Signals to Look Out For
To reiterate, here are the on-chain sell signals we found that matched the 4 previous whale entity BTC transfers.
- Exchange reserves trending higher
- Net exchange flow trending higher
- Funding rate trending higher
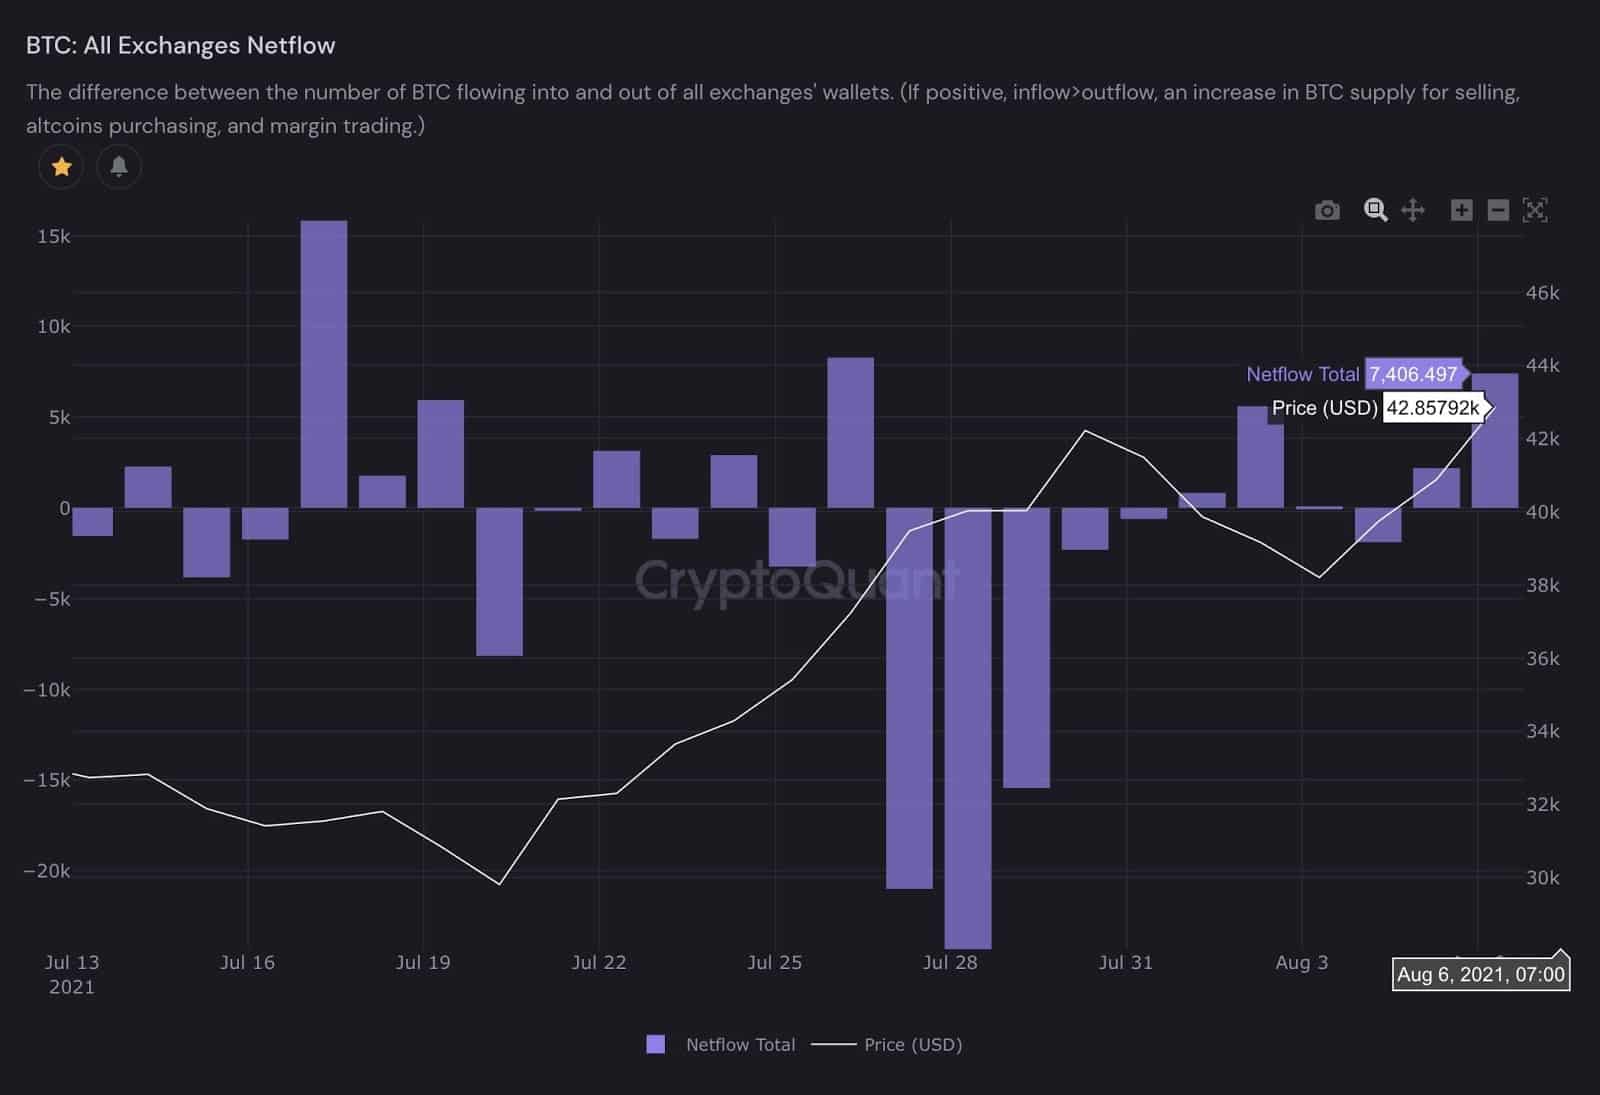
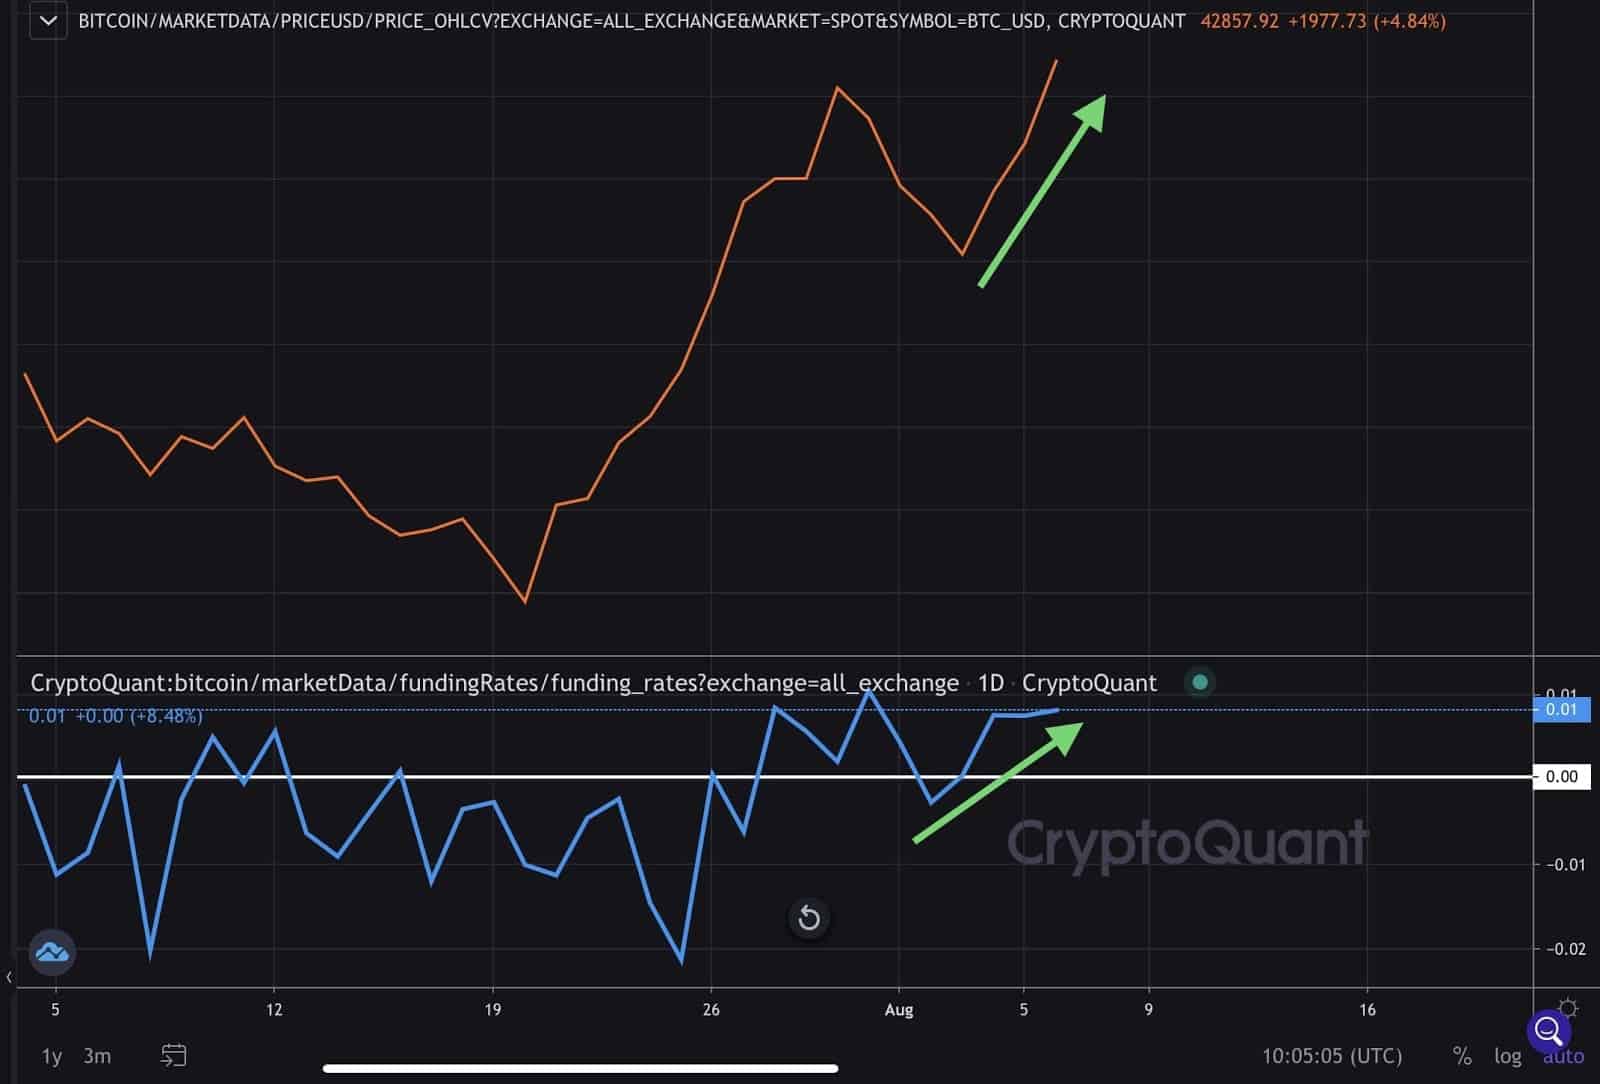
In the past few days, all three metrics have been trending higher, signaling near-term caution. Here are the technical sell signals that flashed during the previous whale entity BTC transfers
- Stochastic relative strength index peaking
- 4-hour sequential flashing 9th candle or higher
- 4-hour relative strength index overbought
- 4-hour trading at upper Bollinger band
- Daily trading at upper Bollinger band
Technical BTC Sell Signals That Flashed
Stochastic relative strength index peaking, 4-hour relative strength index overbought, 4 hour trading at the top of upper Bollinger band,
Technical BTC Sell Signals not Flashing
The 4-hour sequential flashing 9th candle or higher and daily chart trading at upper Bollinger band.
At the moment, 3 out of 5 technical sell signals flashed, which actually signals more room for potential near-term upside on the daily chart. Given the previous 4 local tops that the whale entity timed perfectly and had all on-chain and technical sell signals flashing, the risk is not as high as it appears for now. Of course, the whale entity sending 3000 BTC to Coinbase is not the best news to hear, but it does not mean BTC will crash.
The timing of this transfer is questionable as BTC just recently made the first daily close above the top of the trading range – a very bullish technical signal.
One possible reason the whale entity is looking to sell could be to break even or realize a small profit on the BTC acquired in late May when BTC was at 41.7k to 44.7k. The whale acquired 4148 BTC between 41.7k to 44.7k and transferred 3000 BTC as BTC pushed above 42k. The previous sale was also similar in the amount of BTC sold at the upper $30k range, possibly to break even or realize a small profit.
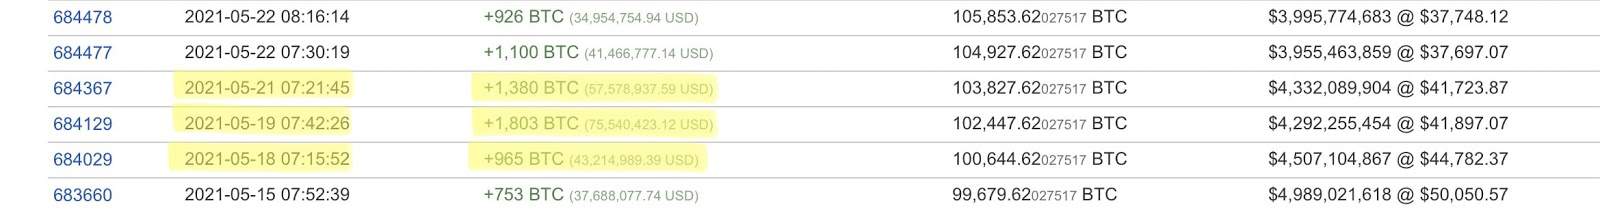
Previous selling activity has mostly occurred after BTC staged massive rallies. The whale entity usually sells up to 10% of its total BTC holdings and re-enters the market on pullbacks. The total BTC holdings had been rising through the whale entity’s initial BTC purchase back in 2019. As of now, it has sold 6,000 BTC, a reduction of just over 5% of total BTC holdings. Overall, the entity still holds 94.8% of its total BTC holdings.
It would be alarming to see it sell more than 10% of its total BTC holdings, especially if BTC starts attempting to reclaim major resistance at the 200-day moving average and the 21-week moving average.
BTC Structure, Technicals, and Momentum Showing Strength
Aside from this questionably timed BTC inflow into Coinbase, it is important to note the strength we have been seeing in BTC structure, technicals, and momentum.
BTC appears to have exited Phase C in the Wyckoff Accumulation, a widely followed technical accumulation phase, and is now entering Phase D. It consists of a strong rally higher, usually above an extended trading range. Price usually consolidates above the trading range, shaking out any remaining supply on the market. Eventually, large operators determine price is ready for mark-up, and a significantly large rally starts.
The recent strength in the last few weeks has improved BTC’s technical momentum. The 4-hour, daily, and 3-day charts continue to trend higher, with the momentum pushing well above neutral. If BTC can hold the recent gains and follow-through, this should push the 3-day momentum above neutral in the next 1 to 2 weeks, flashing a very large buy signal.
BTC is getting closer to testing the 2 most critical levels of resistance; the 200-day moving average and the 21-week moving average. It is important to keep track of the on-chain metrics whenever BTC tests major resistance. Bulls need to make sure long-term holders and other large entities holding illiquid supply are not selling aggressively when BTC is testing these levels.
With bitcoin’s price making higher highs, higher lows, successfully exiting Phase C in Wyckoff Accumulation, momentum trending higher, and aggregate on-chain data in the last 3 months showing strong accumulation with long-term holders refusing to sell, the current conditions look very favorable for a BTC breakout.