Key highlights:
- BTC is down by a small 4.5% today as the cryptocurrency slips beneath $40K again
- The cryptocurrency reached a two-month high over the weekend as it hit $42,560
- Since reaching this high, the coin has rolled over to break beneath the ascending price channel it was trading inside
| Bitcoin price | $39,300 |
|---|---|
| Key BTC resistance levels | $40,000, $40,560, $41,000, $42,000, $42,560 |
| Key BTC support levels | $39,450, $38,000, $37,500, $37,000, $36,660 |
*Price at the time of publication
Bitcoin rolled over by 4.5% today as the cryptocurrency falls beneath an ascending price channel it was trading inside and broke beneath the $40K level. Despite today’s price drop, BTC is still up by a whopping 13% over the past month of trading. It had managed to reach a fresh two-month high price over the weekend as the coin reached as high as $42,650.
The price drop seems to have been sparked by unclear terms in the new US $550 billion infrastructure bill, announced toward the end of July:
1/ ? Here's the deal with the US infrastructure bill:
— Jake Chervinsky (@jchervinsky) July 30, 2021
A new provision has been added that expands the Tax Code's definition of "broker" to capture nearly everyone in crypto, including non-custodial actors like miners, forcing them all to KYC users.
This is not a drill ?
According to one specific clause in the bill, it seeks to generate around $28 billion from taxing cryptocurrency users. However, the problem is that the wording is very general and requires entities such as DeFi Protocols and CeFi exchanges to file customer forms with the IRS.
This is quite alarming for cryptocurrency users as it suggests that the US Government can come in and tax holders whenever they wish to do so. The bill is still yet to pass through congress, and figureheads within the industry are doing their best to make sure that it does not go through.
In other news, Saudi Aramco released a statement today to clear up any rumors regarding the company entering the Bitcoin mining space. The report confirmed that the claims are “completely false and inaccurate,” dampening the bullish sentiment around Bitcoin.
Lastly, it seems that South Korea might be having a cryptocurrency crackdown after the Financial Services Commission shut down around 12 mid-tier exchanges amidst fraud allegations.
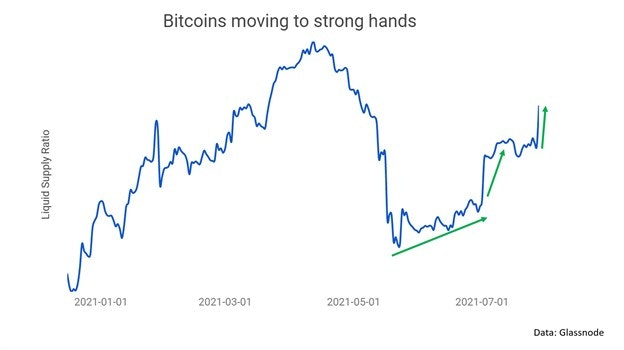
Moving onto some on-chain metrics, it seems that bitcoin continues to move into strong hands. Using the liquid supply ratio from William Clemente, it shows that the supply shock is at levels that previously priced BTC near the ATH.
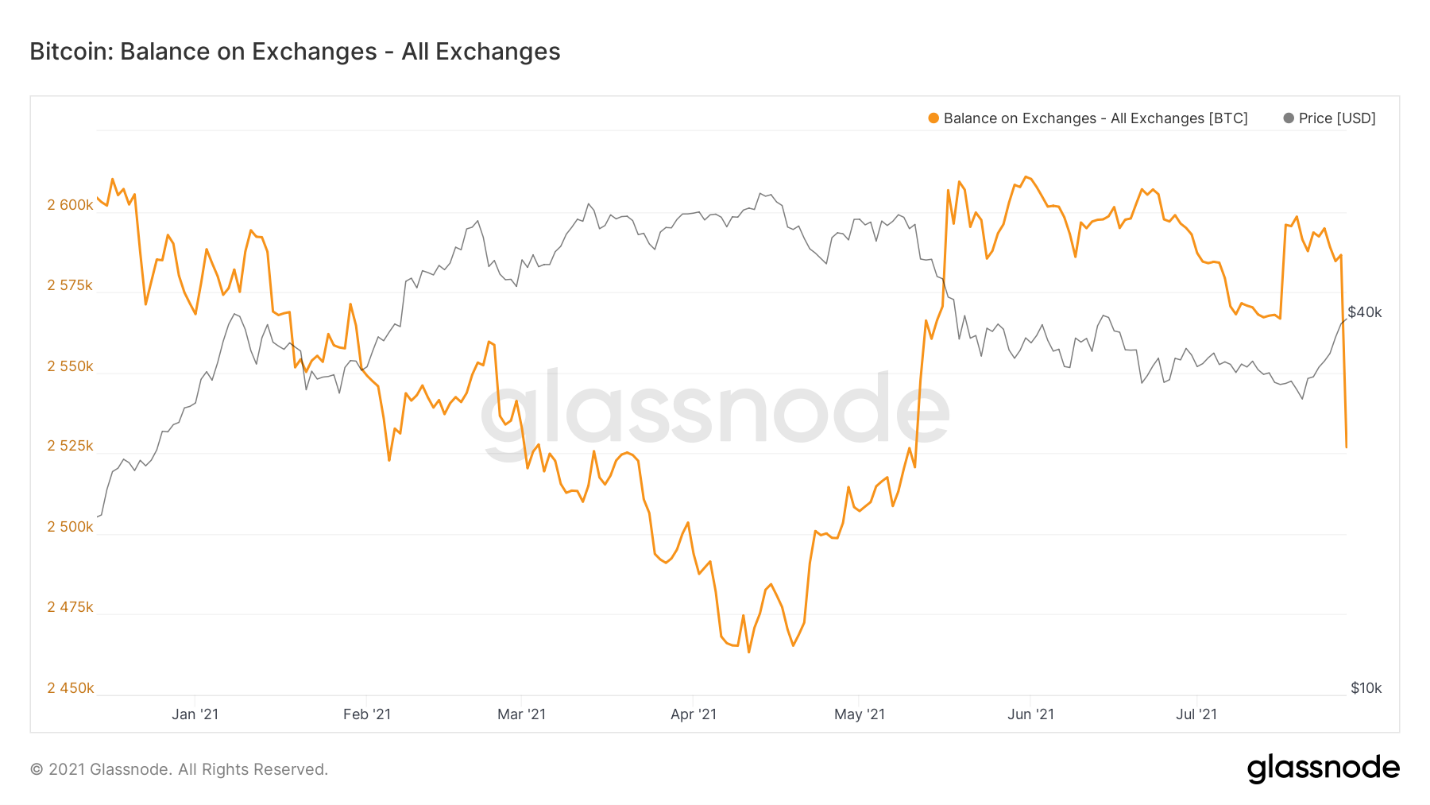
In addition to this, the total number of Bitcoin of all exchanges continues to drop, indicating that investors are continuing to accumulate in recent weeks as they remove their assets from the exchanges:
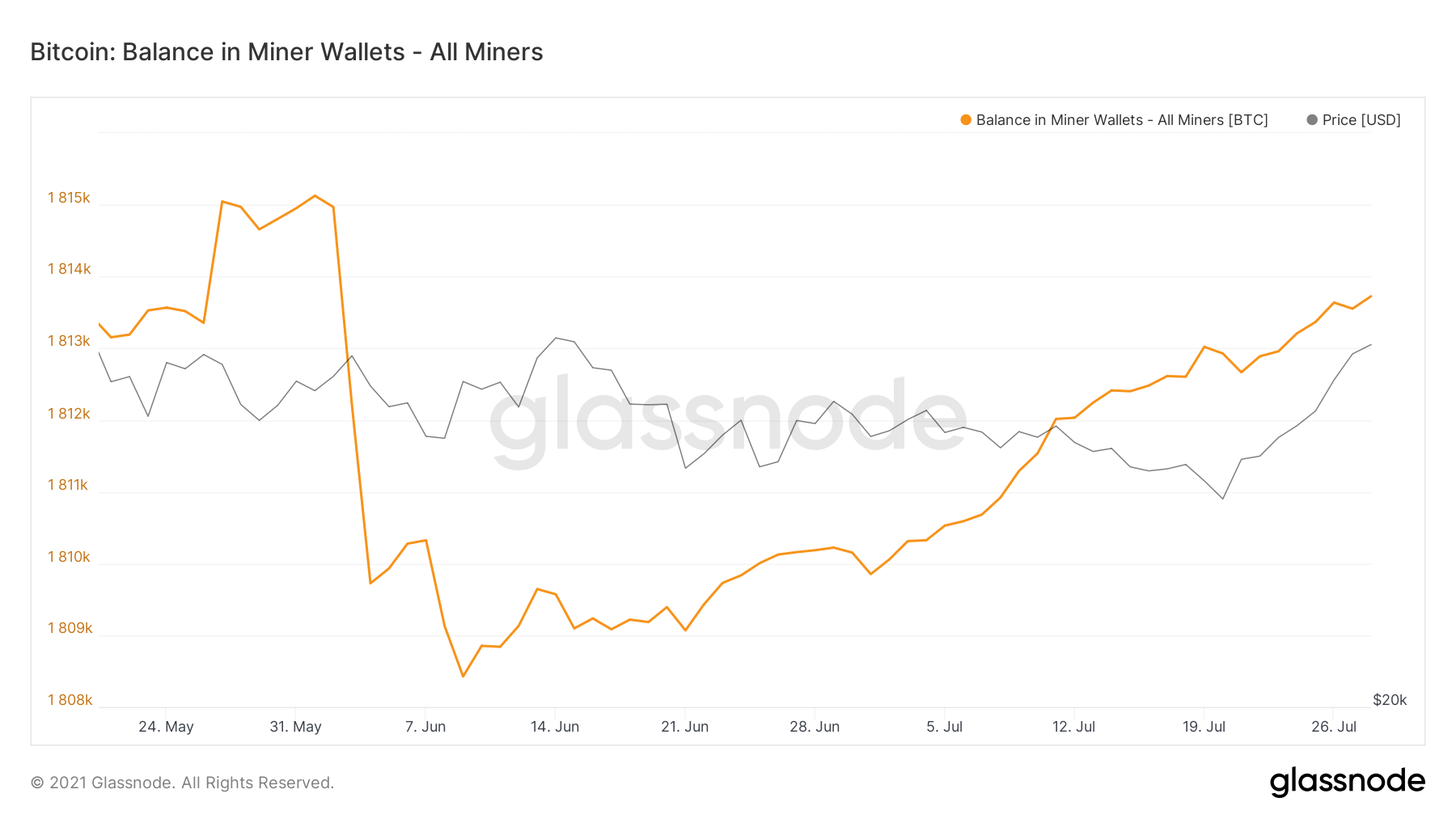
Furthermore, it seems that miners continue their heavy accumulation that was established during the first week of June. As mentioned in previous articles, the hash rate dived over the past two months during the Chinese mining crackdown. As a result, BTC miners were earning more BTC with the same hardware as the difficulty to mine dropped. It seems that these miners are happy to hold onto their BTC and might be optimistic about the future price for BTC:
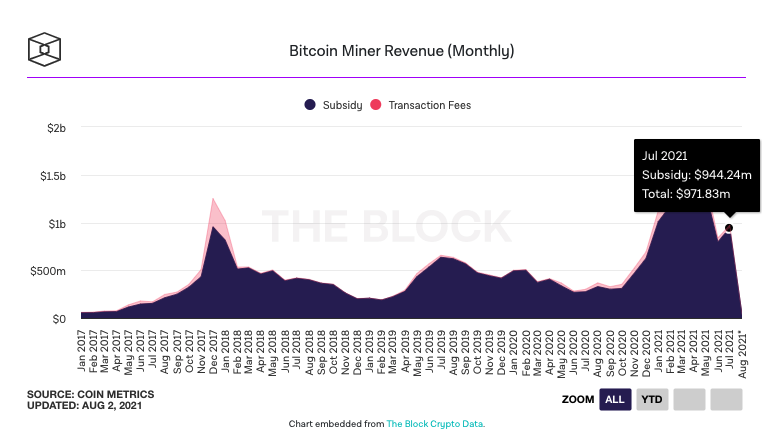
Speaking of miners, data from the Block Research shows that they earned just over $970 million in mining revenue during July, with transaction fees bringing in $27.6 million:
BTC now holds a total market cap value of around $742.5 billion.
Bitcoin price analysis
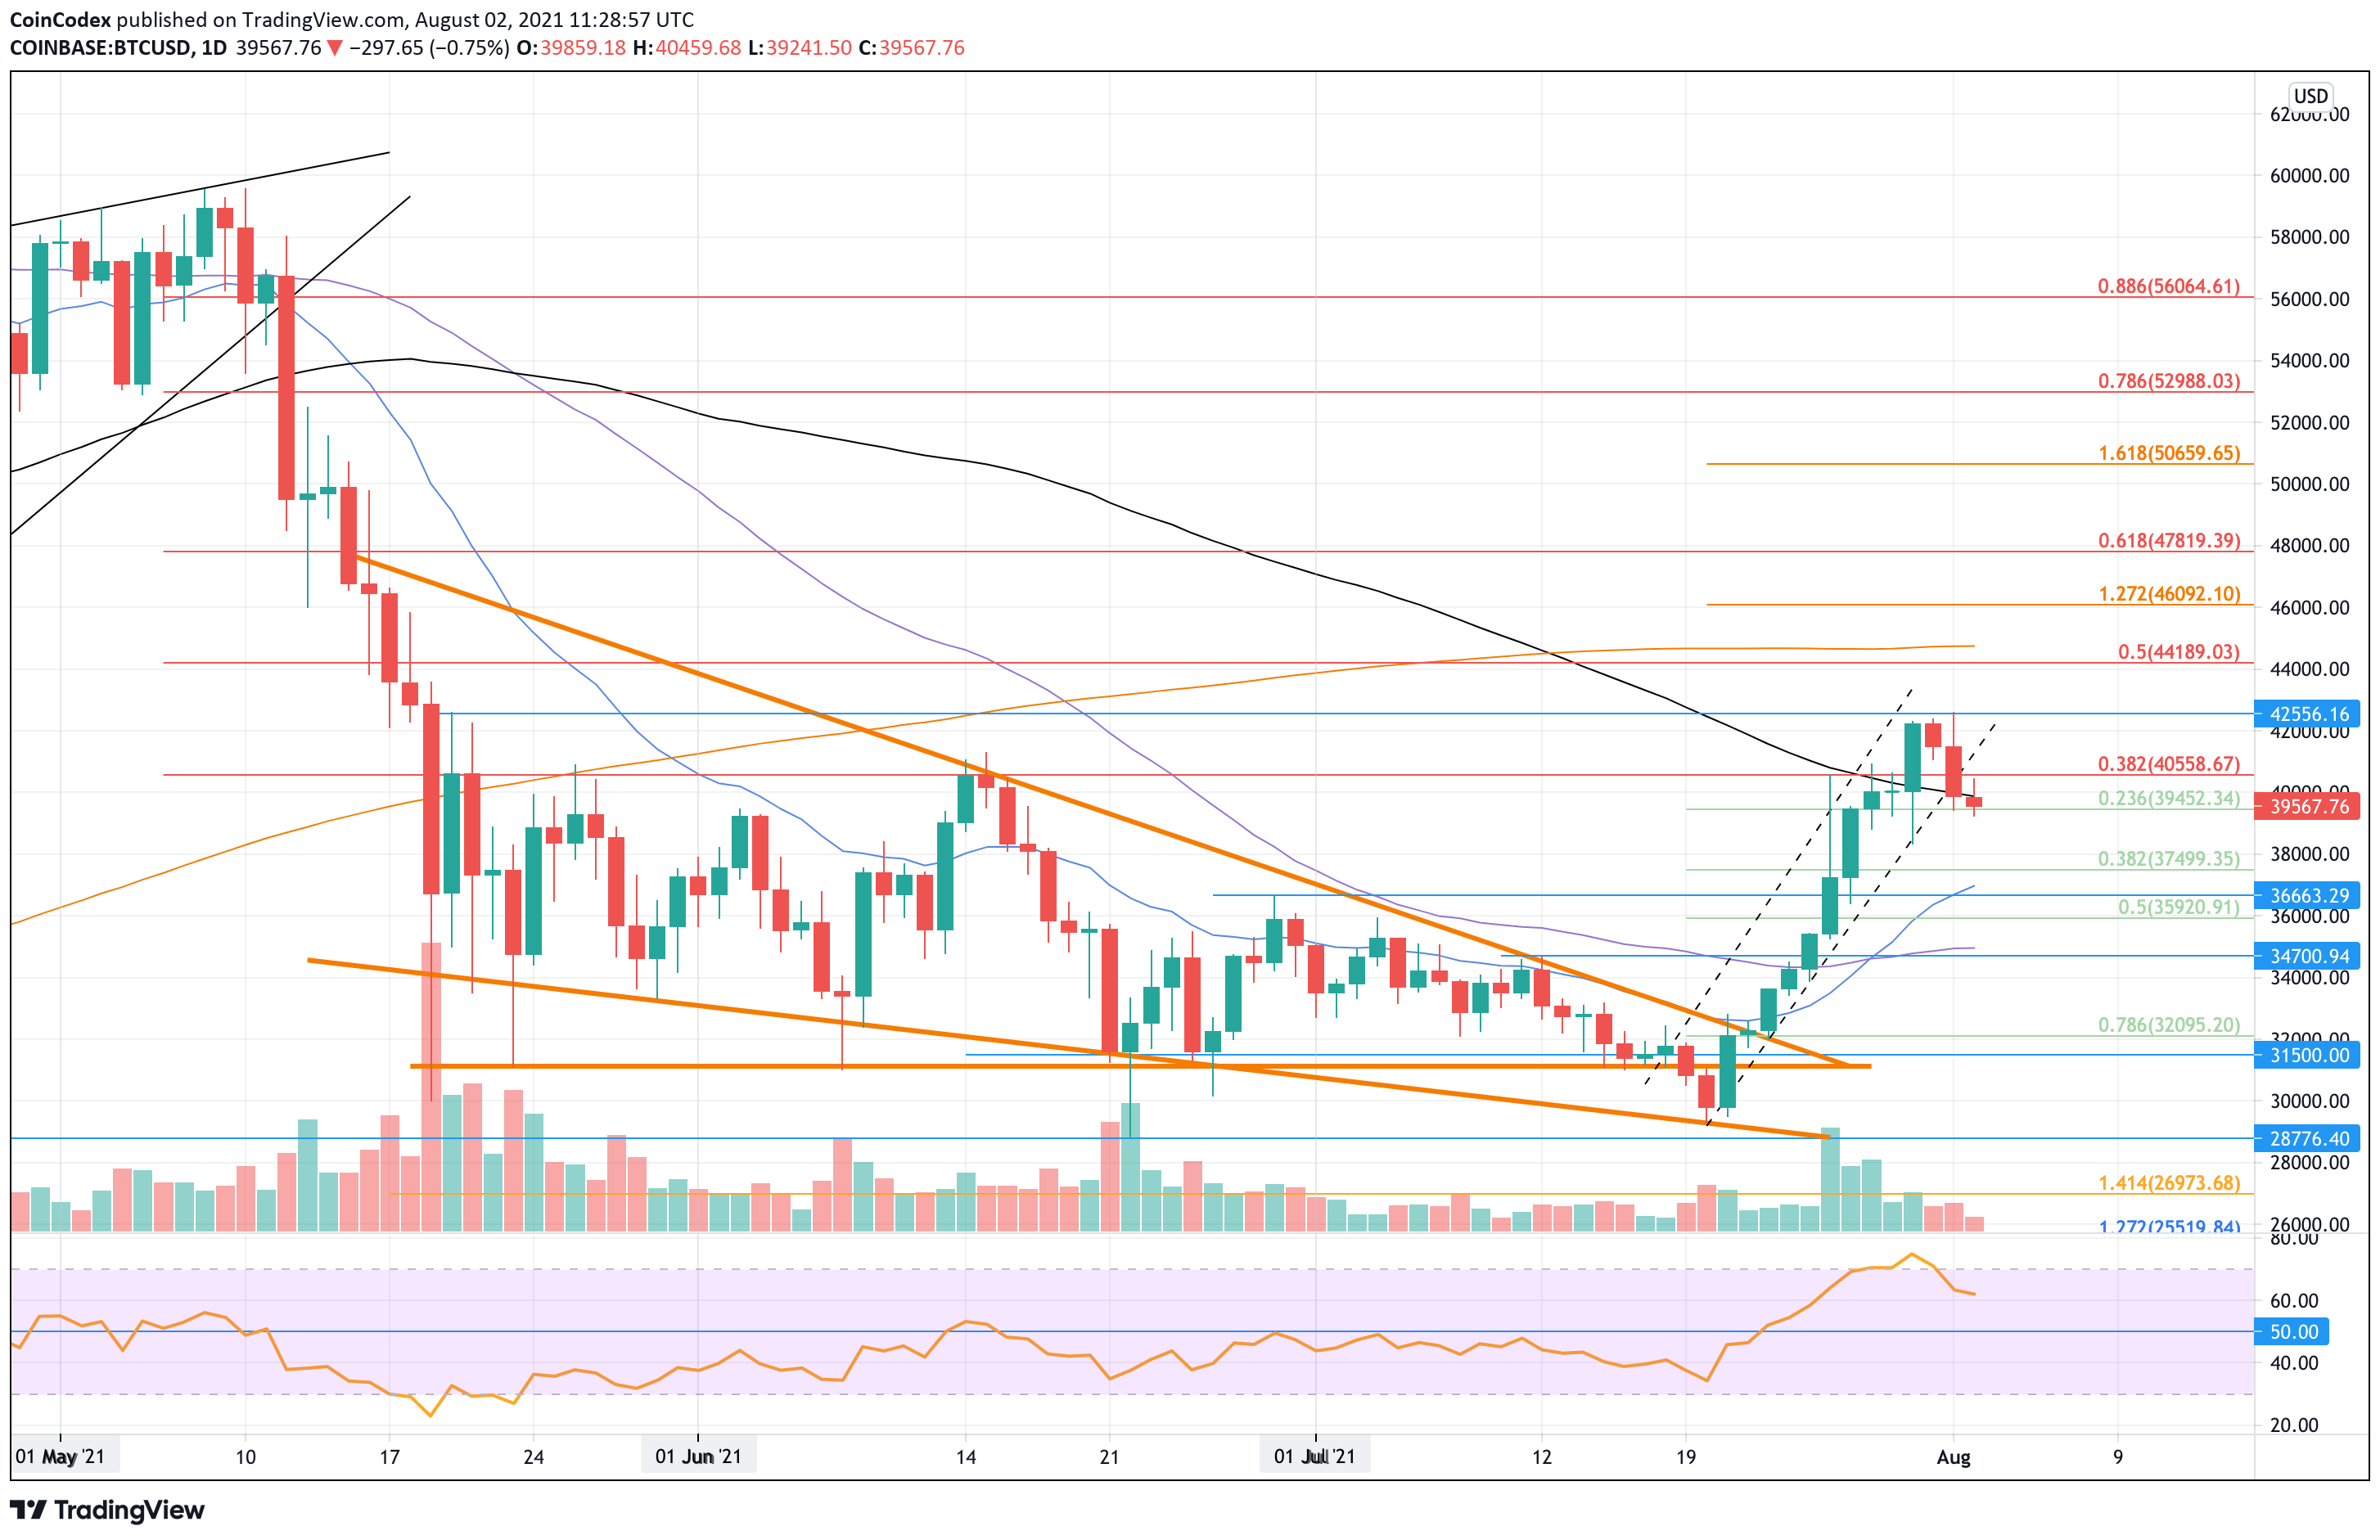
Daily chart
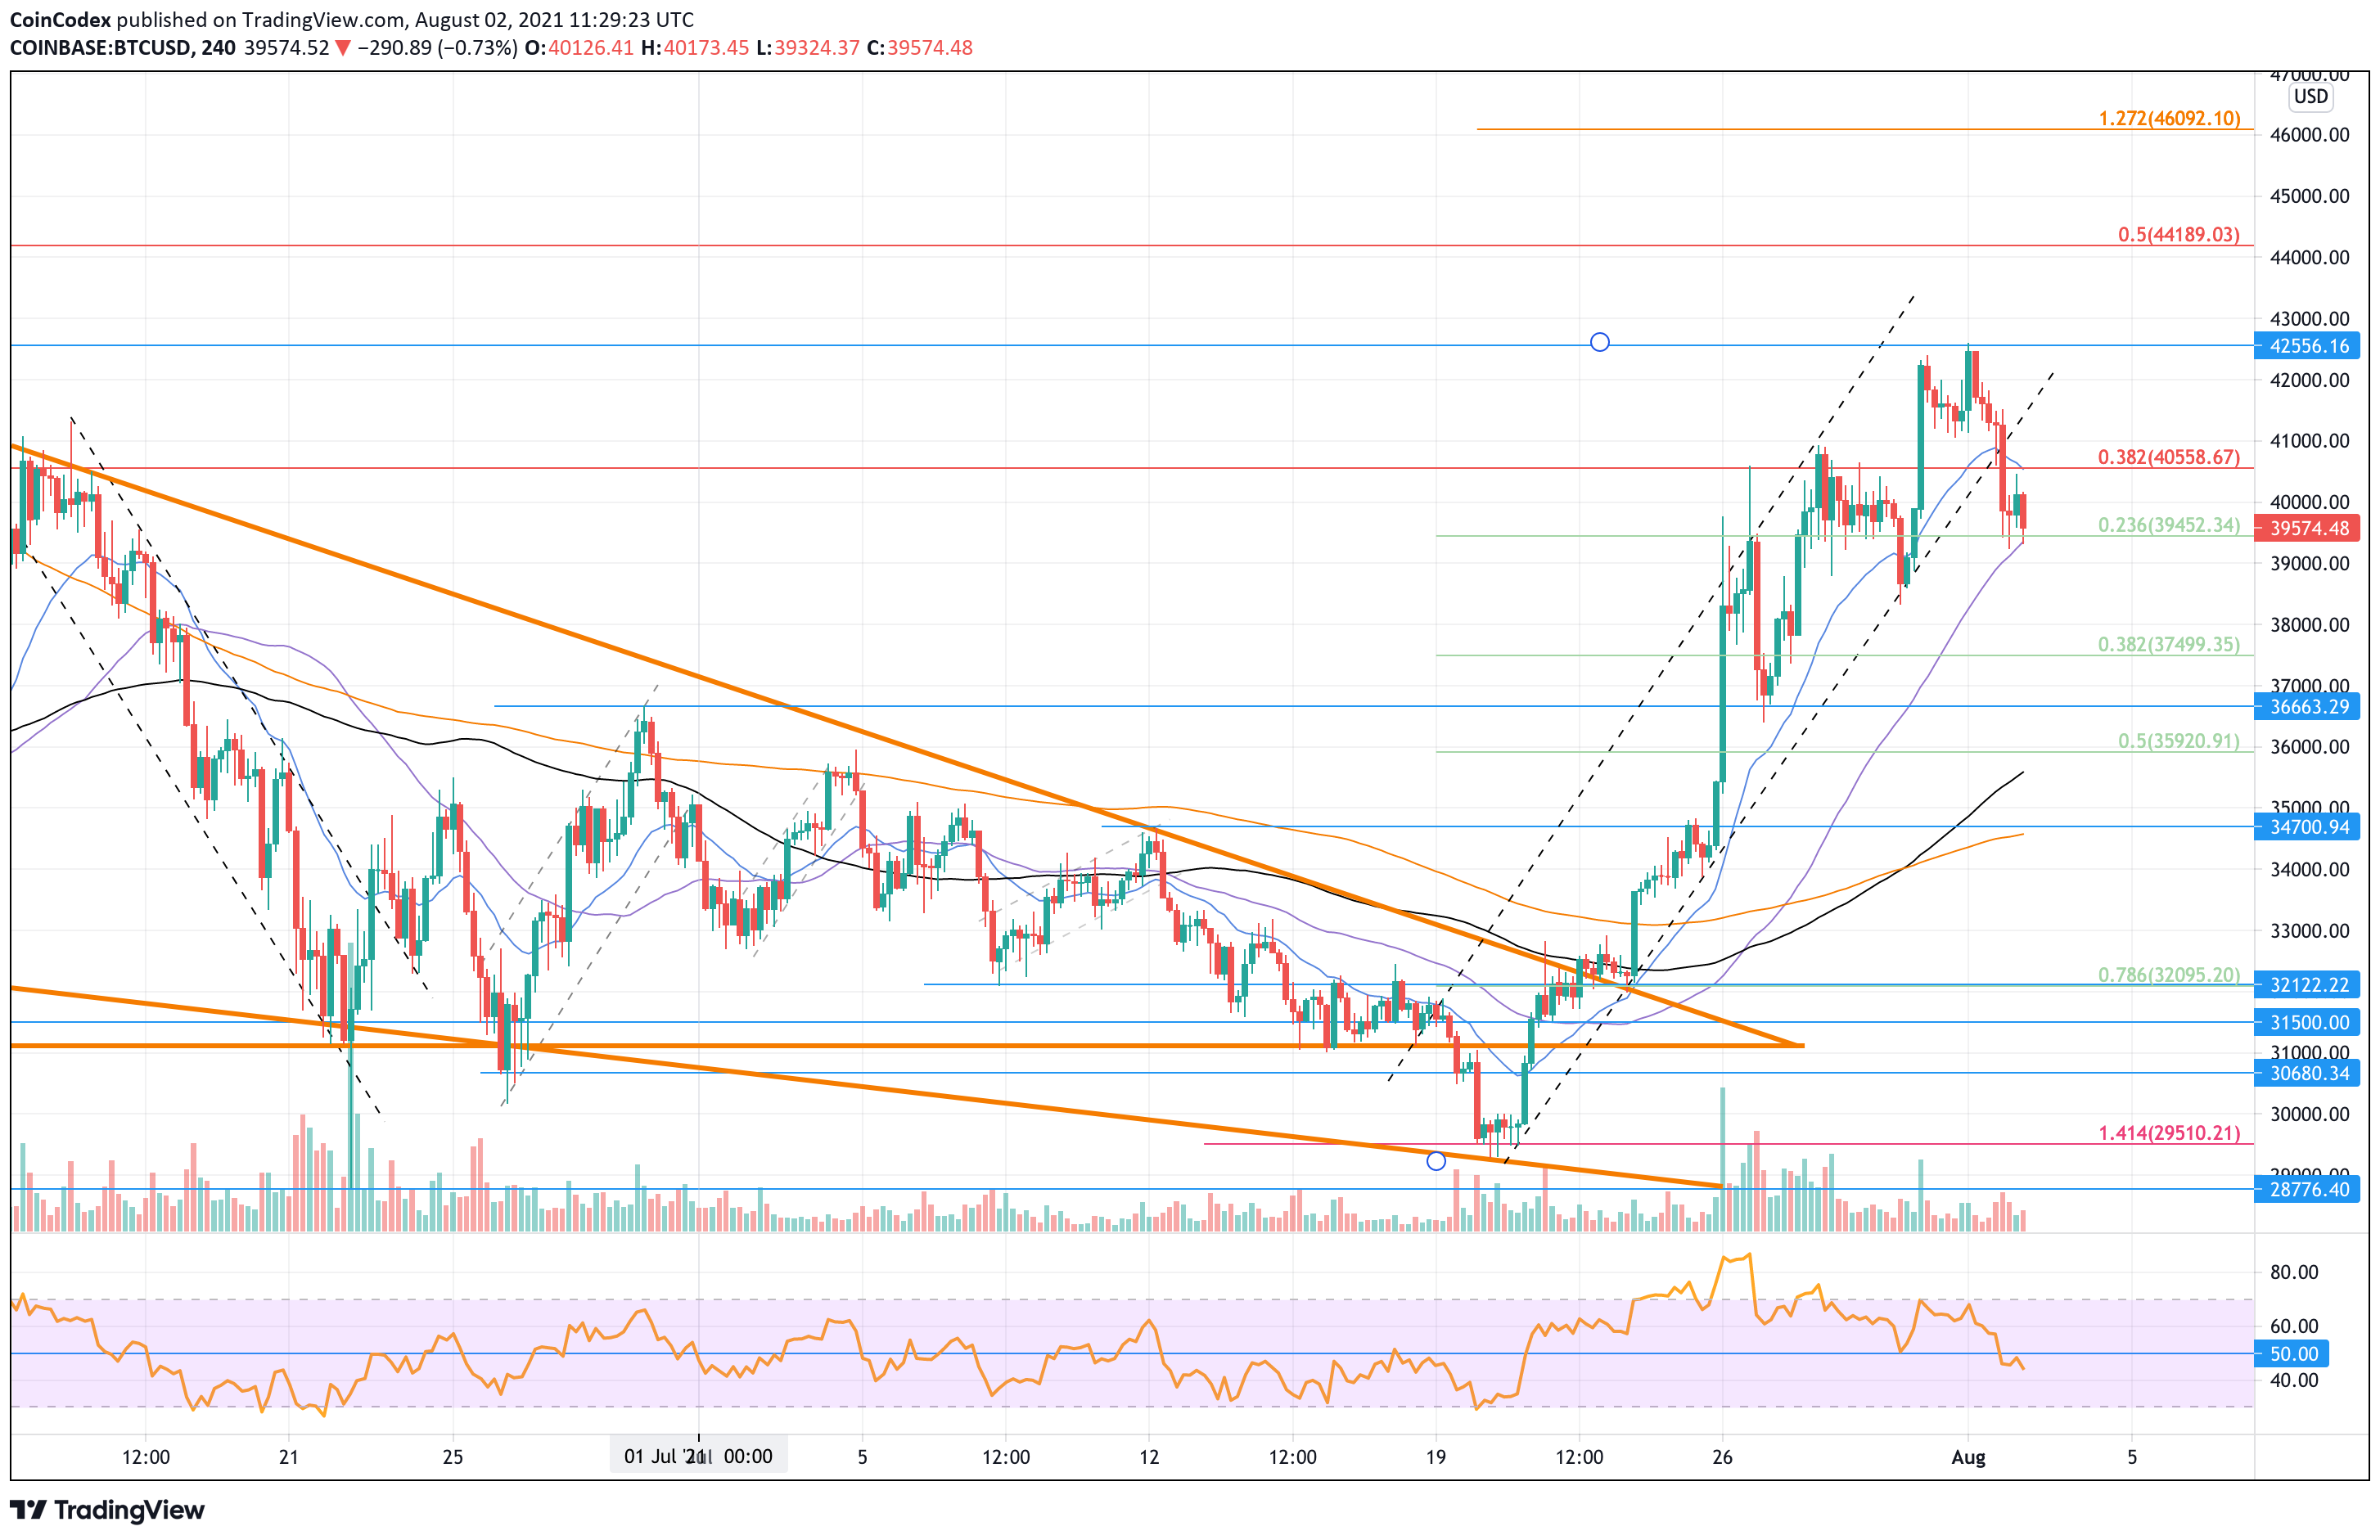
4-hour chart
What has been going on?
Taking a look at the daily chart above, we can see BTC breaking the descending wedge formation over the previous fortnight and kickstarting a rally higher. As it broke toward the upside of the wedge, it started to surge inside an ascending price channel - highlighted by the dashed lines.
The price of BTC surged inside this ascending price channel, and it allowed the coin to pass the 100-day EMA level over the weekend and to set a new 2-month high price at around $42,560 - not seen since late-May 2021.
Unfortunately, BTC was unable to overcome this resistance and rolled over from there yesterday to meet the support at the lower angle of the price channel and the 100-day EMA. Today, it continued lower, breaking beneath the lower boundary of the ascending price channel and hitting support at $39,450 - provided by a short-term .382 Fib Retracement level.
Despite the price channel breakdown, the surge allowed a bullish crossover signal of the 20-day EMA and the 50-day EMA for the first time since before May.
A retracement is healthy at this moment after the market hit extremely overbought conditions on the RSI for the first time since early March. The key now is for BTC to create a “higher low” price, preferably around $37,000 (20-day MA), before rebounding higher to break the August 2021 high at $42,560.
Bitcoin price short-term prediction: Neutral
Bitcoin still remains neutral in the short term and would have to break above resistance at $42,000 to start to turn bullish again. On the other side, a closing candle beneath $30K would turn the market bearish again.
If the sellers do break the current $39,450 support (.236 Fib Retracement), the first support below lies at $38,000. This is followed by $37,000 (20-day EMA), $36,660, $35,920 (.5 Fib Retracement), and $35,000 (50-day MA).
Where is the resistance toward the upside?
On the other side, the first resistance lies at $40K (100-day EMA). This is followed by $40,560 (bearish .382 Fib Retracement), $42,560 (August highs), and $44,120 (bearish .5 Fib Retracement).
Additional resistance lies at $44,750 (200-day EMA), $46,100 (1.272 Fib Extension), and $47,820 (bearish .618 Fib Retracement).
Keep up-to-date with the latest Bitcoin Price Predictions here.