The Bitcoin dominance rate (BTCD) has broken out from a descending resistance line.
It is approaching a confluence of Fib resistance levels close to 50-52.75%.
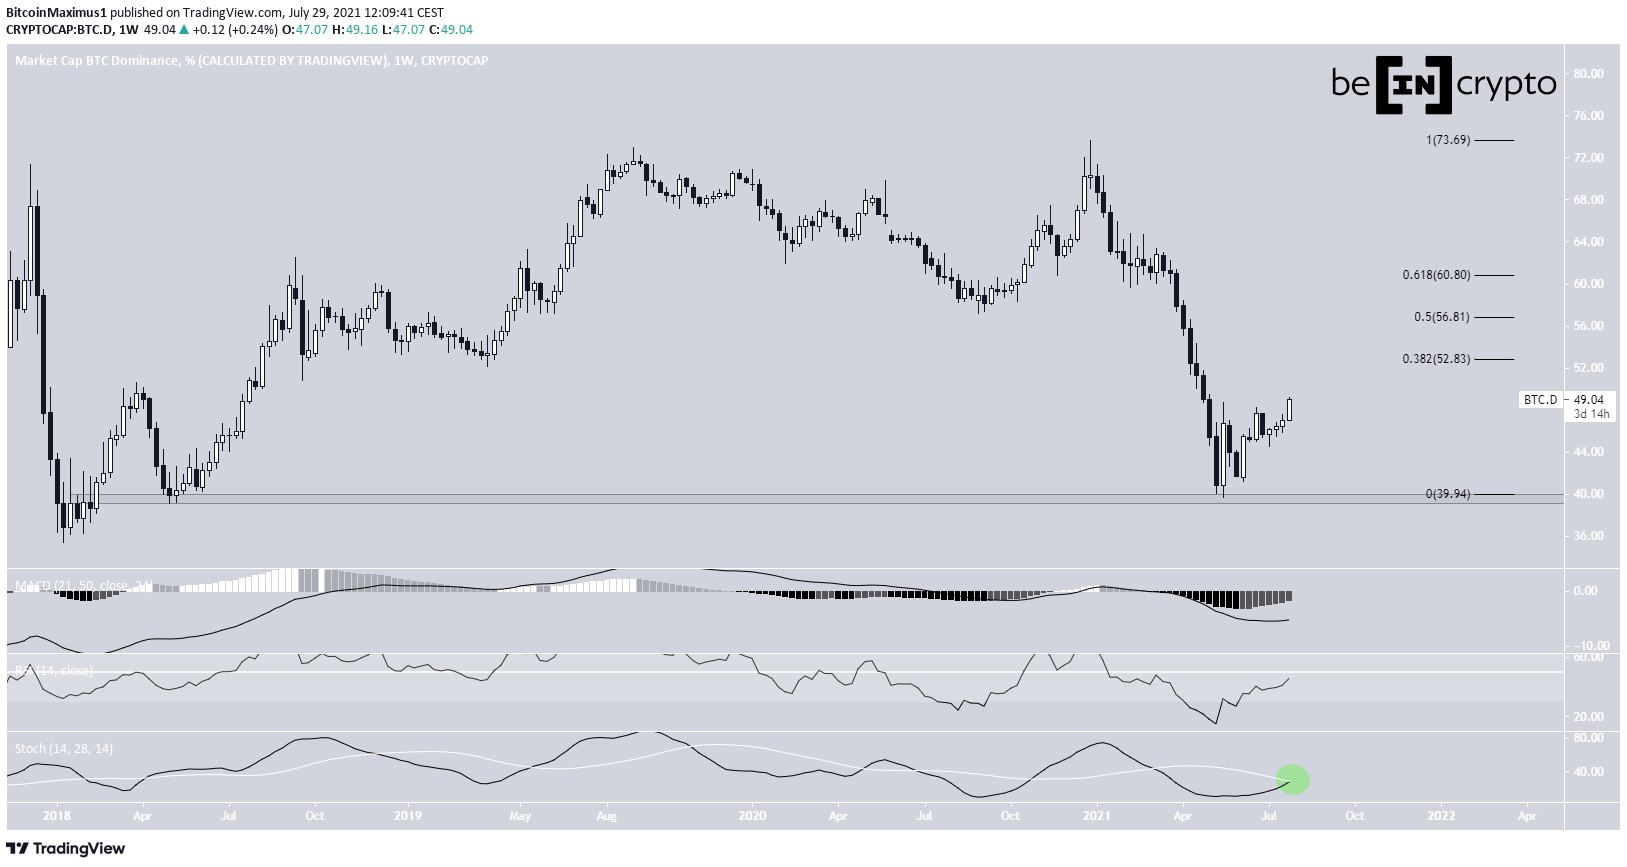
Long-term bounce
During the week of May 17-23, BTCD reached a low of 39.66% and bounced. The low nearly touched the 39.50% horizontal support area. The bounce created a bullish engulfing candlestick in the weekly time-frame.
After a slight drop, BTCD gradually resumed its upward movement.
The next closest resistance areas are at 52.83%, 56.81% and 60.80%. These are the 0.382, 0.5 and 0.618 Fib retracement resistance levels.
Technical indicators are showing bullish signs, but have not confirmed the bullish reversal yet. While the Stochastic oscillator is very close to making a bullish cross (green circle), the RSI is still below 50 and the MACD is negative.
Short-term movement
Cryptocurrency trader @BillGK_Crypto outlined a BTCD chart, stating that there is no weakness present in the current trend yet, outlining a potential increase towards 50.85%.
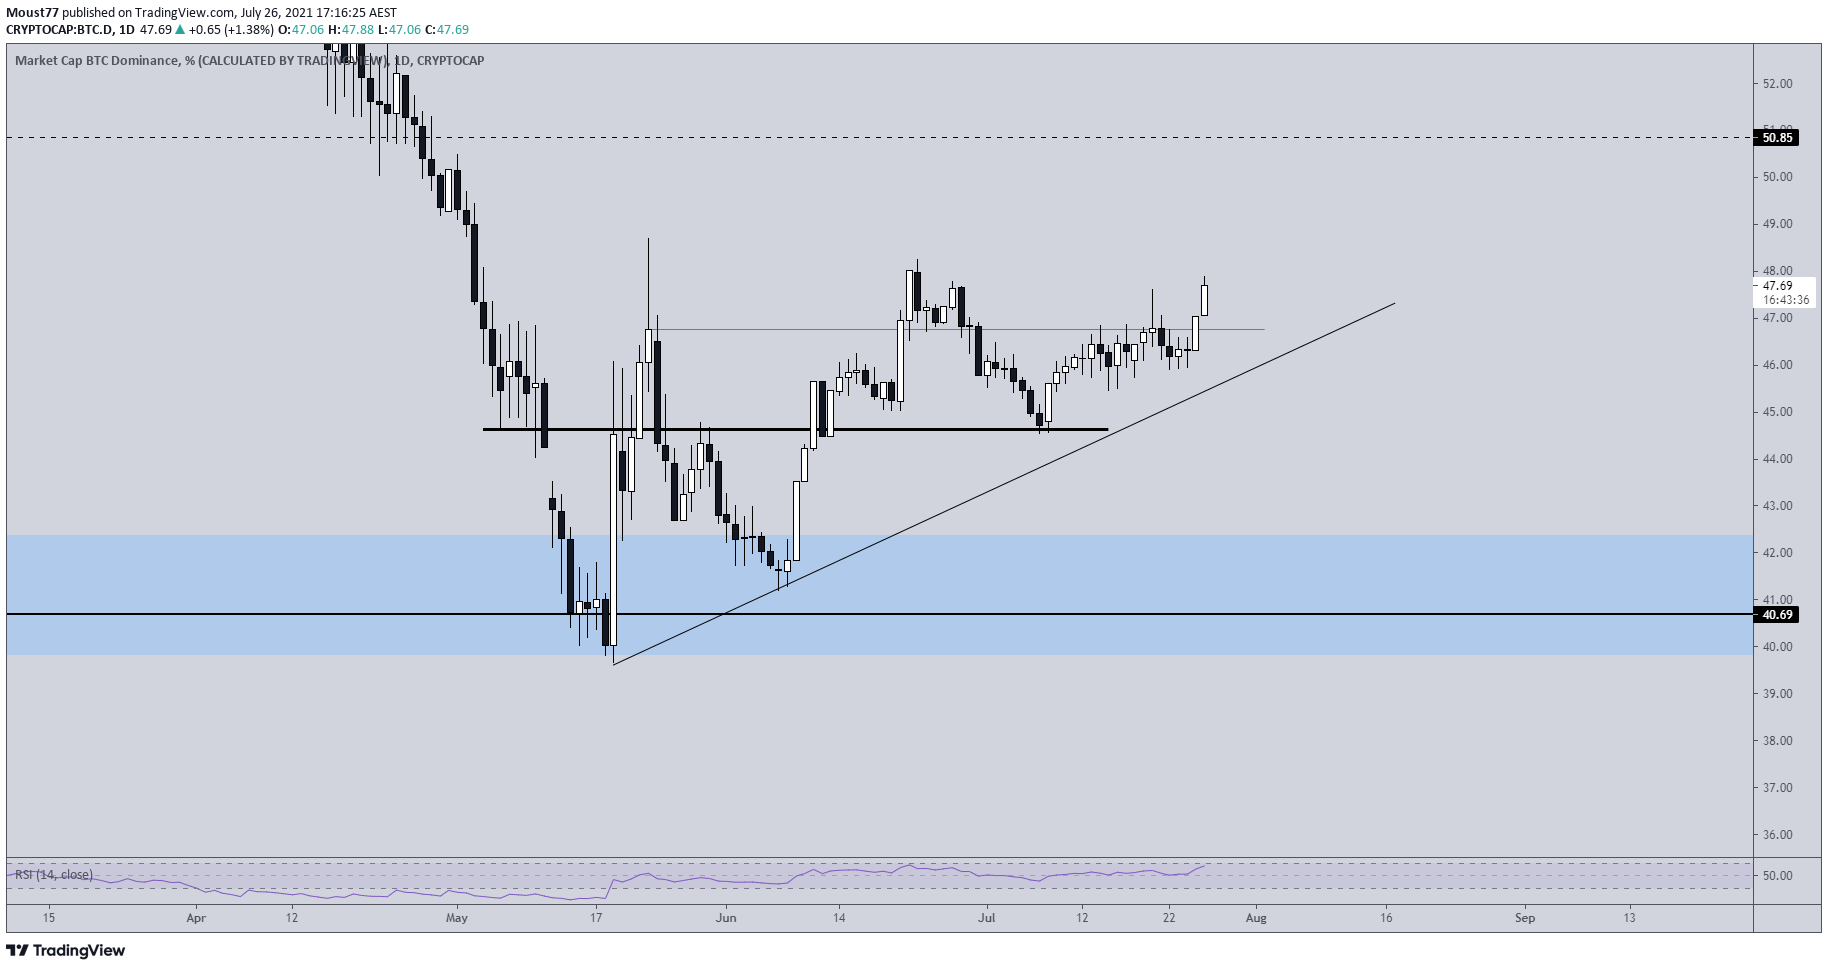
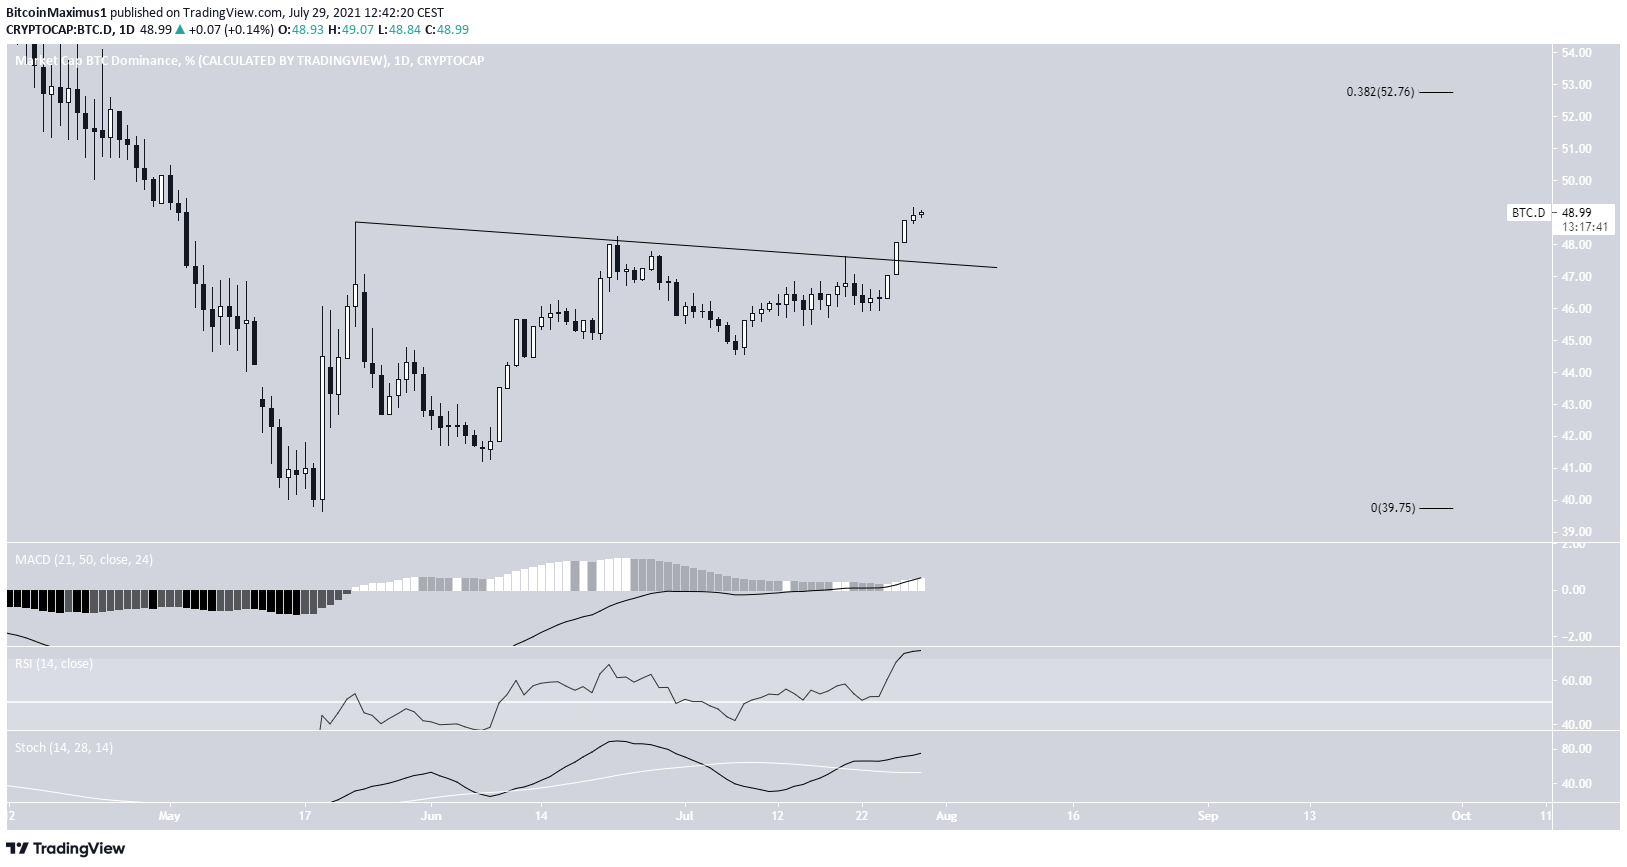
The daily chart does indeed look bullish.
BTCD has already broken out from a descending resistance line and reached a high of 49.16%, the highest value reached since the beginning of May.
In addition to this, technical indicators in the daily time-frame are bullish. The MACD is increasing and it is positive. The RSI has moved above 70 and the Stochastic oscillator has made a bullish cross.
Therefore, an upward movement towards the 52.76% resistance area seems likely.
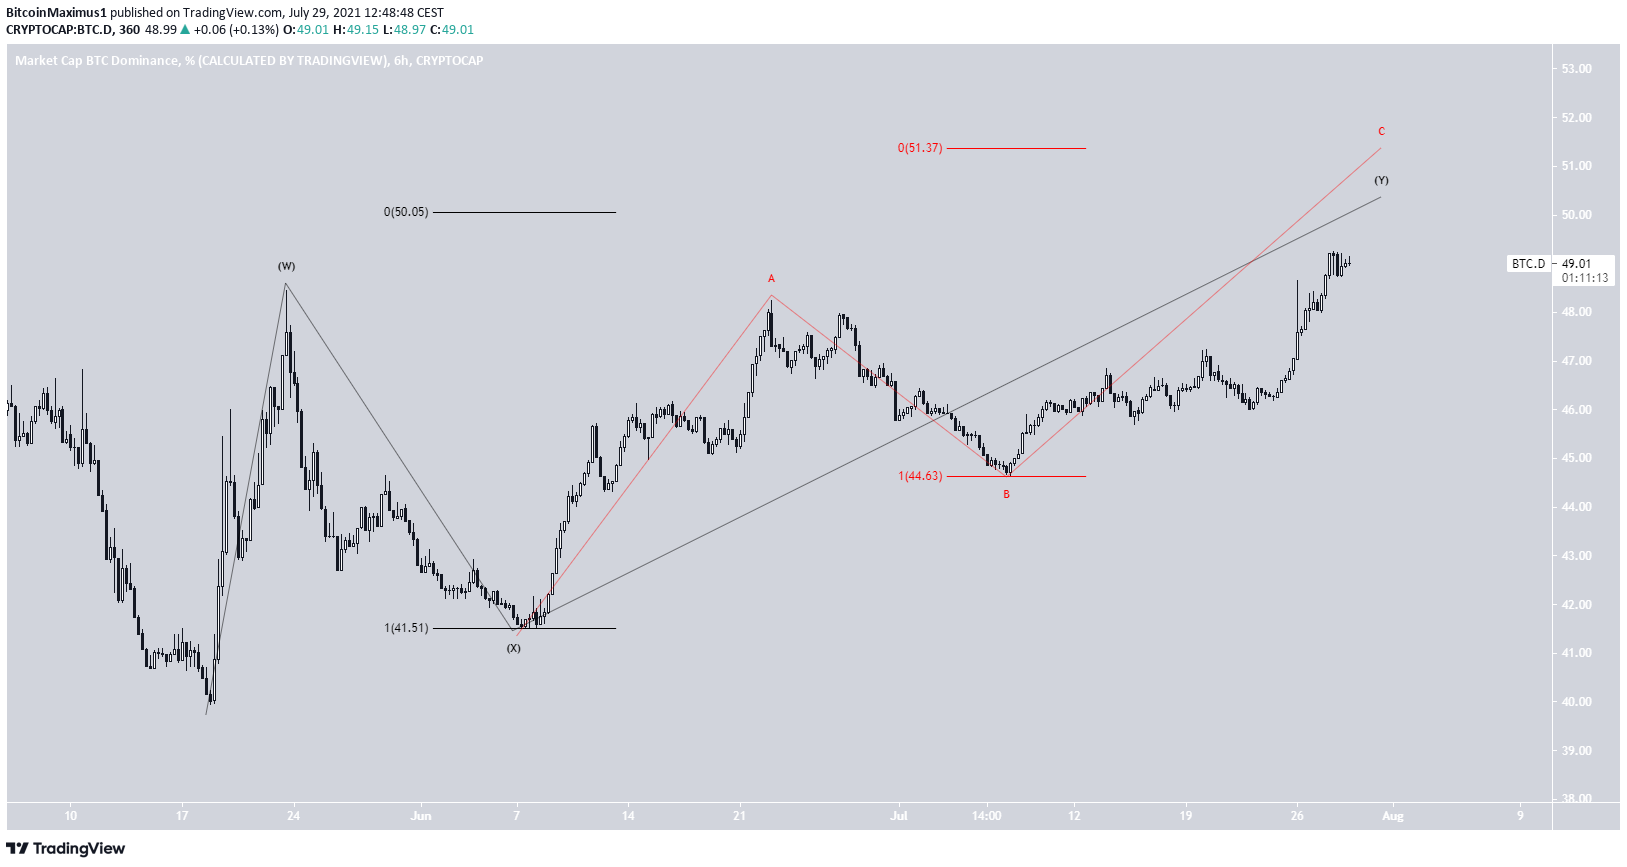
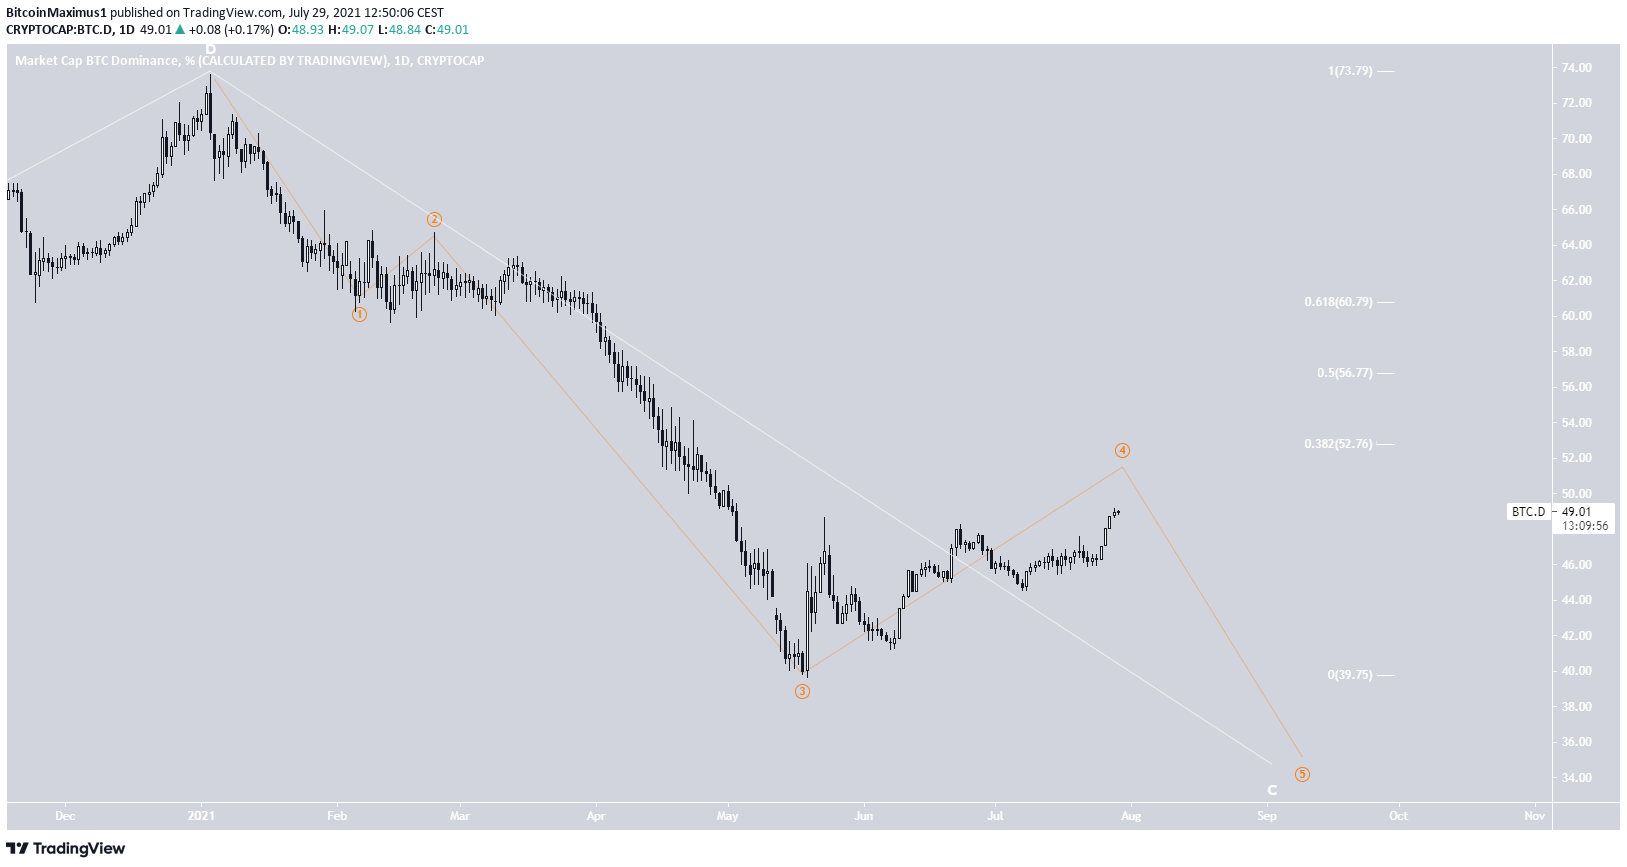
Wave count
The wave count indicates that BTCD is in wave four of a bearish impulse (orange), that began with the Jan. 3 high.
The entire bearish impulse would complete a long-term C wave (white).
The shorter-term chart is in agreement with this possibility. In it, BTCD is approaching the end of a complex corrective structure.
The most likely area for the top would be between 50-51.37%, found by giving waves W:X a 1:1 ratio (black) and sub-waves A:C a 1:1 ratio (red).
The area is also very close to the 0.382 Fib retracement resistance level at 52.75%.