Key highlights:
- Bitcoin is down 4.5% this week as it continues to battle with $20,000
- BTC/USD briefly broke beneath $20,000 over the week but quickly rebounded on each attempt
- A break beneath $19,575 could see BTC heading back to the 2022 lows
| Bitcoin price | $20,250 |
|---|---|
| Key BTC resistance levels | $20,000, $19,720, $19,575, $19,000, $18,585 |
| Key BTC support levels | $20,500, $20,700, $21,000, $21,600, $22,650 |
*Price at the time of publication
Bitcoin is down by a small 4.5% over the past week of trading as the number one ranked cryptocurrency continues to cling onto the $20,000 level. The cryptocurrency spike beneath $20,000 on multiple weekly occasions but quickly rebounded from support at $19,575 (downside 1.272 Fib Extension).
The coin has been trading within a range between $20,500 and the support at $19,575 for the entire week and must break this range to dictate the next direction for the market.
The inflation narrative seems to inject uncertainty within the market as traders aren’t entirely sure what the Federal Reserve will do next with interest rates. As a result, it seems that the total number of active Bitcoin users continues to slump.
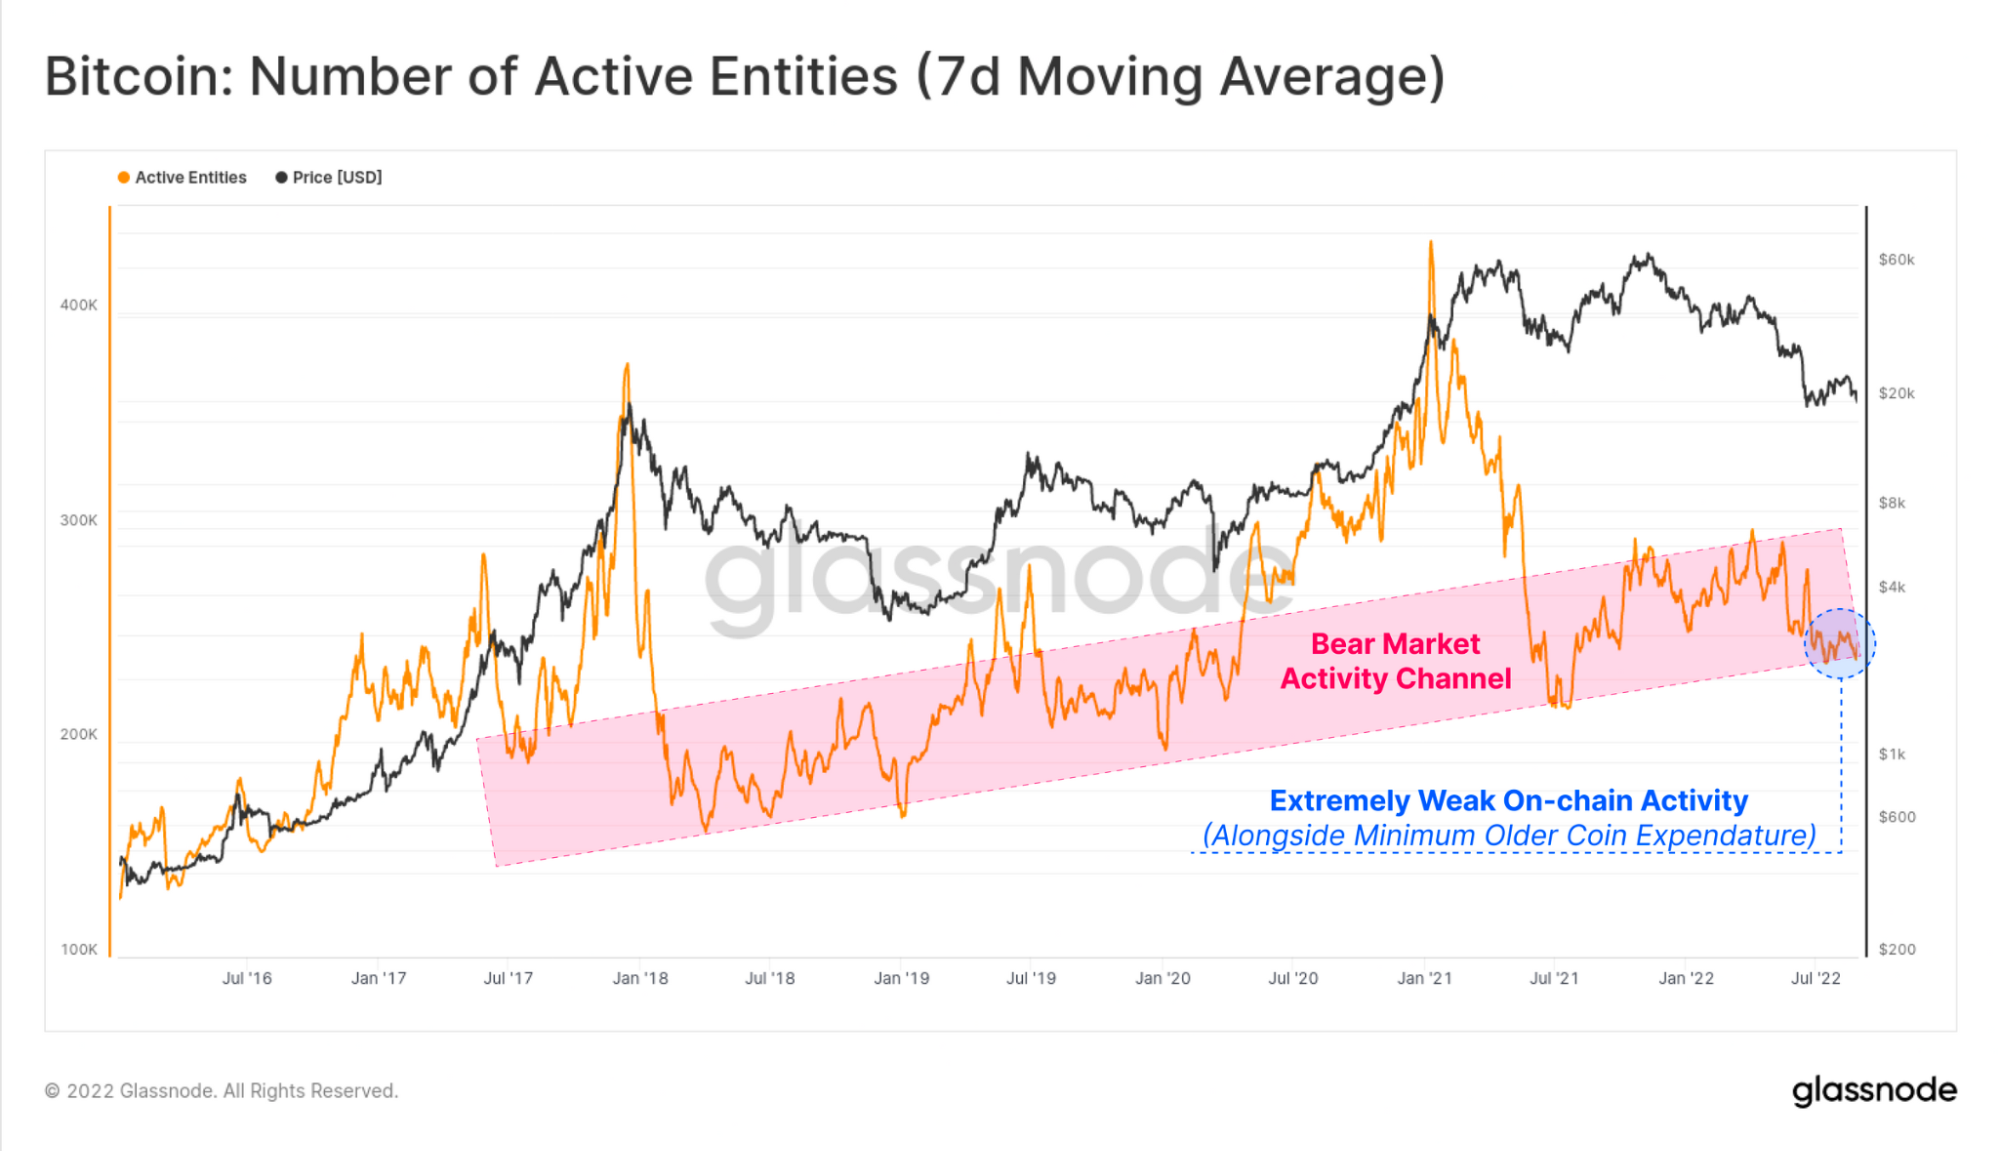
Image source: Glassnode
The chart above shows the number of active entities within Bitcoin. We can see that it has been hovering inside a bear market activity channel for quite some time as traders sit on the sidelines, waiting for more clarity in the market. The constant decline in active users shows that there is little growth in the active user base.
The lack of commitment from traders is apparent when we consider that the Bitcoin Futures volume hit a 21-month low this month. According to The Block Research, Bitcoin Futures trading volume for August was $940 billion, the first month it has been beneath $1 trillion since December 2019.
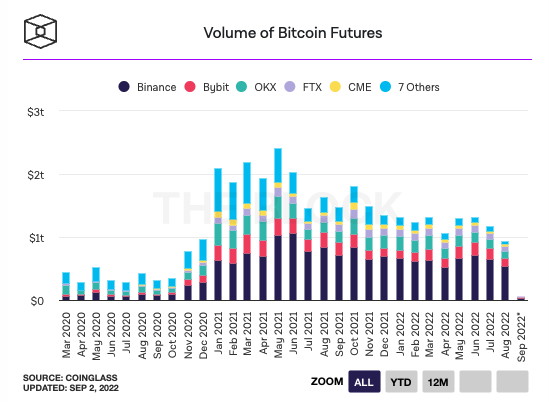
Image source: The Block data dashboard
The current Bitcoin drawdown has been ongoing for a total of almost 300 days so far, and BTC is now down 70% from the all-time high levels. Unfortunately, it seems that there might be some more pain ahead, as indicated by the following chart from Arcane Research.
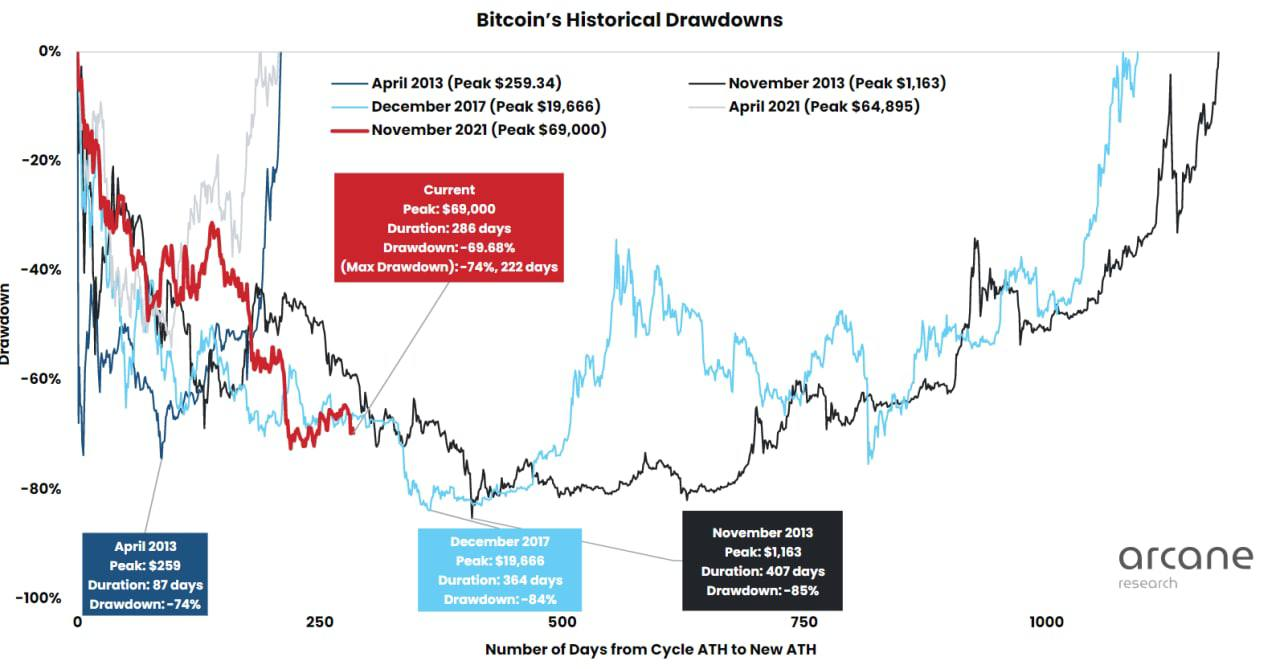
Image source: Arcane Research
The chart shows the drawdowns for BTC against the number of days from cycle ATH to new ATH. Looking at the chart above, we can see that in the 2014 and 2018 bear markets, the bottoms occurred 12-13 months after the bear market began, with a max drawdown of 85%. As we are just 300 days into the current downturn and only 70% off the ATHs, there is a potential for more pain.
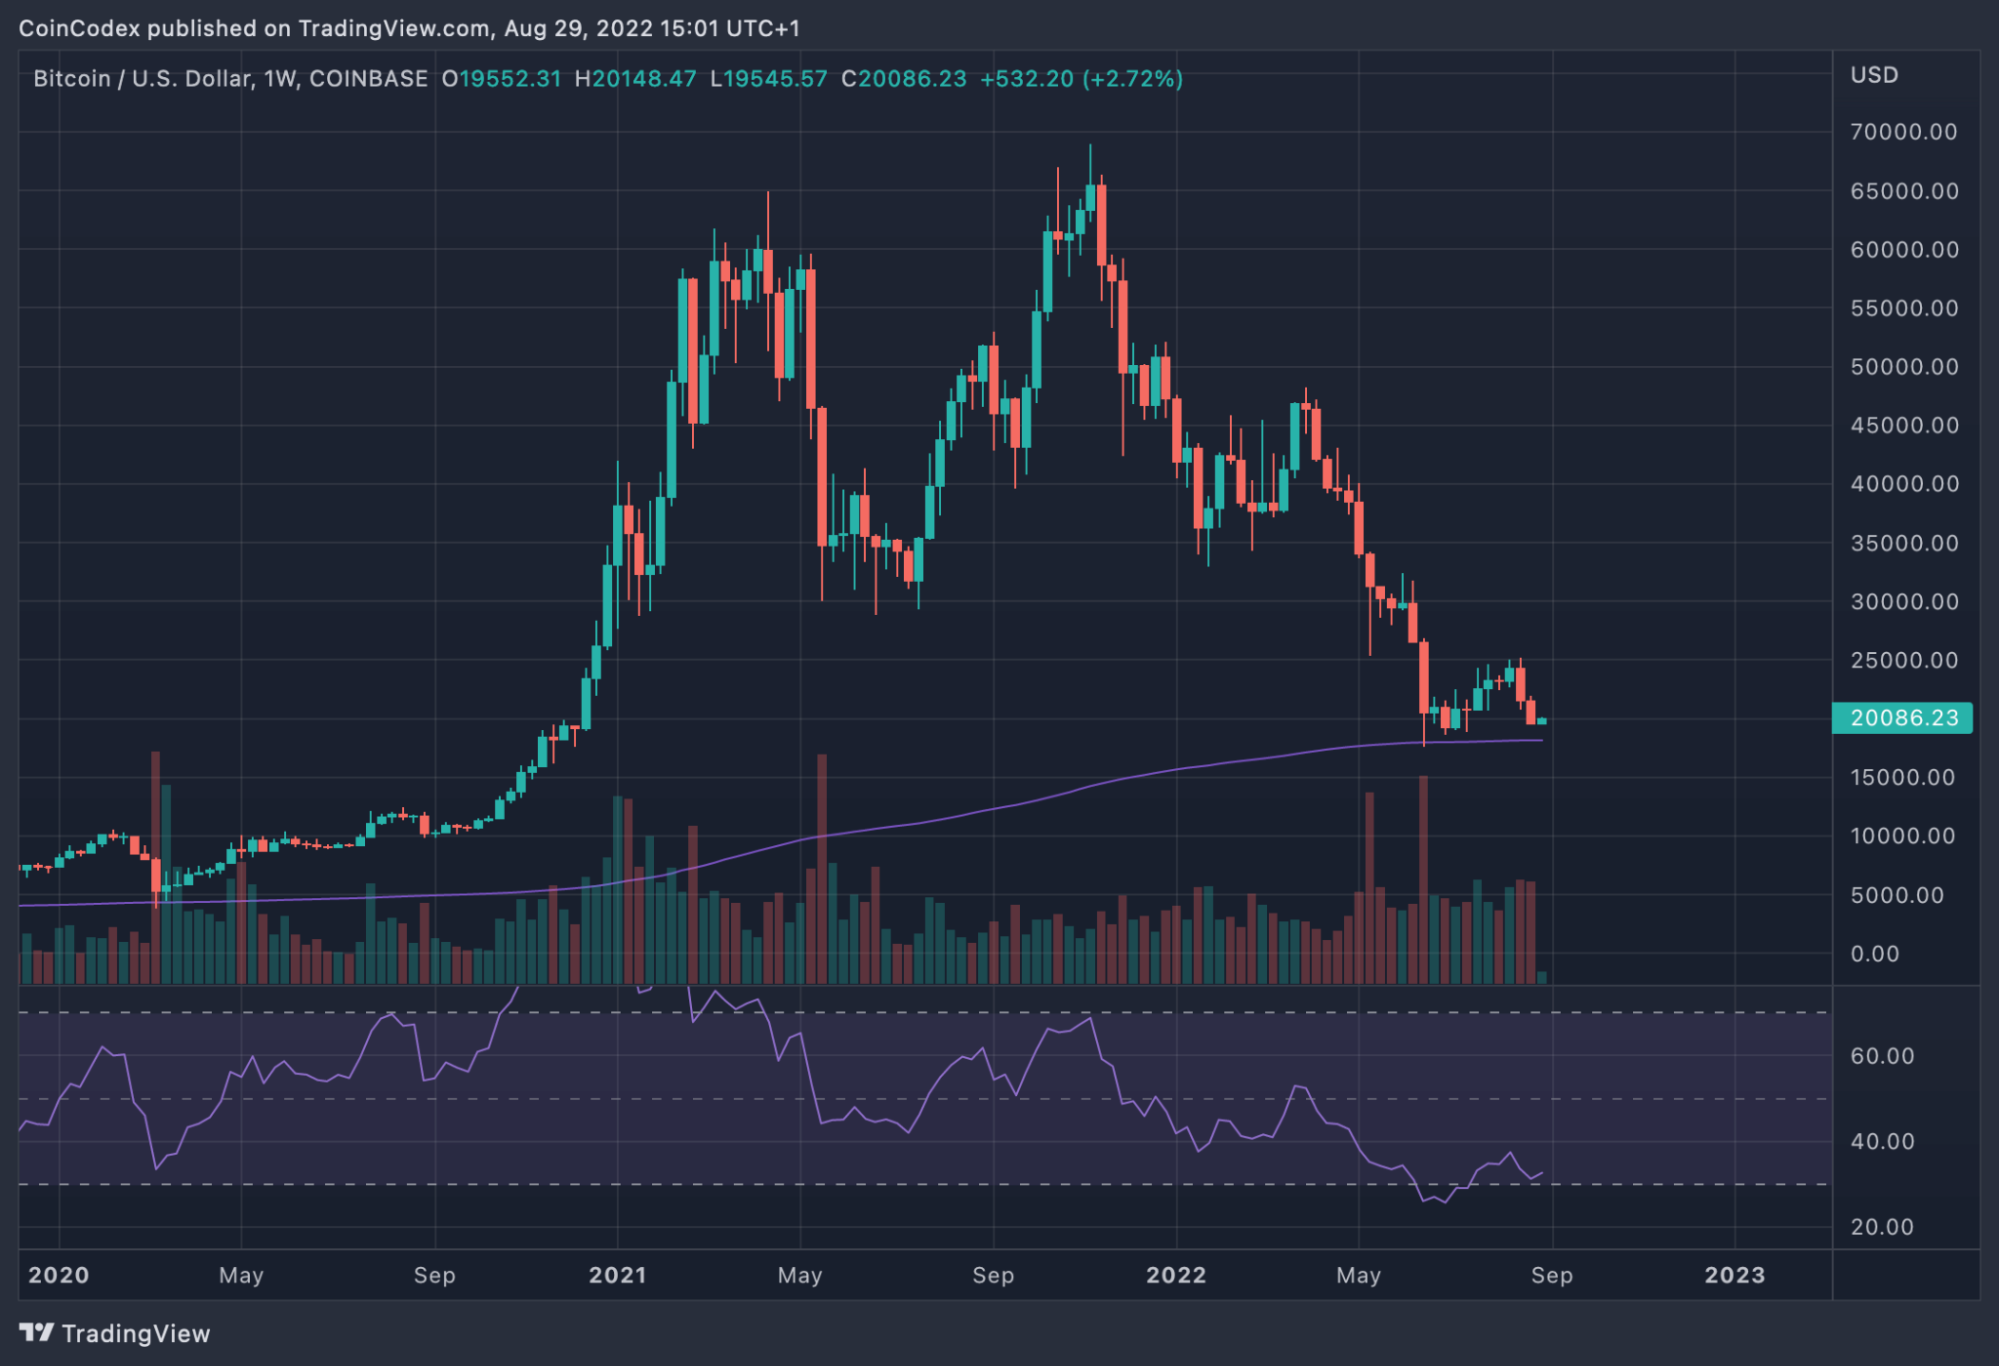
Looking ahead, all traders are now praying and hoping that the weekly 200-SMA holds. The weekly 200-SMA provided support for the market during the May price collapse, and traders are now looking back to the level for support moving forward.
With that in mind, let us take a closer look at the charts and see the potential support and resistance areas moving forward.
Bitcoin price analysis
Daily chart
4-hour chart
What has been going on?
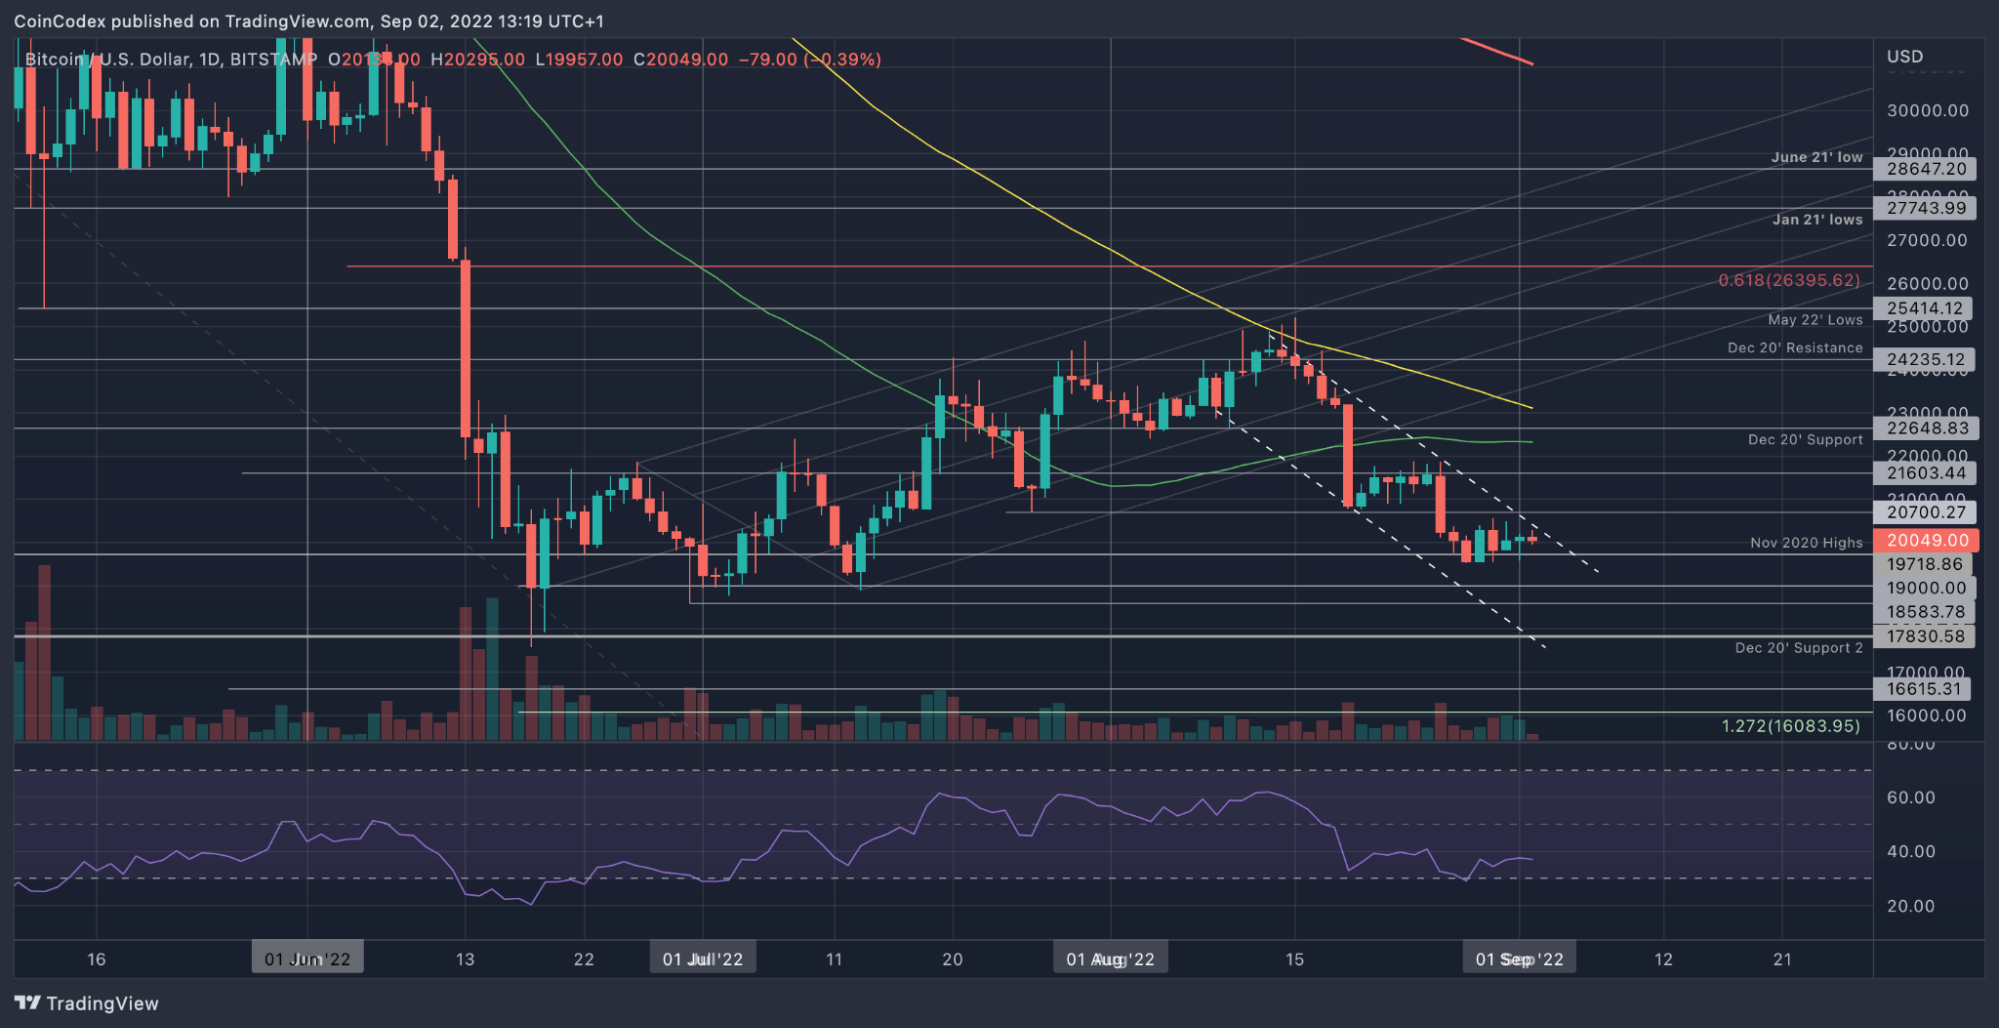
Looking at the daily chart above, we can see that BTC/USD has been in a downtrend since mid-August, when it failed to overcome resistance at the 100-day MA level. As a result, BTC rolled over from there and started to head lower.
BTC would break beneath the previous rising price channel a fortnight ago and continued to slide inside the current descending price channel. This week, BTC did briefly slip beneath the November 2020 highs at $19,720 but managed to reclaim $20,000 on each occasion.
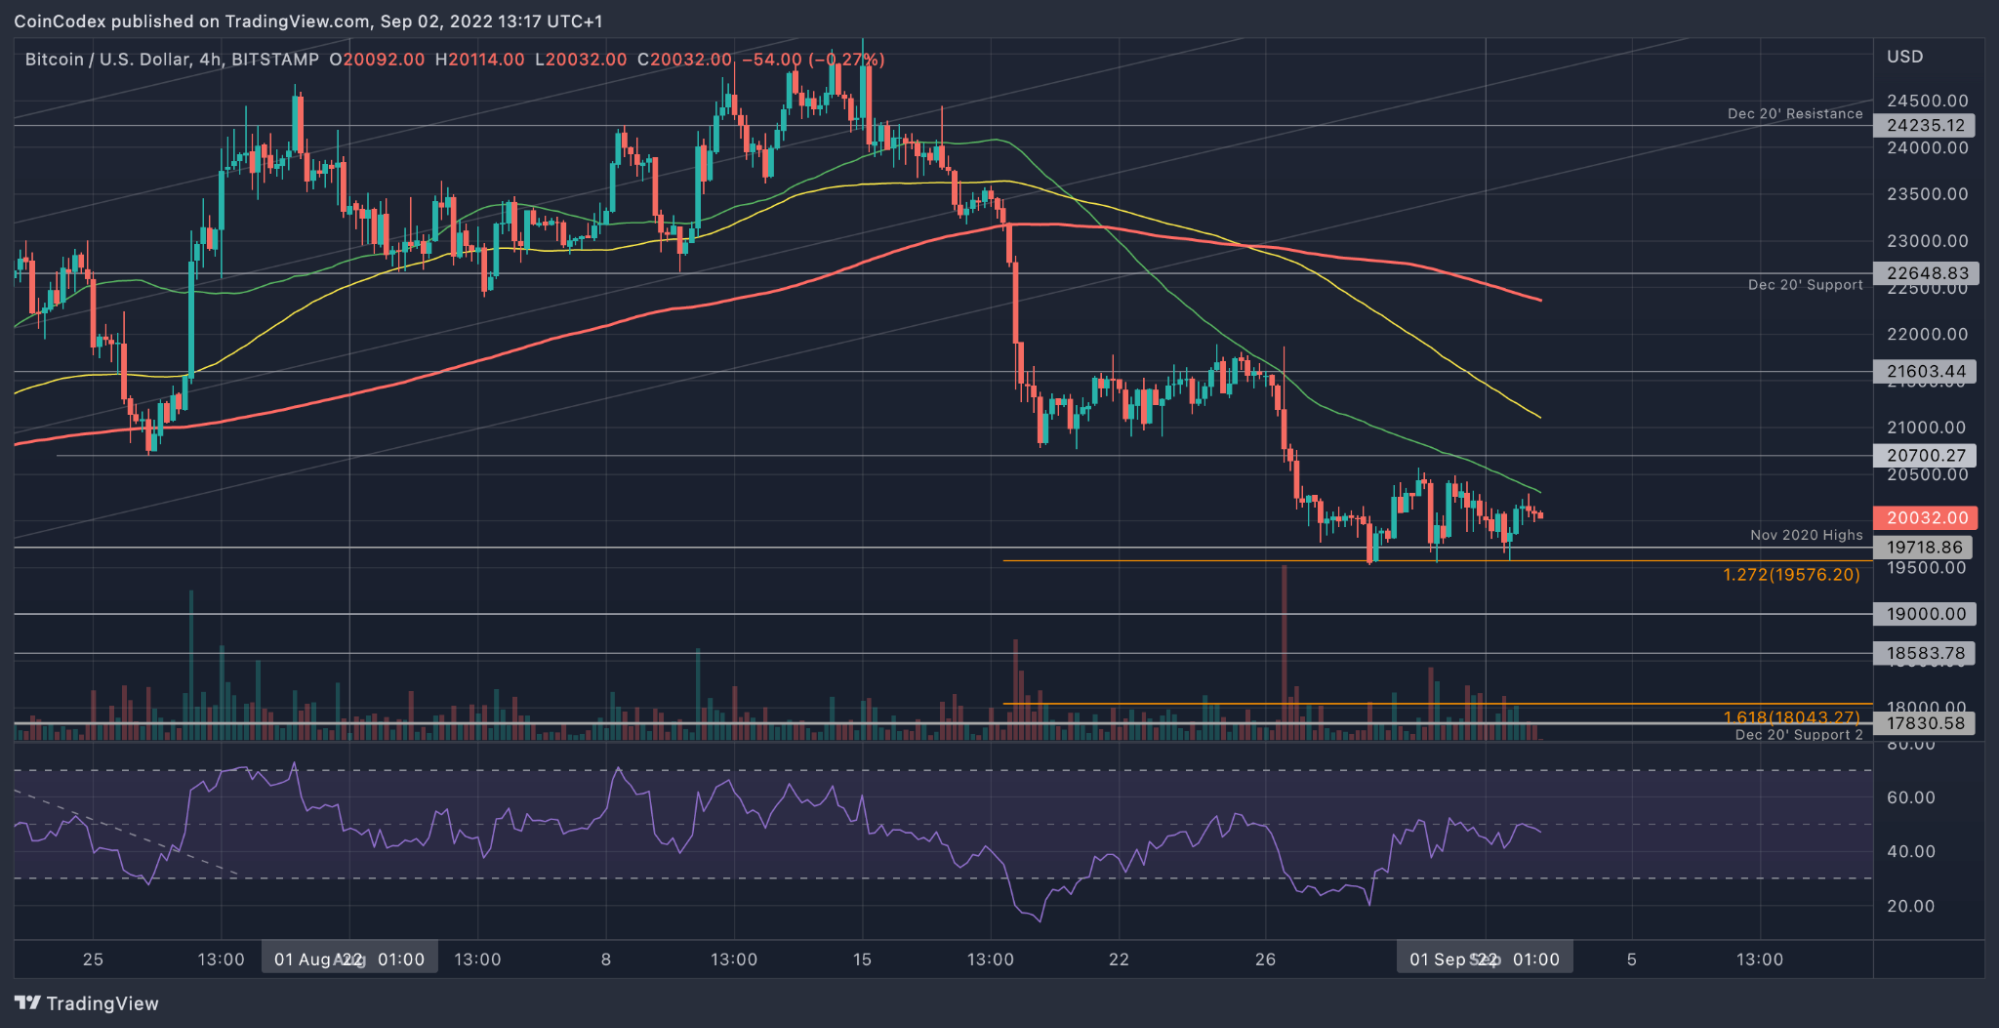
The 4-hour chart provides a better perspective of short-term trading action. We can see that BTC made multiple attempts to break beneath $20,000 during the week. On each occasion, BTC managed to hold the support at $19,575, provided by a downside 1.272 Fib Extension level.
After hitting this support, BTC quickly rebounded above $20,000. However, it is important to note that BTC struggled to break above $20,500 earlier in the week and hasn’t attempted the weekly high since.
Bitcoin price short-term prediction: Bearish
The break of the channel has ended any short-term bullish hope in the market. The market is now bearish and would need to overcome resistance at $25,000 to turn bullish again over the long term.
BTC needs to break above $20,500 to show short-term bullish momentum.
The break beneath $20,700 has sent Bitcoin into the previously bearish sentiment that it was trading in before recovering in July. If $19,575 breaks over the weekend, we could expect Bitcoin to head back toward the 2022 lows again at $17,590.
So, where are we heading next?
The next direction for Bitcoin will be dictated by the breakout direction of the current range that sits between $20,500 and support at $19,575. A break beneath the lower boundary of the range will send BTC into a dangerous spiral lower.
In that case, the first support lies at $19,720 (Nov 2020 highs). This is followed by the lower angle of the range at $19,575. Beneath this, added support lies at $19,000, $18,585, $18,000, and $17,830 (2nd December 2020 support).
Additional support is expected at $17,500, $17,000, $16,615, and $16,000.
On the other side, the first resistance level lies at $20,500. This is followed by resistance at $20,700, $21,000, $21,600, $22,000, and $22,650 (December 2020 support). You can also see a list of the important support and resistance levels on our Bitcoin price prediction page.
The daily RSI is hovering in the bearish territory but is attempting to push higher, indicating that the bearish momentum could be fading. In addition, the 4HR RSI is attempting to break the mid-line to inject some short-term bullish momentum into the market.