The Bitcoin bear market appears to be far from over as the price has dropped to the bulls’ last line of defense before another massive leg down. The short-term and even mid-term price action of Bitcoin could be determined in the next few days.
Technical Analysis
By: Edris
The Daily Chart
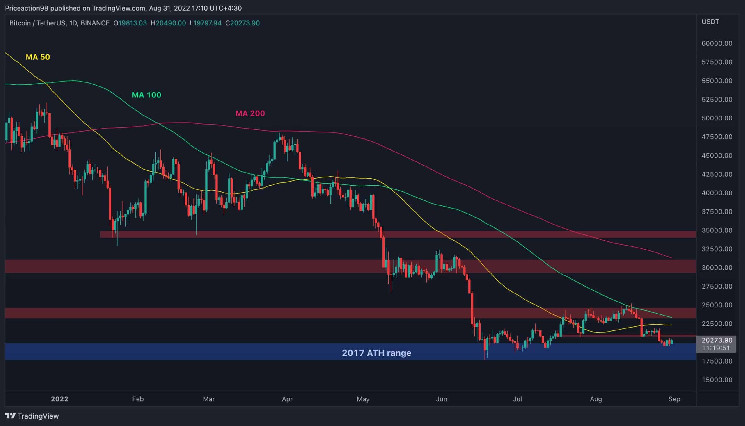
Looking at the daily chart, the recent downtrend was initiated after the price was rejected from the $24K static resistance level. Moreover, it was rejected from the 100-day moving average at the same price, acting as a dynamic resistance. A bearish breakout and consolidation below the 50-day moving average have signaled that the current drop is more likely to be a bearish reversal than just a short-term pullback.
Eventually, the price climbed back to the $20K level and appears to be supported once again. However, a potential bounce from this area would likely be a bullish correction before another run lower. This is a probable scenario if the price fails to break the 50-day and 100-day moving averages around the $22k-$24K area to the upside.
The 4-Hour Chart
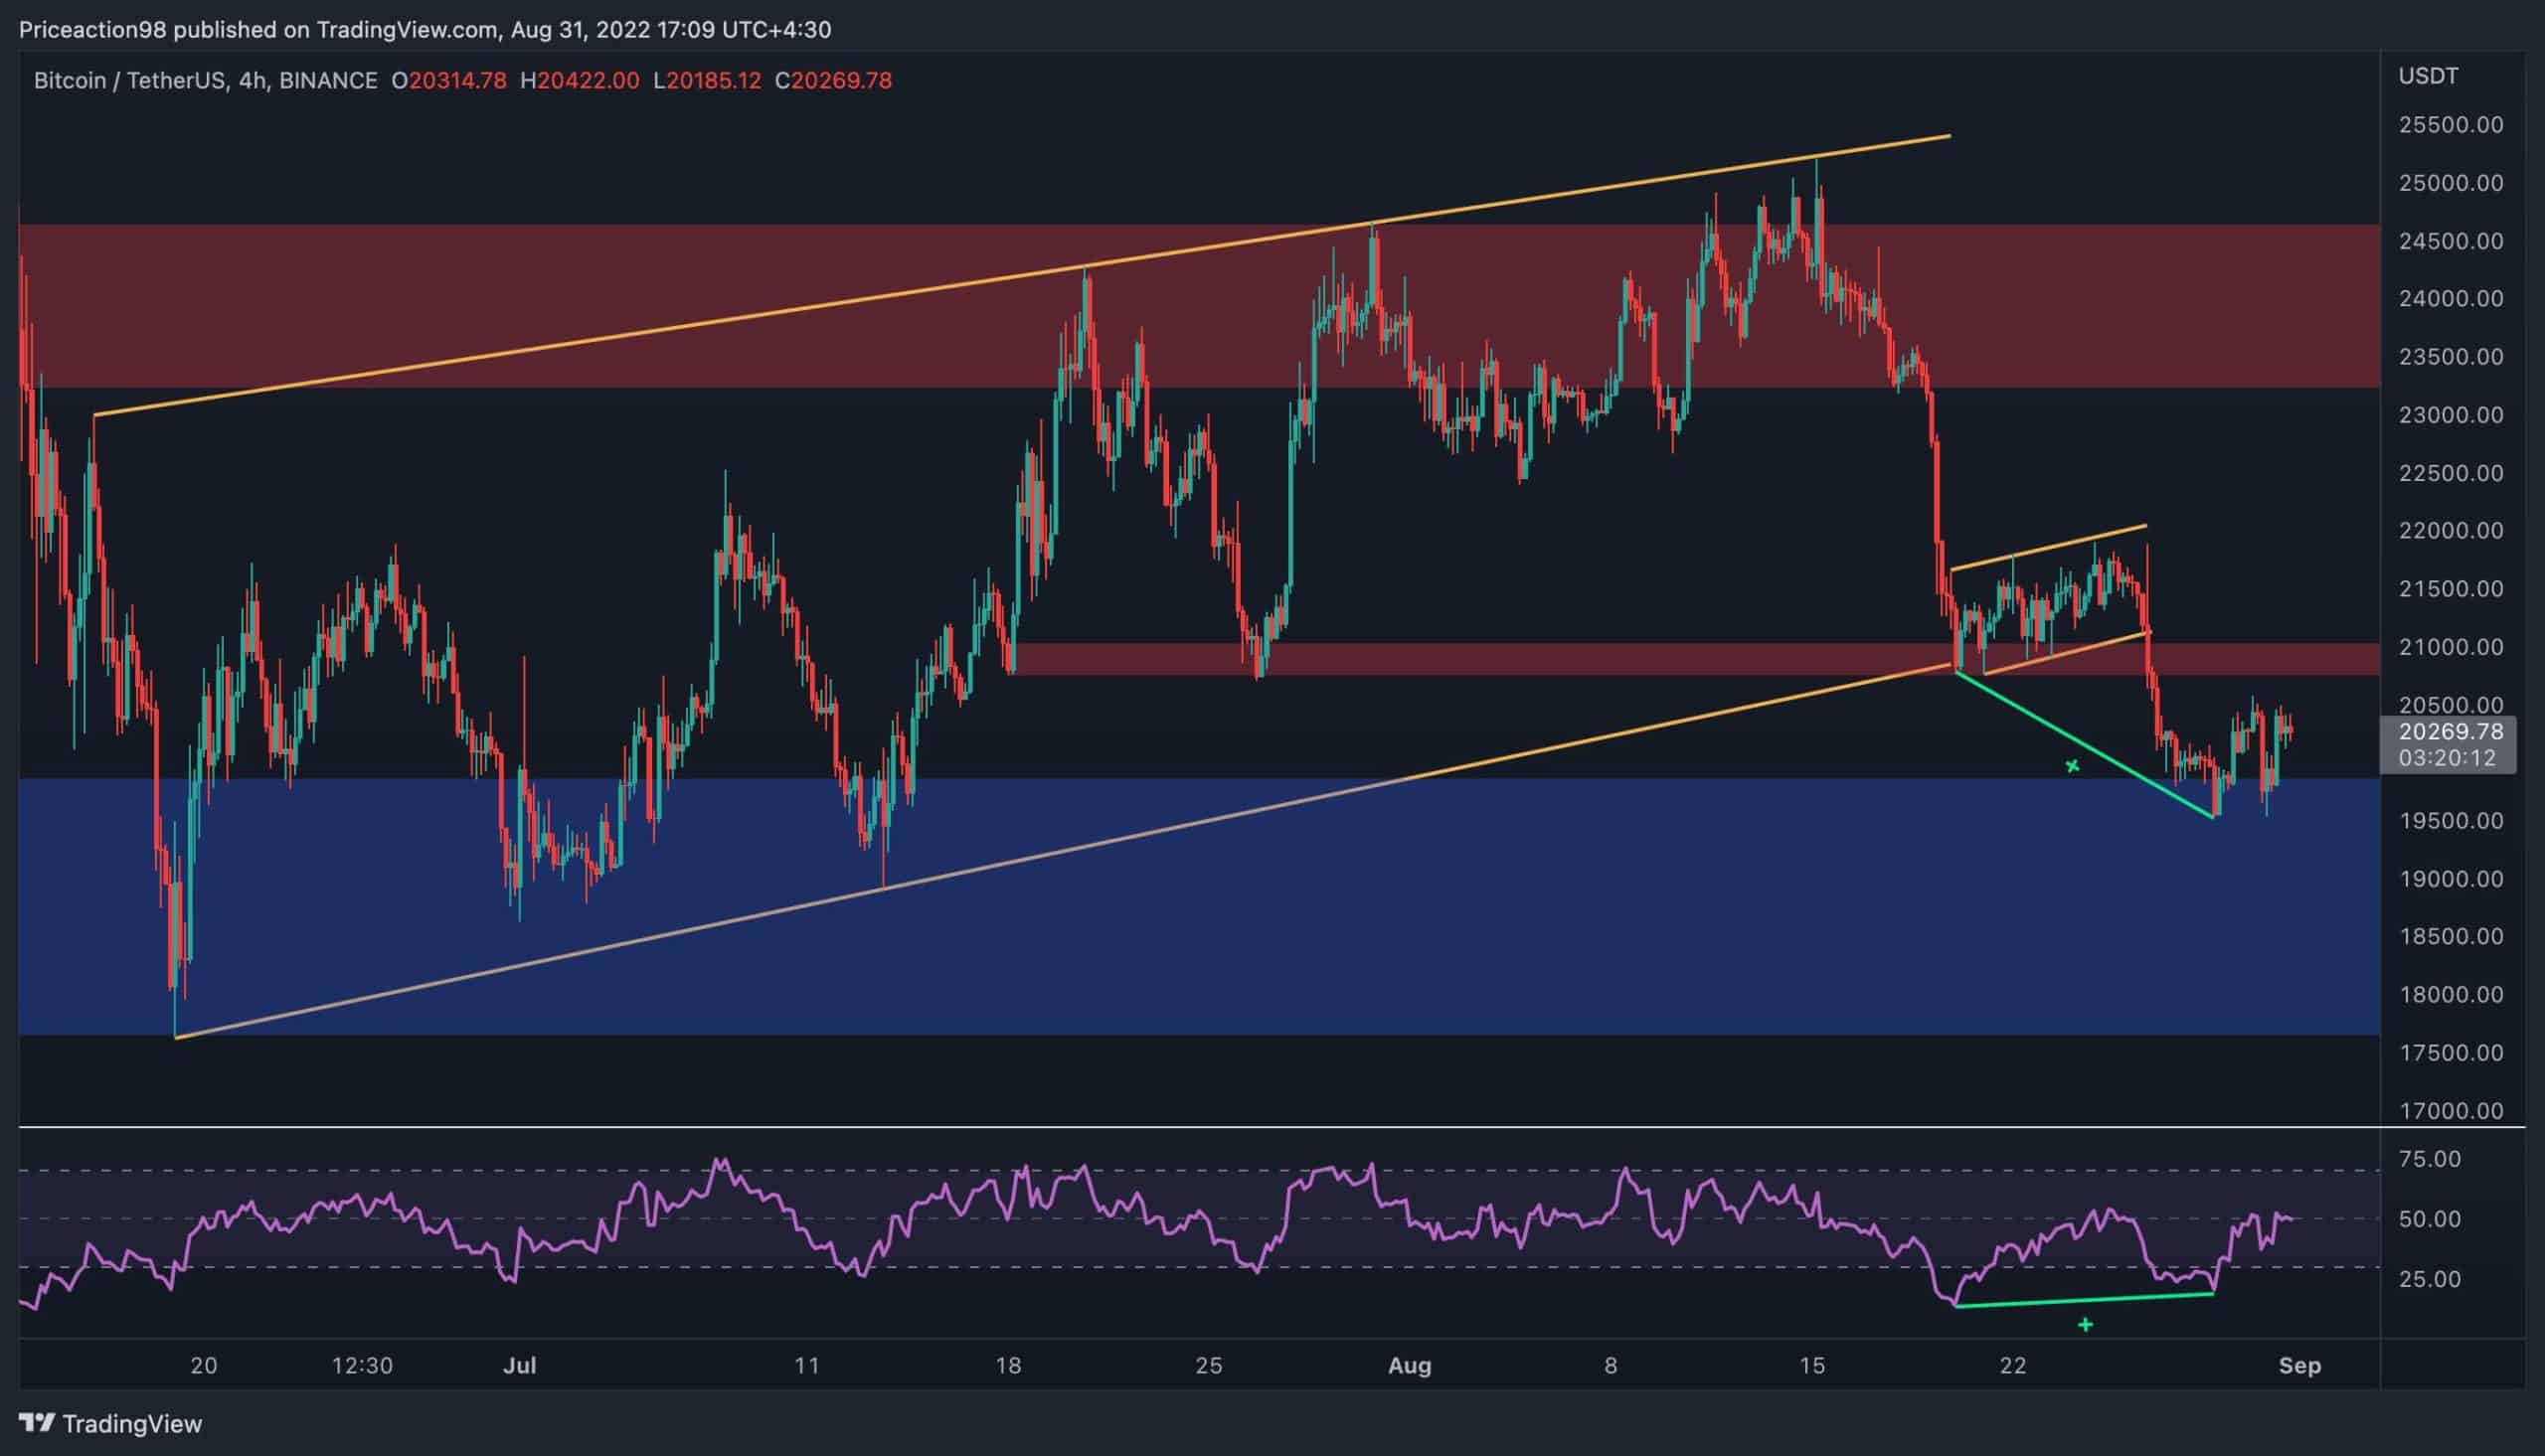
On the 4-hour timeframe, the price has broken the smaller bearish flag formed at the lower boundary of the larger flag to the downside. Consequently, it has dropped rapidly towards the $20K level. A bullish rebound is currently in play as the price has been supported at the mentioned level. As of now, a retest of the $21K resistance level seems imminent.
Interestingly, the RSI moving average has formed a massive bullish divergence between the two recent lows, pointing to a potential reversal from this area. However, no positive could be considered probable until the price breaks the $21K level to the upside convincingly.
The price action is still suggesting that the market structure is bearish. And so, the RSI signal could turn out to be a fake one.
Onchain Analysis
By Shayan
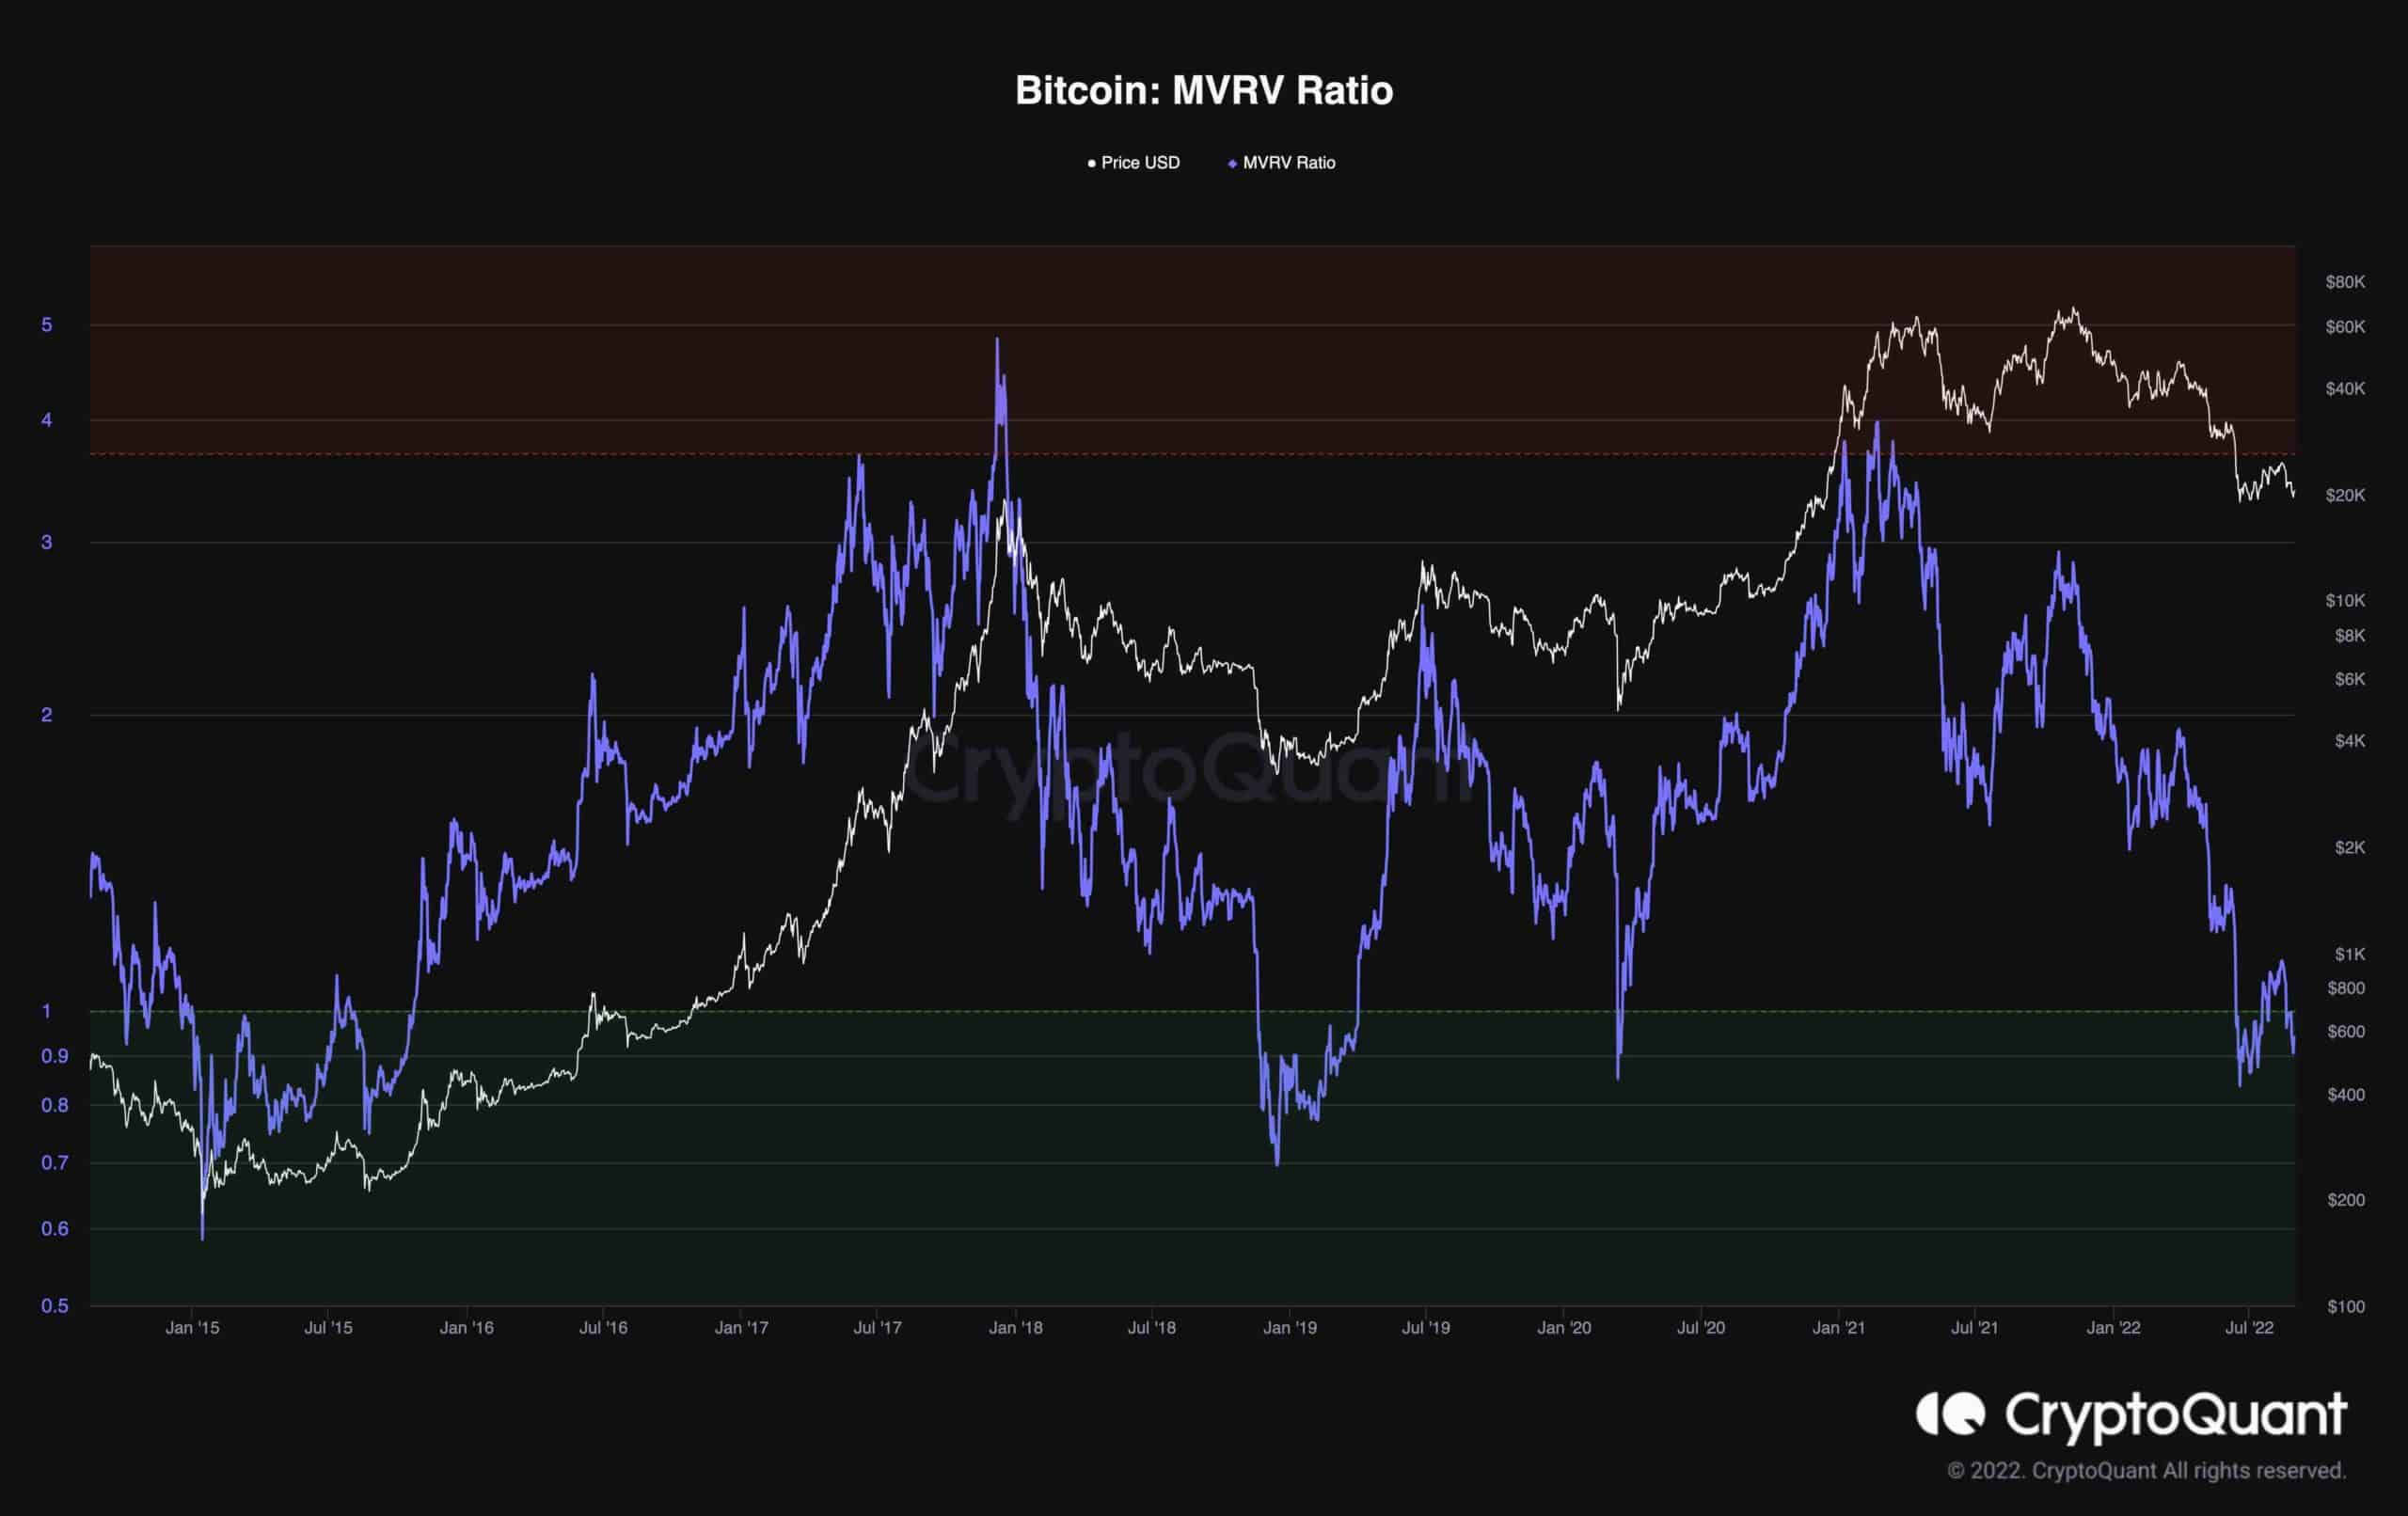
The market appears to be seeking direction, but the big players are standing still. Following last week’s FOMC meeting, Bitcoin plummeted below its “Realized Price,” a necessary threshold to defend. Meanwhile, the MVRV ratio has dropped below 1 again, and the bearish cycle seems far from over.
The MVRV ratio is a helpful metric for evaluating market sentiment. It allows us to follow Bitcoin’s price in relation to its realized value. It is calculated by dividing the market cap by the realized cap.
Values below 1 indicate that most market players are at an aggregated loss. Historically, the bear market bottoms have been formed while the MVRV had values below 1 for an extended time.
However, during the current bear market, the MVRV ratio has not dropped significantly compared to previous scenarios, as it has not reached values below 0.8. Furthermore, it could take more time for the market to find the bottom, as the capitulation phase often takes several months to end.
The conclusion is that BTC has likely failed to find a bottom yet.