Bitcoin price analysis is displaying a strong bearish sentiment as the price pattern continues to go downward. The low of $20,769 shows that the hourly charts are oversold and need a bounce back to balance technical indicators. The sellers need to reload their ammo and thus need a slight rise in price which can take the price near $21,500 level.
However, the buyers should not get too excited as the price is unable to reach above $23,000 resistance zone. The downside risks are very much there. The current price of BTC/USD is $21,290 with a strong bearish bias. The consolidation near the $21,000 lows is relatively small as the pair struggles to maintain key support levels.
Bitcoin price movement in the last 24 hours: $21,000 acts as a cushion for the pair
Bitcoin price analysis shows that the pair is oscillating between $20,200 to $20,800 with little sparks. The muted movement is a sign of consolidation of the long positions within the said defined range. The sideways price action will only help the bears create more short positions near the upper trendline of the Bollinger Bands.
The ‘Flag and Pole’ bearish pattern is aiding the bears to take down more support levels as the price moves deeper. The support level at $21,000 seems to the holding for at least now but the sellers are mounting pressure as the week progresses. Bitcoin price analysis shows that the bearish flag and pole pattern is building up and the price will soon challenge the $20k support zone.
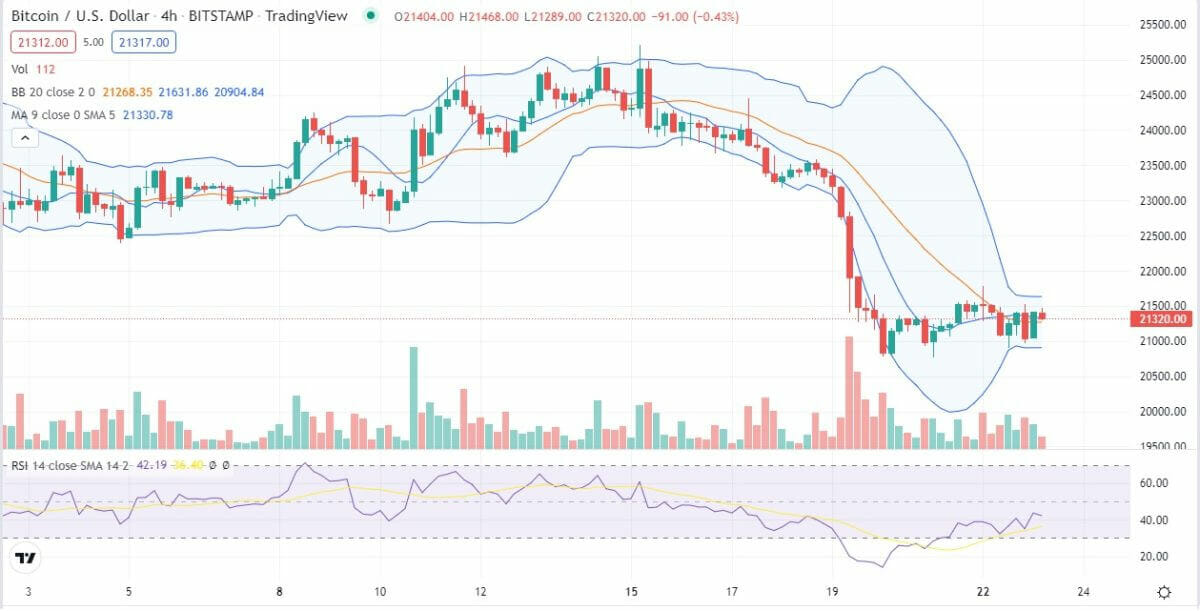
BTC/USD 4-hour chart: Above average volumes to determine direction
The volumes in the hourly BTC/USD time frame are declining but still remain above average. The declining channel is also taking volume and momentum along with it. The big money is not taking up large positions on either side of the trade. Also, the institutional investors are also nowhere to be seen in the last few weeks as per Bitcoin price analysis.
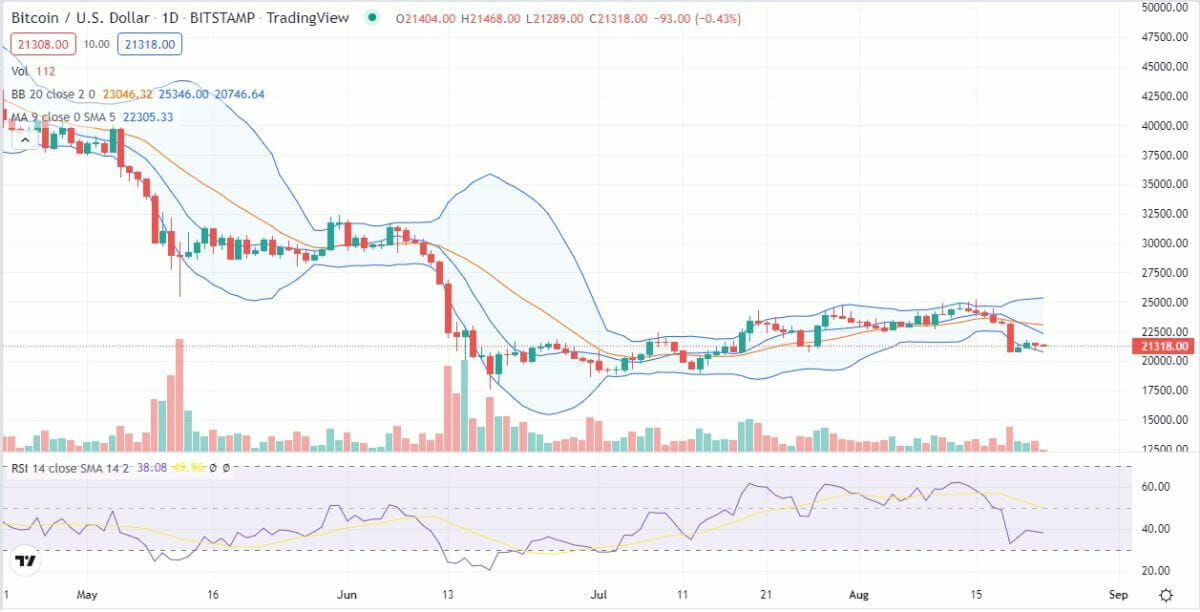
The downside is expected to last well below $19,800 price level. The lower lows pattern goes on to show the inherent weakness in the price. The Fibonacci Retracement from $32,000 is displaying a price level of $18,000 as the swing low. Since, the $25,000 psychological level is broken now, the price can certainly move towards $18k level in the long run. The RSI is barely holding above 30 level on the hourly charts.
Bitcoin price analysis conclusion: There’s only one way – down
The BTC/USD pair has broken below $20,790 which also happens to be the 50-day EMA. The price is unable to sustain confidently above the $22,000 level and the same is being exploited by the bears to create even more short positions.
The Bitcoin price analysis shows that hourly trends may display some bounce back but the long-term trend is definitely bearish. The probability of a fall is high and the downside break can take the price well below $21,000.
Disclaimer. The information provided is not trading advice. Cryptopolitan.com holds no liability for any investments made based on the information provided on this page. We strongly recommend independent research and/or consultation with a qualified professional before making any investment decisions.