Bitcoin had seen a short-term uptrend, which acted as a correction to the longer term’s downside action, which lasted for the past months. However, this rally might have come to its end.
Technical Analysis
By Shayan
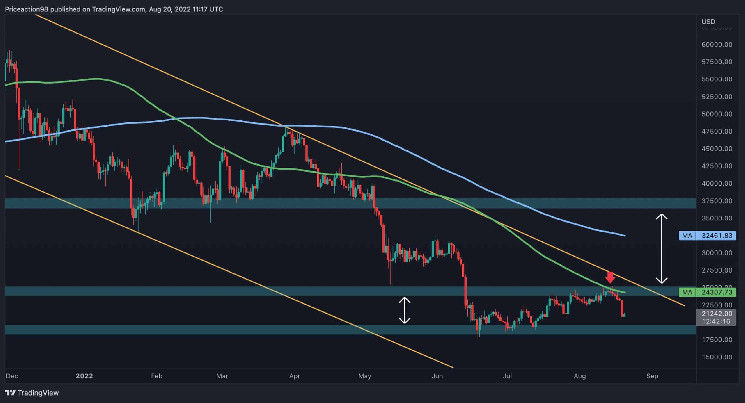
The Daily Chart
The 100-day moving average (roughly at $24K) has acted as a strong resistance zone and rejected the price action. The outcome was a massive breakdown from BTC’s prng low.
A breakout from alow typically signals a bearish reversal as most of the sell stops lie below the mentioned swing.
Over a longer period, Bitcoin will likely enter a consolidation phase between the $18K and $25K levels. From the bullish side, only a breakout above the 100-day and the 200-day moving averages – currently trading around $24K and $33K – would be essential to officially get the ball rolling on a new bull market.
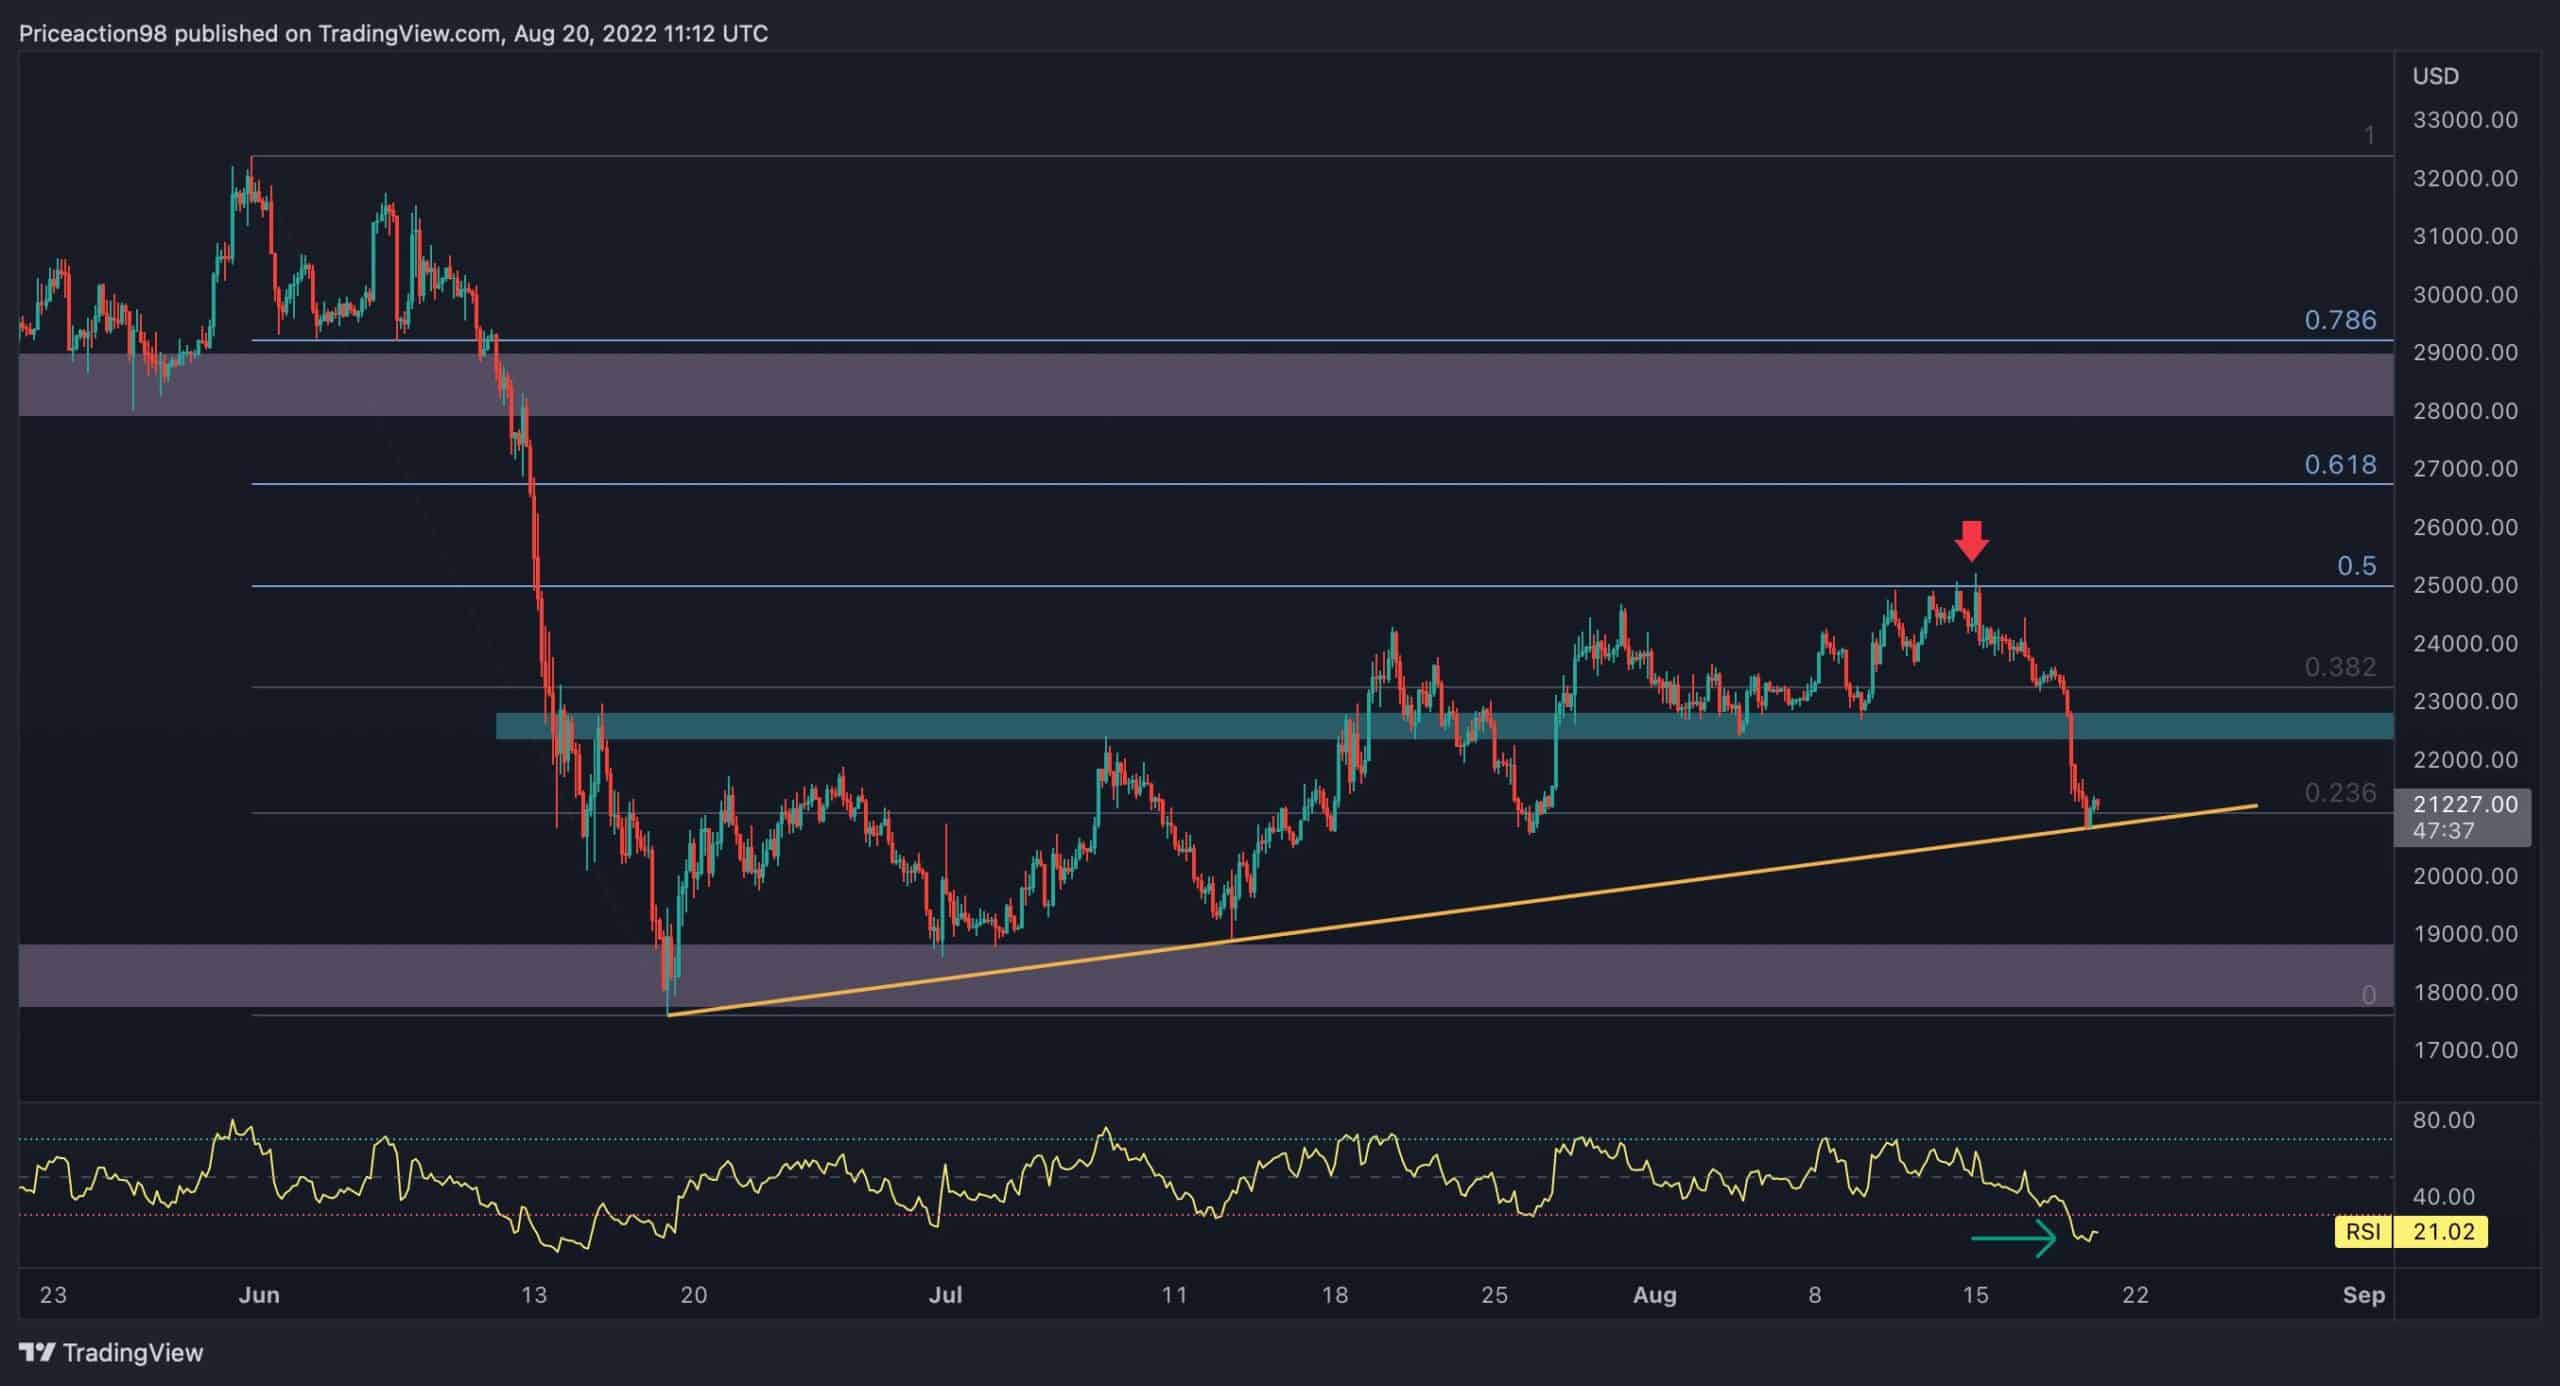
The 4-Hour Chart
On the 4-hour timeframe, Bitcoin got rejected from the 0.5 Fibonacci level after seeing a 50% correction of its recent bearish expansion move. The price experienced a massive shThereakinghass prior low as it triggered numerous sell stops.
Currently, the price had plummeted to the wedge’s lower boundary at $21K and is struggling to hold above it. In case of a bearish breakout – a continuation towards a retest of the $18K level is likely.
In addition, the RSI indicator has dropped to the oversold region due to the massive shakeout. This recent price action indicates that BTC may form a bullish continuation correction before attempting to break the wedge’s lower boundary.
On-chain Analysis
By: Edris
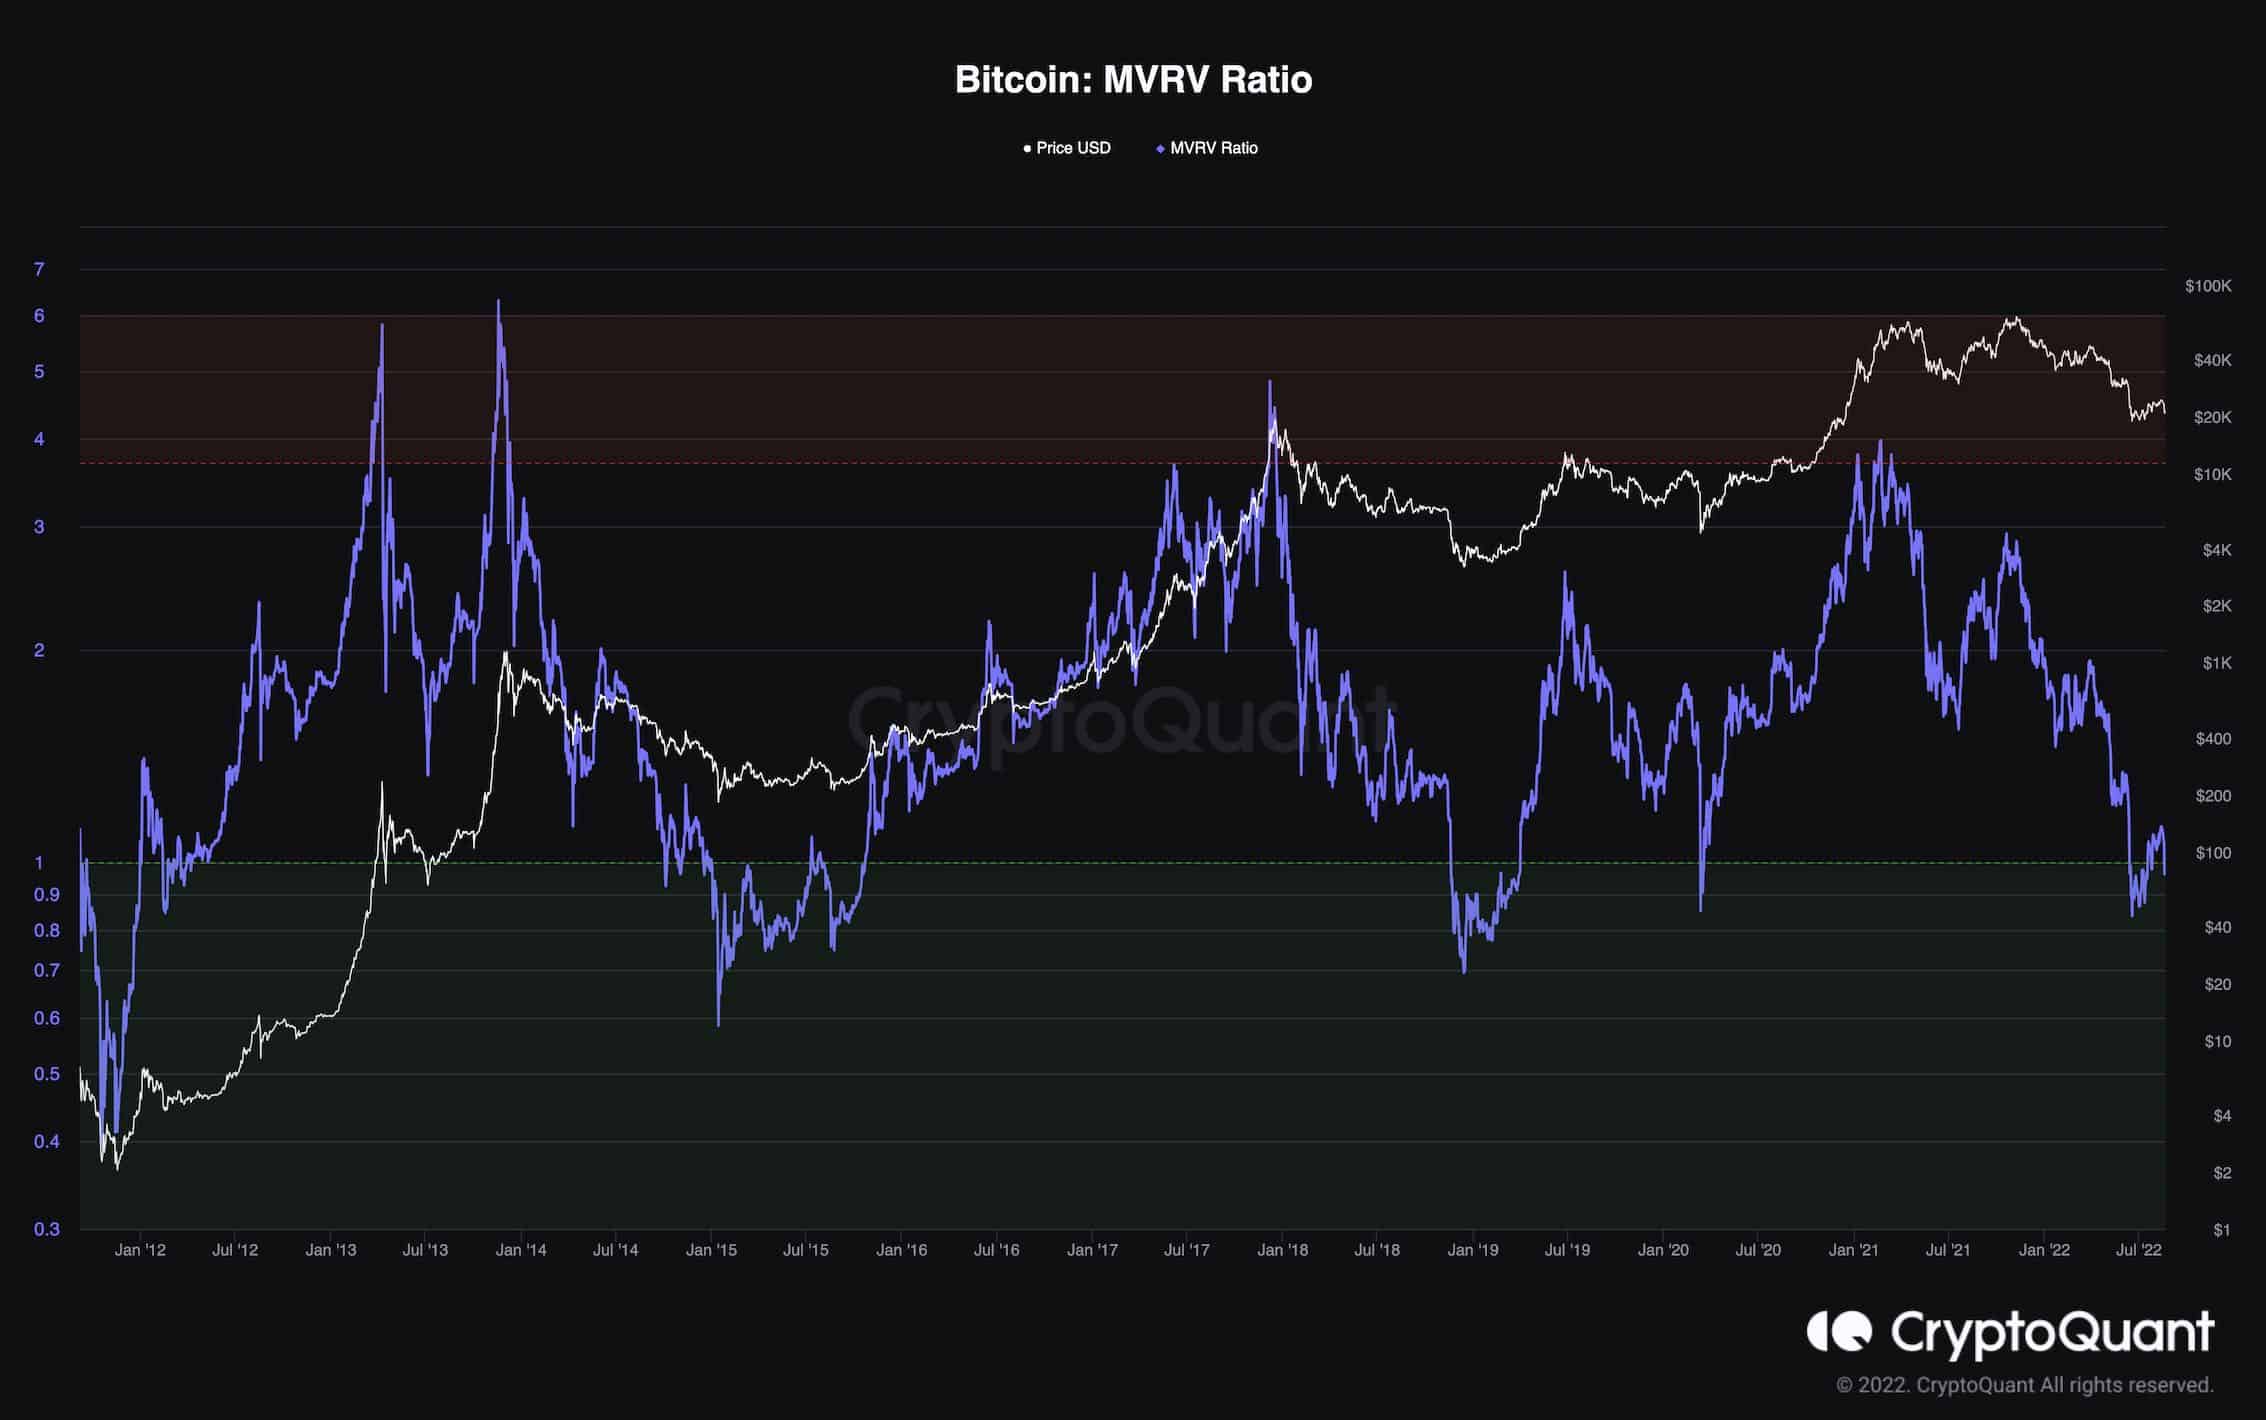
Bitcoin: MVRV Ratio
Bitcoin’s recent rebound seems to end as the price experienced a rapid drop over the past 48 hours. Meanwhile, the MVRV ratio has dropped below 1 once again, and the bear markets seem far from over.
The MVRV ratio is a valuable metric for evaluating the macro market sentiment. It is calculated by dividing the market cap by the realized cap.
Values below 1 indicate that most market participants are at a loss. It should be mentioned that bear market bottoms have been formed historically while the MVRV had values below 1 for an extensive amount of time.
However, during the current bear market, the MVRV ratio has not dropped below one as frequently compared to previous bear markets as it has not reached values below 0.8.
Furthermore, it could take more time for the market to find the bottom, as major accumulation periods often take several months to finish. The result is that the bottom may not be in, and more downside and a lengthier bear market could be expected.