Key highlights:
- Bitcoin fell by a steep 9% today as the cryptocurrency set a new low for August at $21,270
- The recent price drop caused BTC/USD to fall beneath a rising price channel that it has been trading within since the start of July
- It seems that rising inflation is continuing to provide major uncertainty within the market
| Bitcoin price | $21,370 |
| Key BTC resistance levels | $21,600, $22,650, $23,00, $24,000, $24,235, $25,000, $24,420, $26,000 |
| Key BTC support levels | $21,330, $21,00, $20,700, $20,500, $20,160, $20,00, $19,720, $19,000, $18,585 |
*Price at the time of publication
Bitcoin plummeted 9% today, causing the number one ranked cryptocurrency to break beneath a rising price channel and set a fresh new low for August at $21,270. The flash crash comes after Bitcoin showed a few weeks of bullish momentum, in which price action began to produce higher highs and lows for the first time since the start of the year.
Inflation seems to be the dominant narrative regarding the most recent price collapse, as it continues to provide uncertainty for the markets moving forward across the globe.
In addition, the market had provided hints that the previous bullish momentum was fading at the start of the week. As a result, the cryptocurrency hit resistance at the 100-day MA level on Sunday and could not overcome the level as the week started.
Today’s market drawdown was primarily driven by the European Central Bank releasing its highest ever inflation reading. For July 2022, the EU printed a 9.8% hike in inflation, up from the previous 9.6% year-on-year in June. To put this into context, last year’s July inflation reading was just 2.5%.
The EU inflation number came a day after the United Kingdom recorded the first double-digit inflation reading since 1980. The UK’s inflation data came in at 10.1%, marking the highest inflation in the nation for 40 years.
With Bitcoin breaking beneath the previous rising price channel, it seems that analysts are becoming increasingly bearish. For example, Il Capo of Crypto, a prominent Twitter analyst with 480,000 followers, recently stated that he believes new lows are incoming, and it’s just a matter of time.
$BTC
— il Capo Of Crypto (@CryptoCapo_) August 19, 2022
Second option playing out. Any test of 23500 as resistance is a good sell opportunity.
Consolidation below 22500 (clean break + use the level as resistance) would be very bearish = 21k or lower
New lows are just a matter of time. https://t.co/MzxrDCZuiZ pic.twitter.com/I5PatYduNW
Today’s price capitulation caused over $31 billion to flow out of the total cryptocurrency sector’s market cap as it dropped back to $1.02 trillion. In addition, around $400 million worth of long positions were liquidated during the price collapse.
With that in mind, let us take a closer look at the charts and see the potential support and resistance areas moving forward.
Bitcoin Price Analysis
BTC/USD - DAILY CHART - MEDIUM TERM
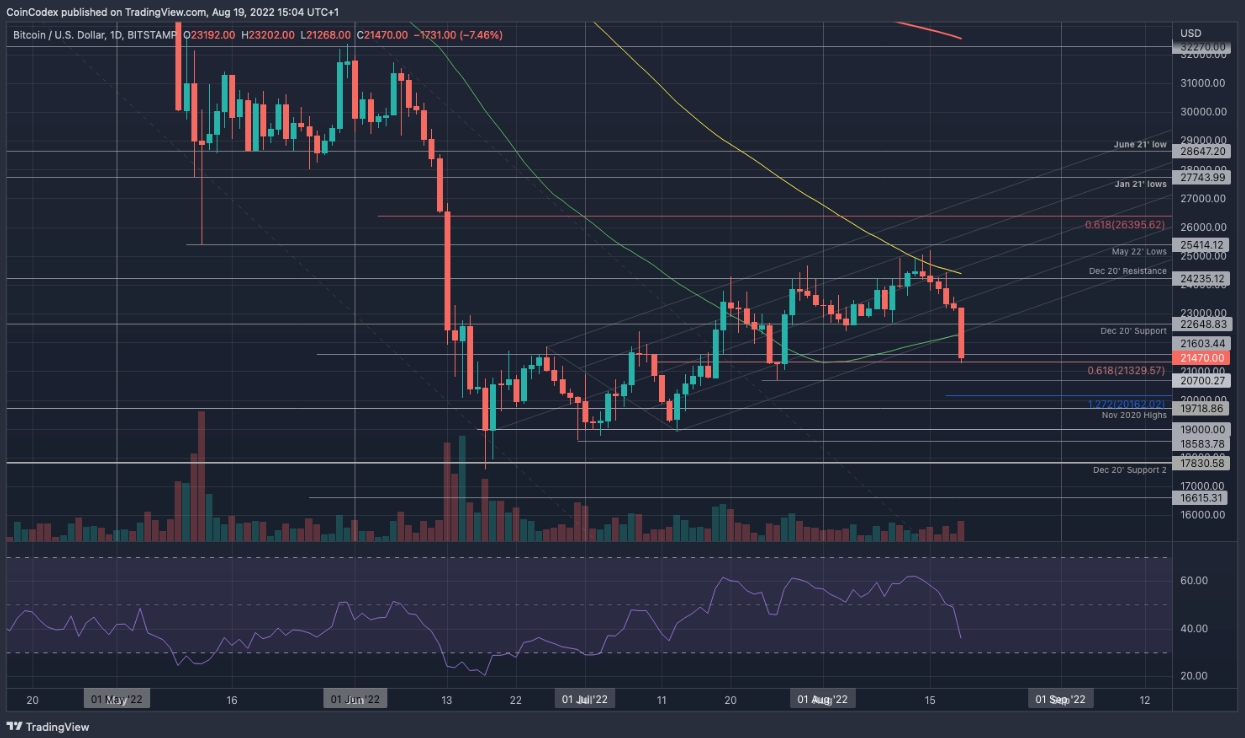
Image source: TradingView
What has been going on?
The daily chart above shows the magnitude of today’s price collapse, causing an end to the previous short-term bullish note the market had established.
We can see that BTC/USD hit a low of around $18,000 in June and started to grind higher from there slowly. Then, in July, it established an ascending pitchfork rising channel, and continued to trade inside the boundaries of this pitchfork for the entire month.
Toward the end of July, BTC struggled to close a daily candle above resistance at $24,000. As a result, BTC headed lower in the first few days of August but managed to hold the support at $22,650 (December 2020 support).
It eventually rebounded from $22,650 and headed higher to break resistance at $24,000. However, it found additional resistance at the 100-day MA level toward mid-August and failed to break above it.
It rolled over from the 100-day MA at the start of the week and has been heading lower ever since.
Today’s price collapse caused BTC to fall beneath the lower angle of the price channel. It continued to fall until support was found at $21,330 - provided by a .618 Fib Retracement.
Bitcoin price short-term prediction: Bearish
The break of the channel has ended any short-term bullish hope in the market. The market is now bearish and would need to overcome resistance at $25,000 to turn bullish again. A break beneath the support at $20,700 could send Bitcoin into a bearish spiral that could result in the asset hitting new lows for 2022 again.
So, where are we heading next?
With the magnitude of today’s price collapse, the only direction the market can head is lower. Unfortunately, the current support at $21,330 (.618 Fib) is unlikely to hold over the weekend, and we should expect BTC to break beneath it at some point.
If the bears do push beneath $21,330, the first level of support lies at $21,000. This is followed by support at $20,700, $20,160 (downside 1.272 Fib Extension), and $20,000.
If the bearish pressure continues to push BTC beneath $20,000, added support can be expected at $19,720 (November 2020 highs), $19,000, $18,585, and $17,830 (December 2020 support).
On the other side, the first level of resistance now lies at $22,000. This is followed by resistance at $22,200 (50-day MA), $22,650 (December 2020 support), $23,000, and $24,000 (100-day MA).
Adding further to the bearish sentiment, the RSI has now slipped back beneath the midline and is now at the lowest level since mid-July. This means that the bearish momentum is back in control, and we can expect them to drag the market lower.
According to our automatically generated Bitcoin price predictions, the world's oldest digital currency could see a substantial period of sideways consolidation around the $20,000 range. However, judging by the current state of a number of popular technical indicators, Bitcoin could see a substantial price uptrend toward the end of the year.