Be[In]Crypto takes a look at the five cryptocurrencies that decreased the most last week, more specifically, from July 29 to Aug 5.
These cryptocurrencies are:
- Flow (FLOW) : 47.94%
- Filecoin (FIL) : 39.59%
- Optimism (OP) : 28.86%
- Chiliz (CHZ) : 23.87%
- Yearn.Finance (YFI) : 22.37%
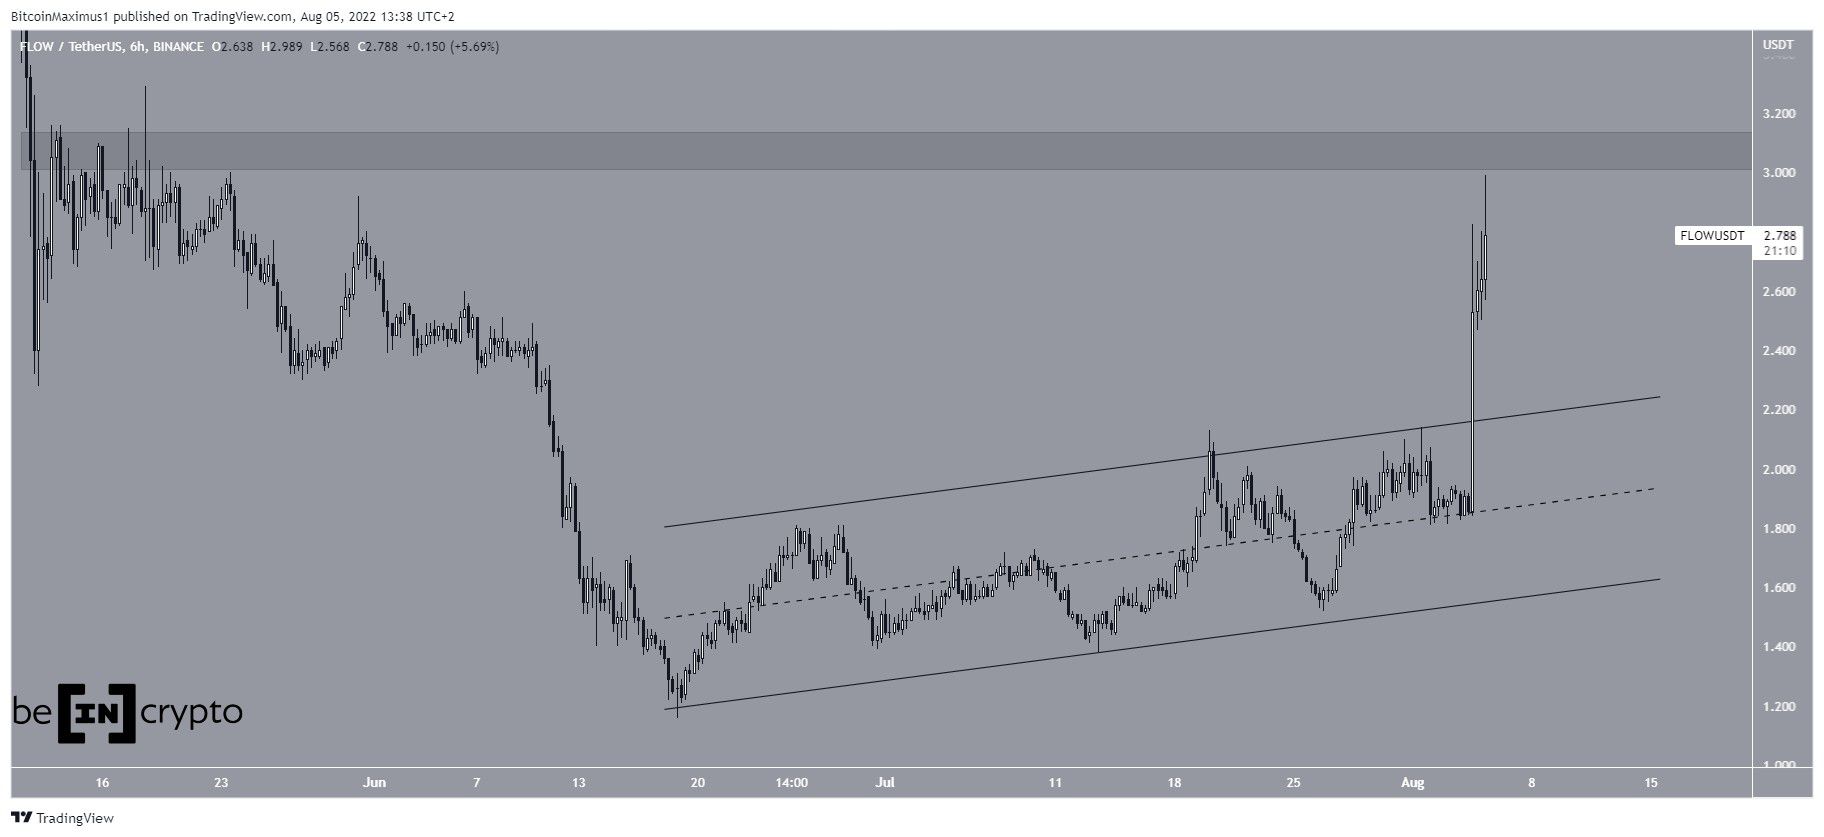
FLOW
FLOW had been increasing inside an ascending parallel channel since June 18. It managed to break out from it on Aug 4 and reached a high of $2.98 the next day.
FLOW barely failed to reach the main resistance area at $3.10.
If it manages to break out from it, the rate of increase could greatly accelerate due to the lack of overhead resistance above $3.10.
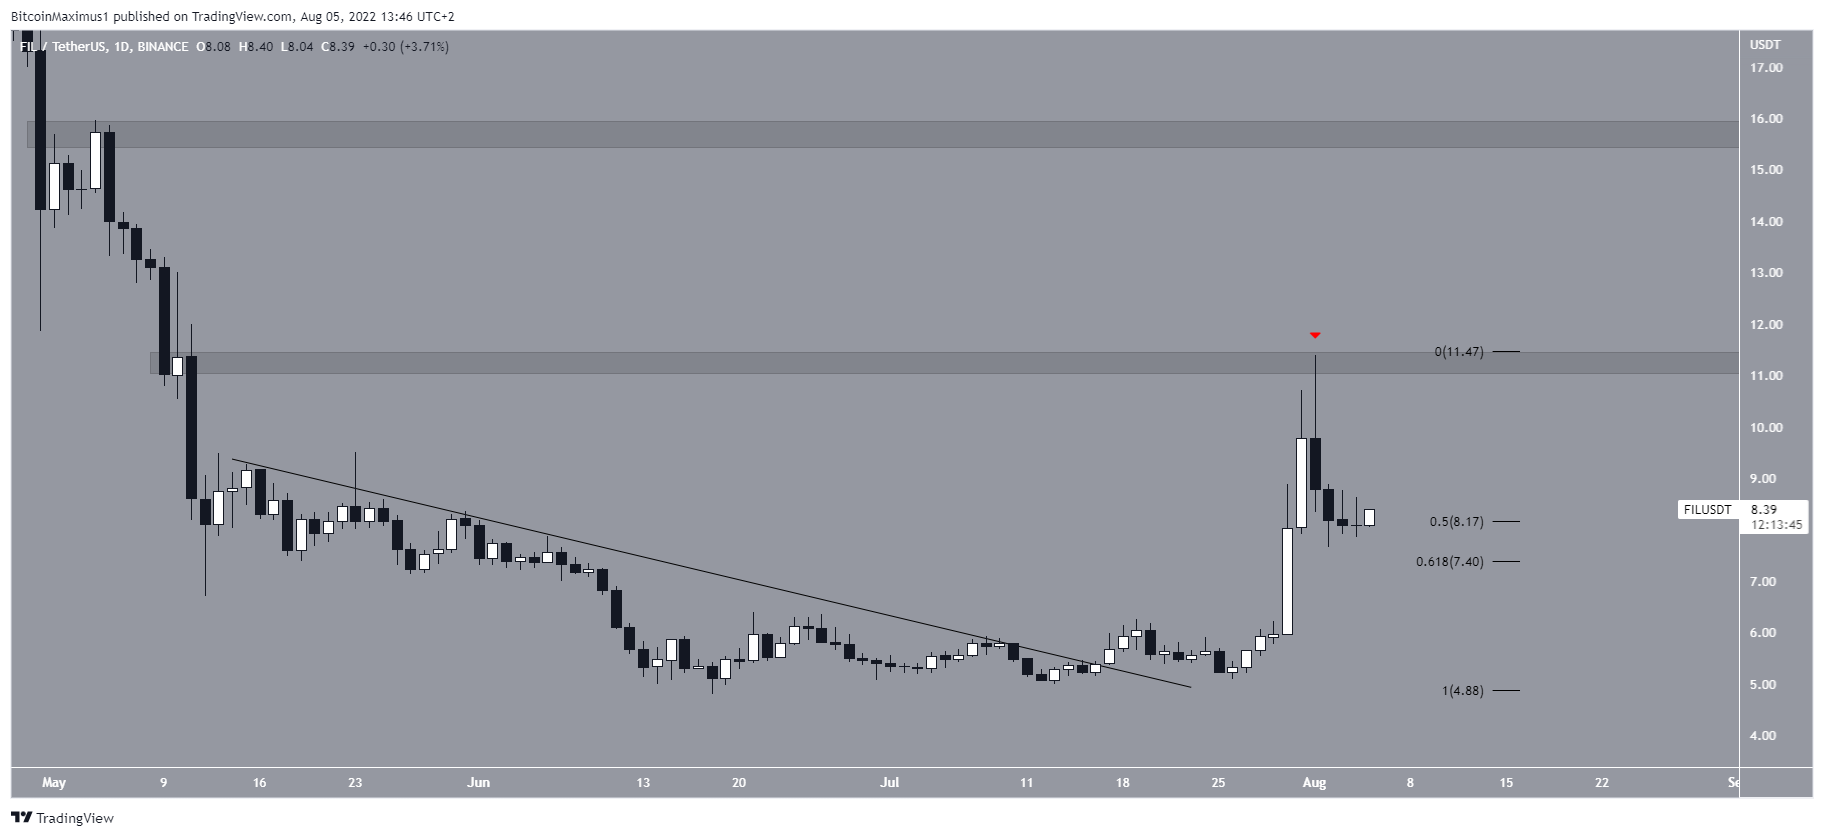
FIL
FIL has been gradually moving upwards since June 18. It broke out from a descending resistance line on July 17 and accelerated its rate of increase afterwards. This led to a high of $11.39 on Aug 1. However, it was rejected by the $11.25 horizontal resistance area and has been decreasing since.
The most likely area to provide support is between $7.40 and $8.20, created by the 0.5-0.618 Fib retracement support level.
Conversely, the next resistance area is at $15.80.
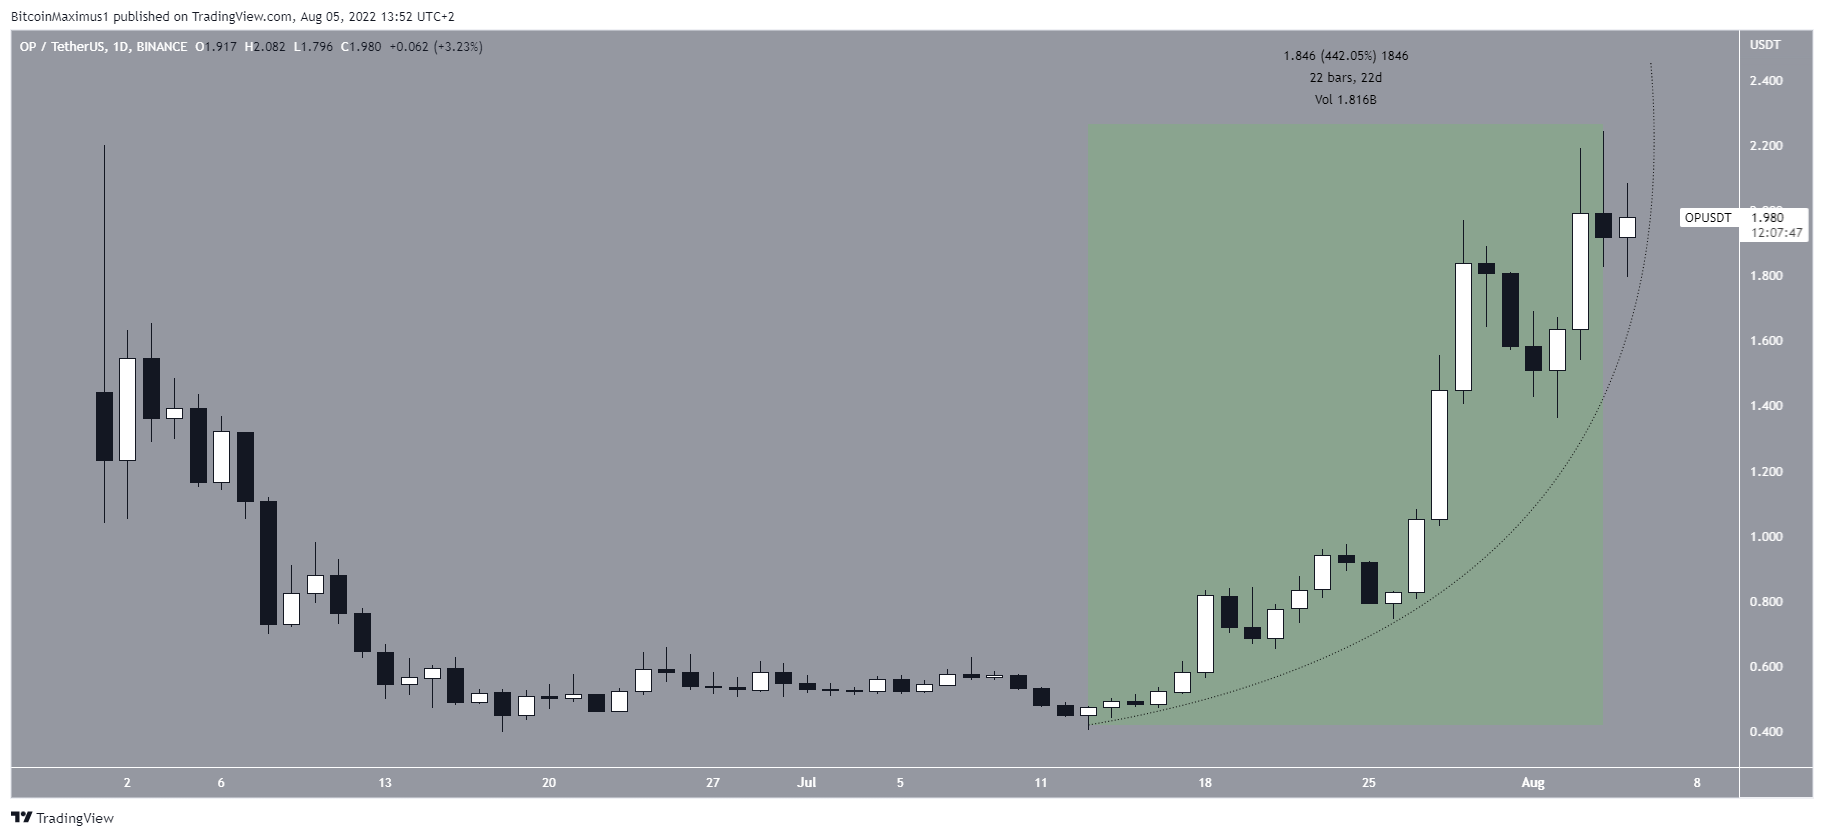
OP
OP has been increasing alongside an ascending parabolic support line since July 13. In a period of 22 days, the price has increased by 440%. This led to a new all-time high price of $2.25 on Aug 4.
While the price has decreased slightly since, the parabolic support line is still intact and so is the bullish trend.
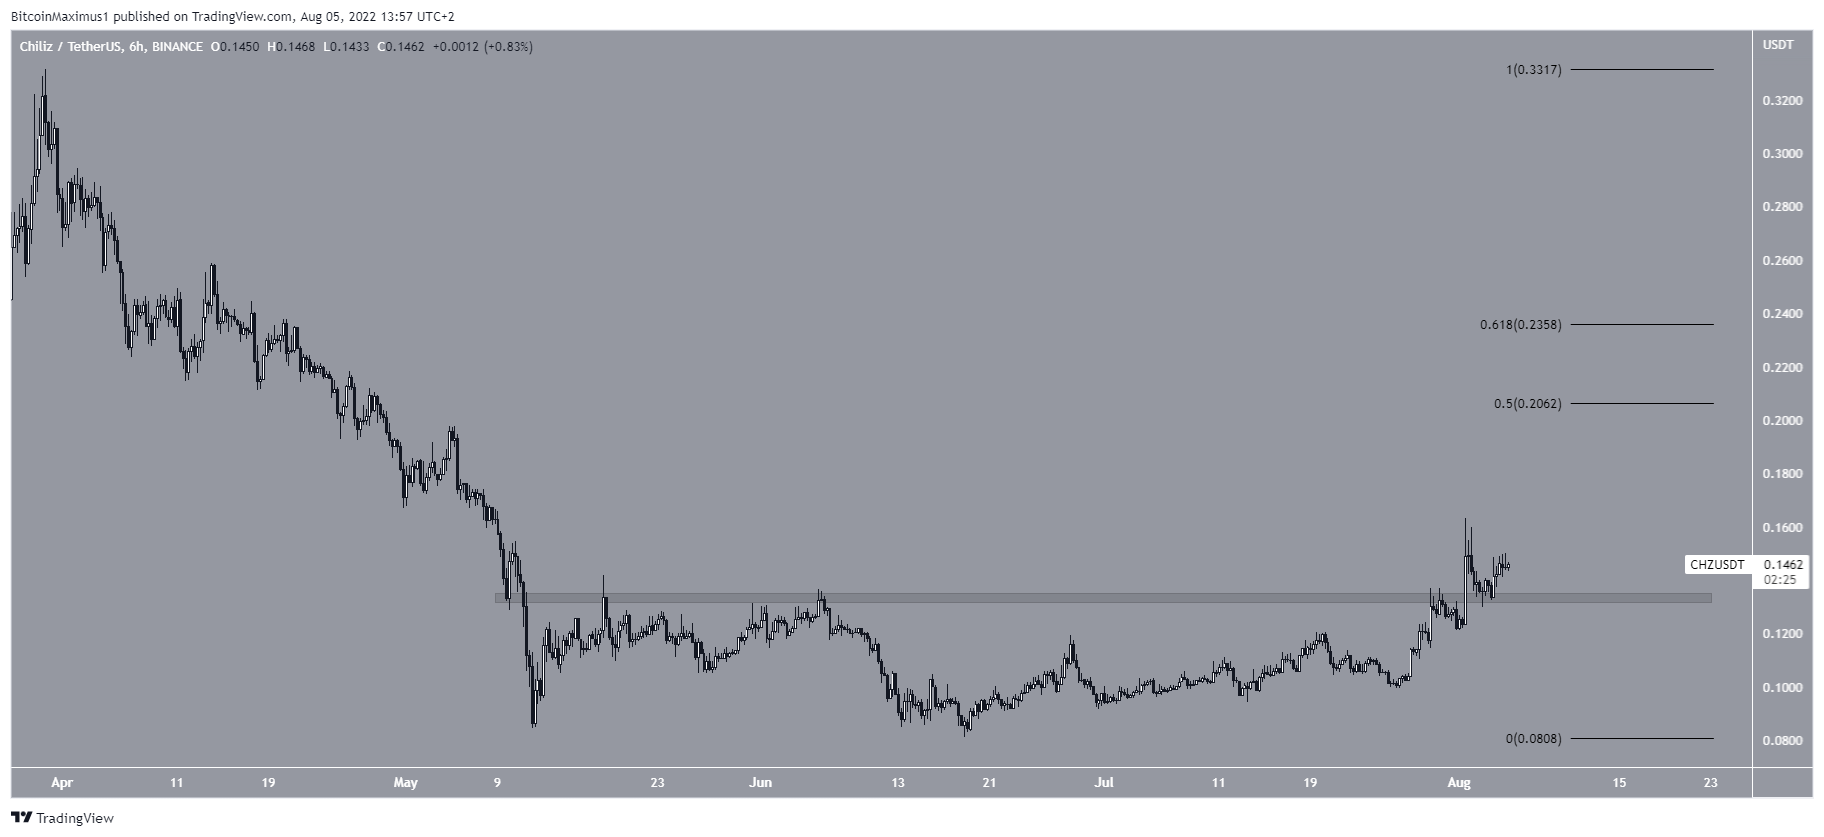
CHZ
CHZ has been increasing since June 18. On Aug 1, it broke out from the $0.134 horizontal resistance area and validated it as support the next day.
If the upward movement continues, the next closest resistance area will be between $0.205 – $0.235. This is created by the 0.5-0.618 Fib retracement resistance levels.
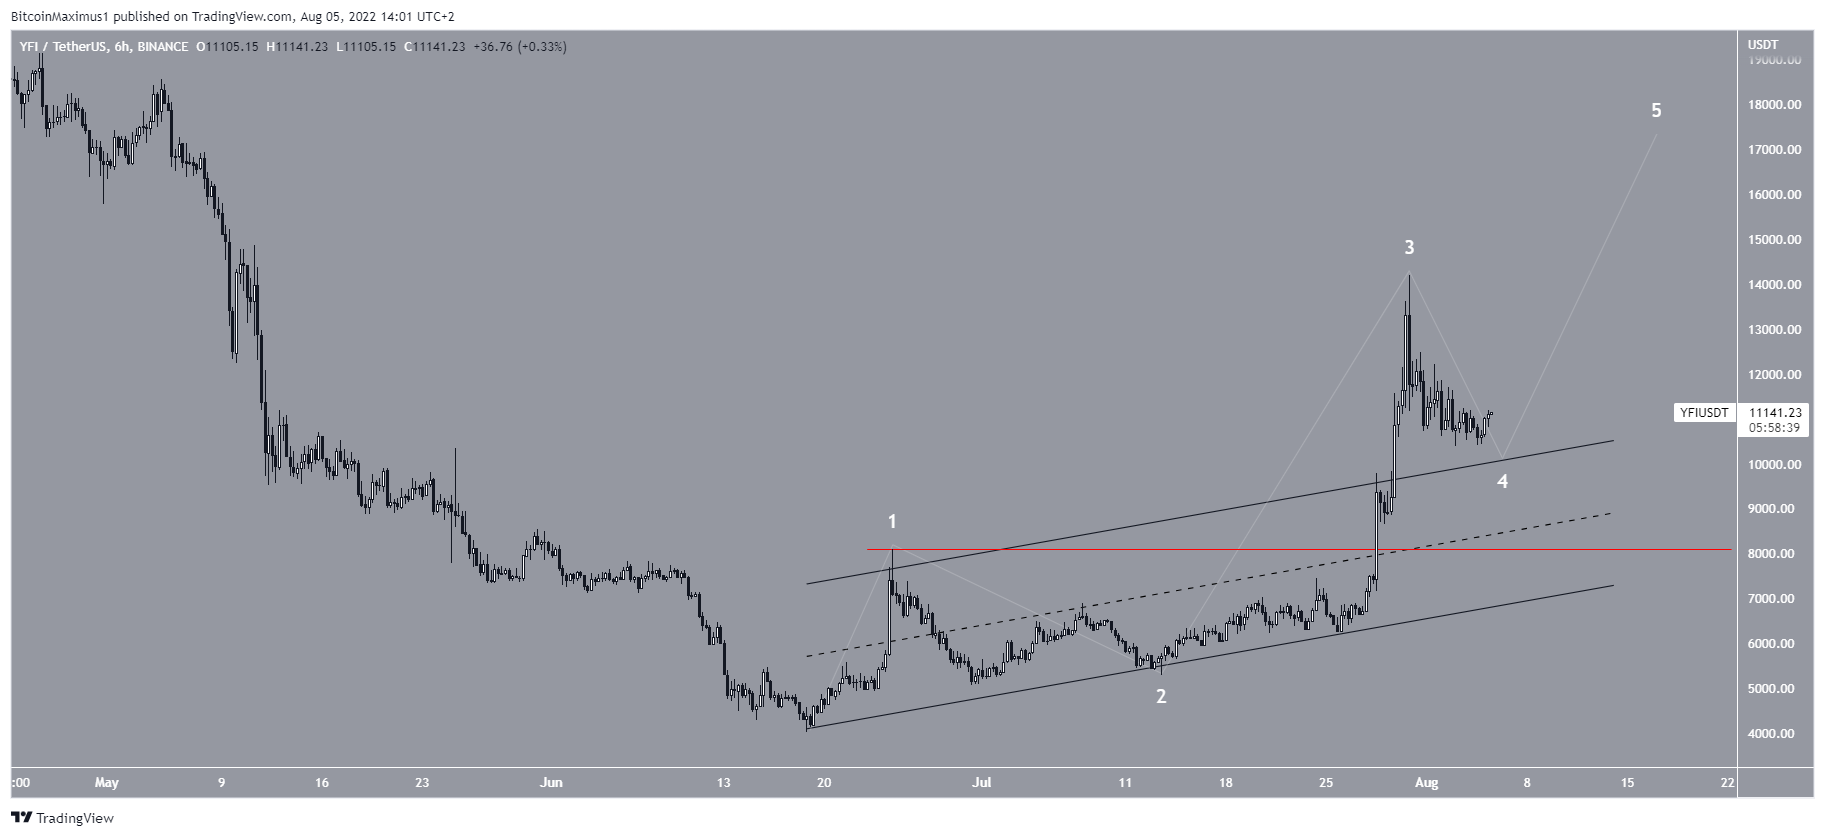
YFI
YFI had been increasing inside an ascending parallel channel since June 18. It broke out from this channel on July 29 and reached a high of $14,200 the next day.
The price has been decreasing since, and is in the process of validating the resistance line of the channel, completing a fourth-wave pullback. If successful, this would lead to another upward movement towards $17,000.
A decrease below the wave one high (red line) at $8,087 would invalidate this particular wave count.
For Be[in]Crypto’s latest Bitcoin (BTC) analysis, click here