The BTG price shows a successful post-retest reversal from $26.55, teasing a bull run to $37 if the market value exceeds the $30 resistance level.
Key Technical Points:
- The Bitcoin Gold (BTG) prices show lower price rejection resulting in a jump of 11.46% in the last 24 hours.
- The last night reversal is a successful retest of the rounding bottom breakout with a neckline at $26.55.
- With a market cap of $523 million, the Bitcoin Gold prices are trading 68% lower than the 52-week high of $94.49.
Past Performance of BTG
As warned as a possibility in our previous article, the BTG prices show a bearish reversal from the $37 resistance level to retest the $26.5 support level. Hence the bitcoin gold prices are down by 18% over the last four days, but due to last night's lower price rejection, the 24-hour percentage change is +11%. Furthermore, the lower price rejection successfully retests the bullish breakout of a rounding bottom pattern. Currently, the prices face resistance from the $30 horizontal level, evident by the wick formation in the daily candles. 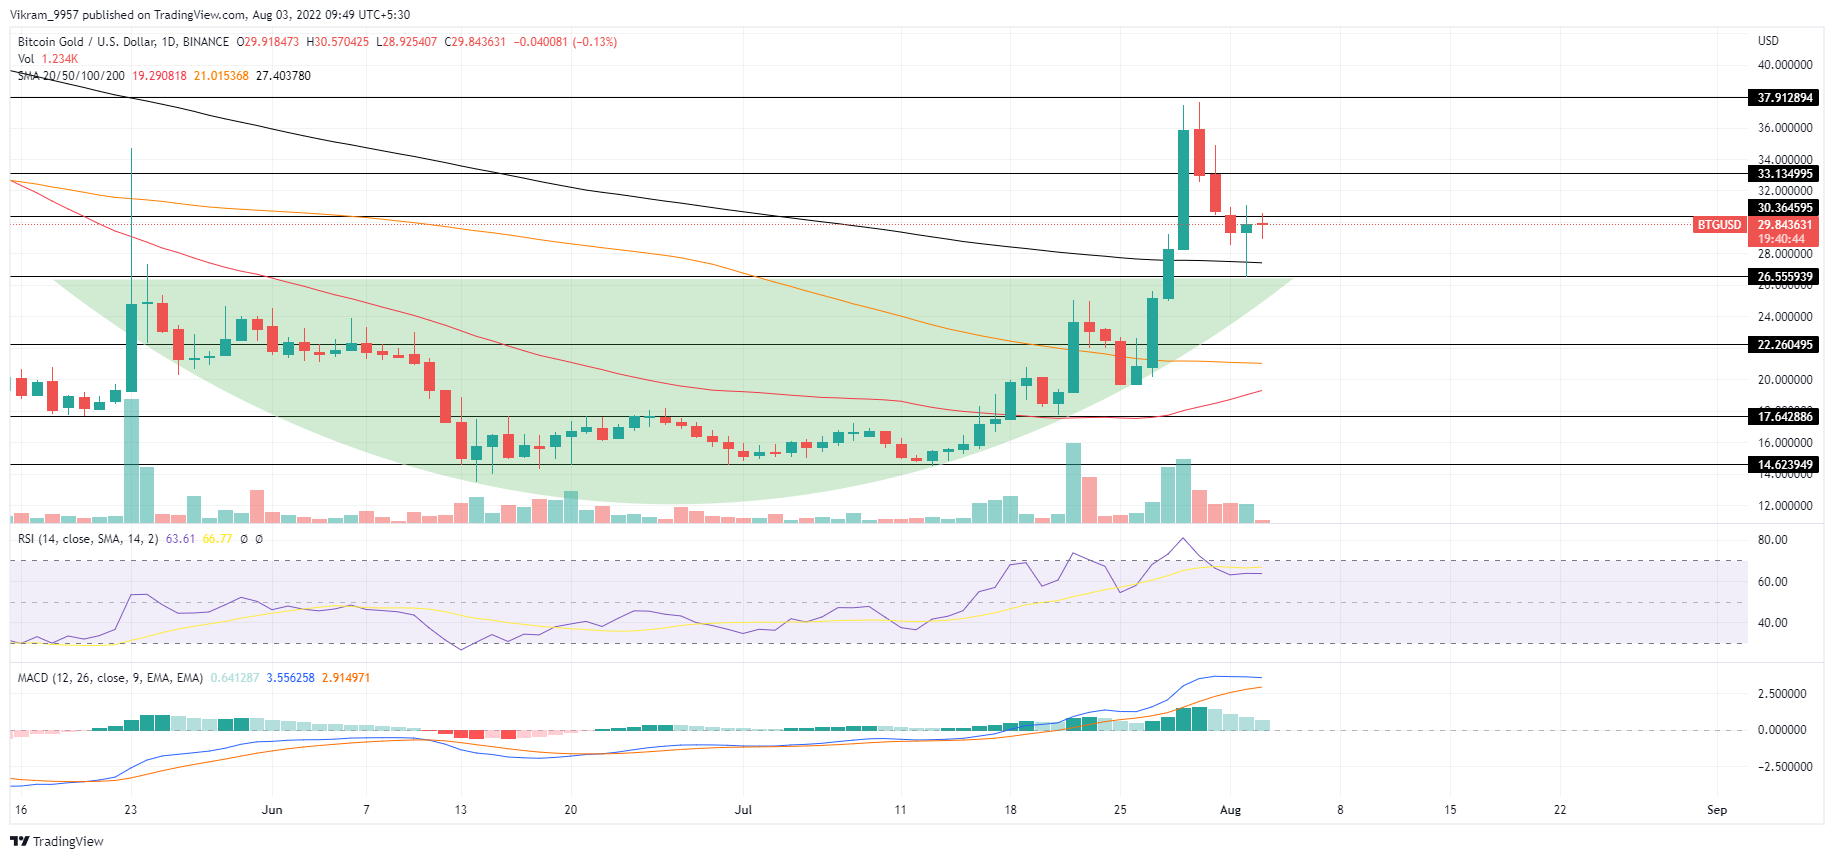 Source - Tradingview
BTG Technical Analysis
As the BTG prices take a bullish reversal, traders can expect the $30 breakout rally to retest the weekly high of $37. However, due to the volatile market conditions, traders must wait for a price action confirmation to avoid traps. With the low price rejection, Bitcoin Gold tests the 200-day SMA and sustains above it, resulting in an increased bullish influence over the 50 and 100-day SMA. Hence we can shortly see a bullish crossover of the 50 and 100-day SMA if the positive trend continues. The RSI slope maintains a lateral trend in the nearly overbought zone after falling below the 70% boundary. Moreover, the MACD indicator displays a lack of bullish spread between the fast and slow lines easing a potential bearish crossover. Hence the technical indicators reflect a weakness in the underlying bullishness, which may soon change with the $30 breakout. In a nutshell, the BTG technical analysis suggests traders should wait for the price action confirmation as the price analysis opposes the technical indicators.
Upcoming Trend
If the Bitcoin Gold prices rise above the $30 resistance level, an uptrend continuation to the previous swing high of $37 seems likely. Traders can even expect a bullish breakout of $37 if the buying pressure increases, resulting in the price jump to $45. Conversely, with a bullish failure to exceed the $30 mark, the BTG prices will likely retest the bottom support of $26.5. Resistance Levels: $30 and $37 Support Levels: $26.5 and $22