Polkadot price analysis has turned bearish today, as price dropped more than 9 percent over the past 24 hours. DOT seemed to be targeting the $10 resistance after embarking on a strong bull run that initiated on July 26, 2022. During this spell, Polkadot rose up to $9.20 only yesterday, before seller pressure broke the uptrend to correct price down to $8.08. The evening star pattern on the daily chart confirms the change of trend, while the $8 support still remains crucial. If price moves below this point, a steep decline down towards next support at $6.5 could take place.
The larger cryptocurrency market also moved to show bearish signs today, led by Bitcoin’s 3 percent decline to put price back below the $23,000 mark. Ethereum also dropped down to $1,600 with a 5 percent decline. Among leading Altcoins, Cardano slipped 6 percent to $0.50, while Ripple dropped the same amount to move down to $0.37. Dogecoin decreased 5 percent to sit at $0.06, whereas Solana lost 7 percent to move as low as $41.12.
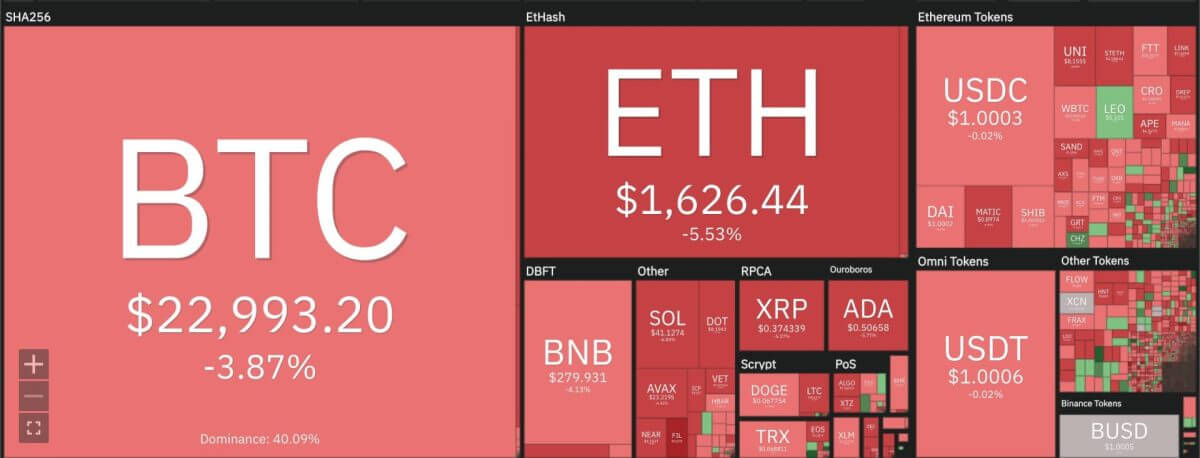 Polkadot price analysis: Cryptocurrency heat map. Source: Coin360
Polkadot price analysis: DOT remains above crucial moving averages on daily chart
On the 24-hour candlestick chart for Polkadot price analysis, price can be seen forming an evening star pattern over the past 24 hours that confirms the bearish shift in trend. Previously, DOT price had extended along a bull run that almost tested the $9 resistance, following a steady spell of sideways movement in early July. DOT slipped down to $8.08 over today’s trade, however price still remains above the 9 and 21-day moving averages, along with the 50-day exponential moving average (EMA) at $7.90. Support level at $8 remains crucial for DOT price and any movement below this mark could trigger a further significant downtrend.
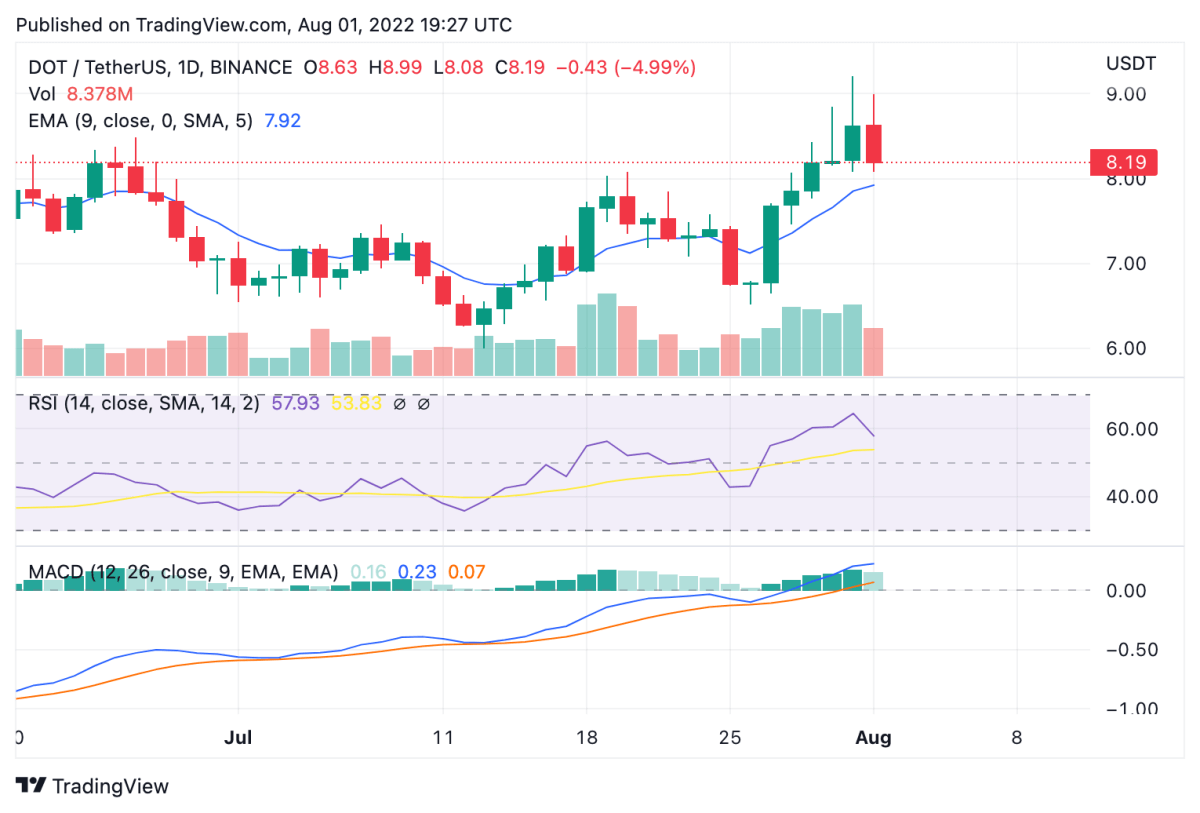 Polkadot price analysis: 24-hour chart. Source: Trading View
The 24-hour relative strength index (RSI) also justifies the downward movement over the past 24 hours with a dip in market valuation at 57.93. Trading volume also dropped 10 percent, suggesting decreasing market movement for DOT. Meanwhile, the moving average convergence divergence (MACD) curve continues above the neutral zone but can be seen forming lower lows over the past 24 hours to also confirm a bearish outlook for Polkadot.
Disclaimer. The information provided is not trading advice. Cryptopolitan.com holds no liability for any investments made based on the information provided on this page. We strongly recommend independent research and/or consultation with a qualified professional before making any investment decisions.