Bitcoin was trading marginally lower to start the week, as prices of the token fell lower for a fourth consecutive session. The world’s largest cryptocurrency has suffered from increased market volatility, following last Saturday’s surge to a six-week high above $24,000. Ethereum was also in the red on Monday.
Bitcoin
Bitcoin (BTC) was trading in the red to start the week, as markets fell for a fourth consecutive session on Monday.
Following last Saturday’s peak of $24,678, which saw BTC/USD hit its highest level since June 13, the token has fallen in back-to-back sessions.
This latest decline saw bitcoin hit a bottom of $22,994.61 earlier in the day, cementing a five-day low in the process.
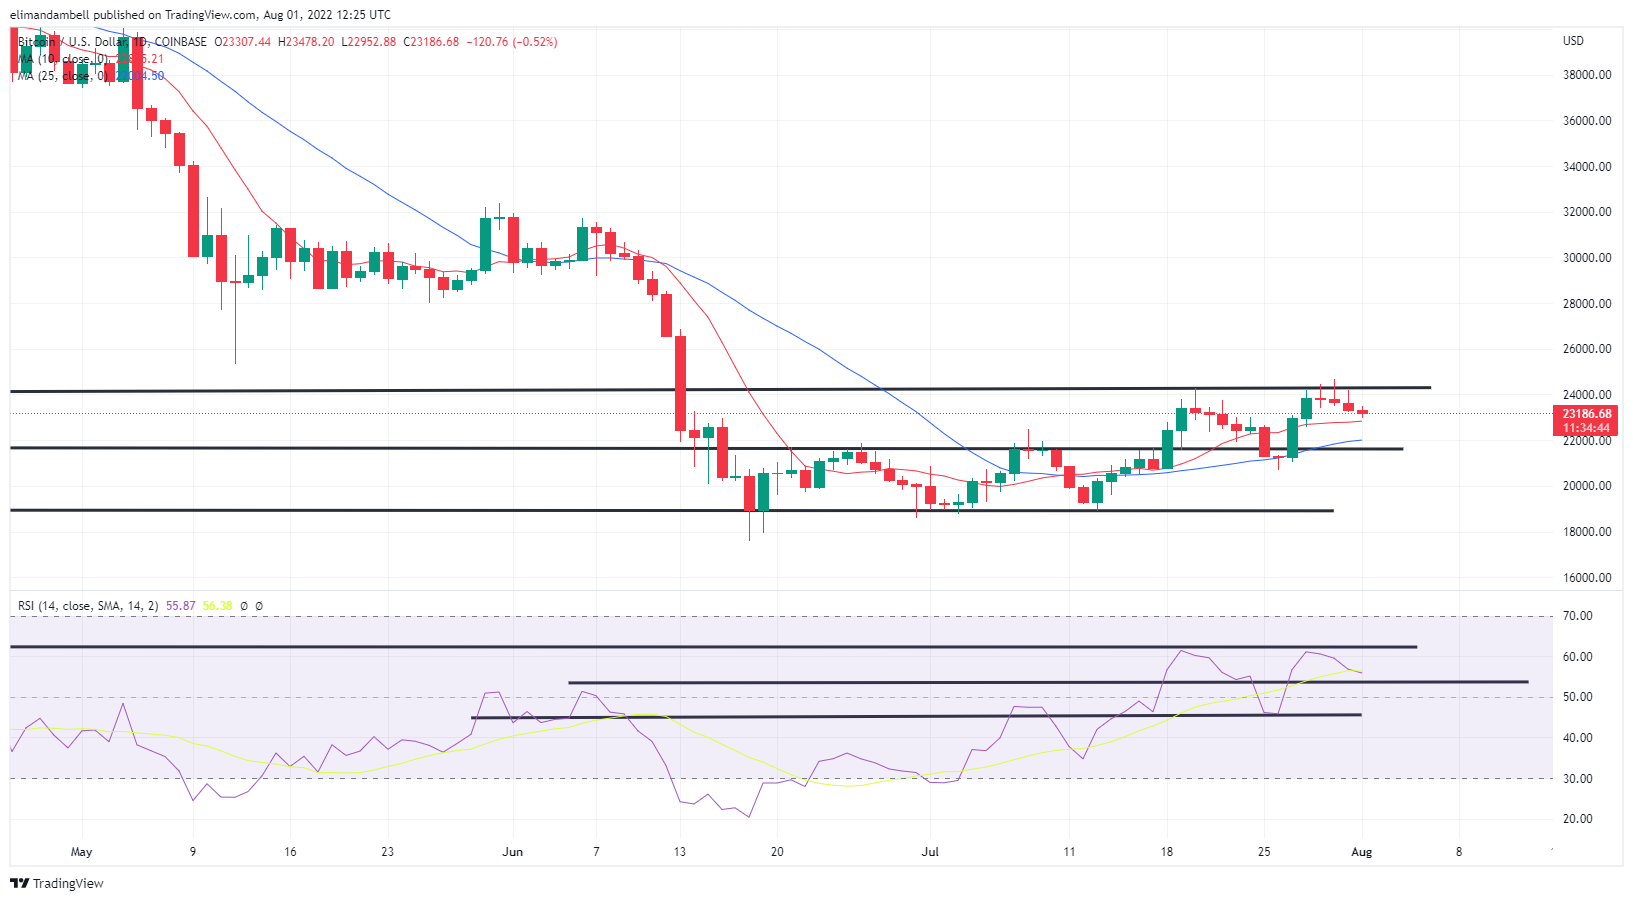
Bearish sentiment appears to have begun following the breakout attempt, where bulls were unsuccessful in keeping prices above $24,400.
This comes as price strength hit a ceiling of its own at 62 via the 14-day relative strength index (RSI), which seems to be the primary reason behind the recent decline.
The RSI is now tracking at 56, but looks to be moving towards a floor of 54, and should this happen, we could see prices fall near $21,000.
Ethereum
In addition to bitcoin, ethereum (ETH) was also lower for a fourth straight day, as bearish sentiment continues to sweep through crypto markets.
After a high of $1,745.88 on Sunday, ETH/USD fell to an intraday low of $1,650.42 earlier in today’s session.
Following almost a week of lower lows, prices now seem to be moving towards a support point of $1,620.
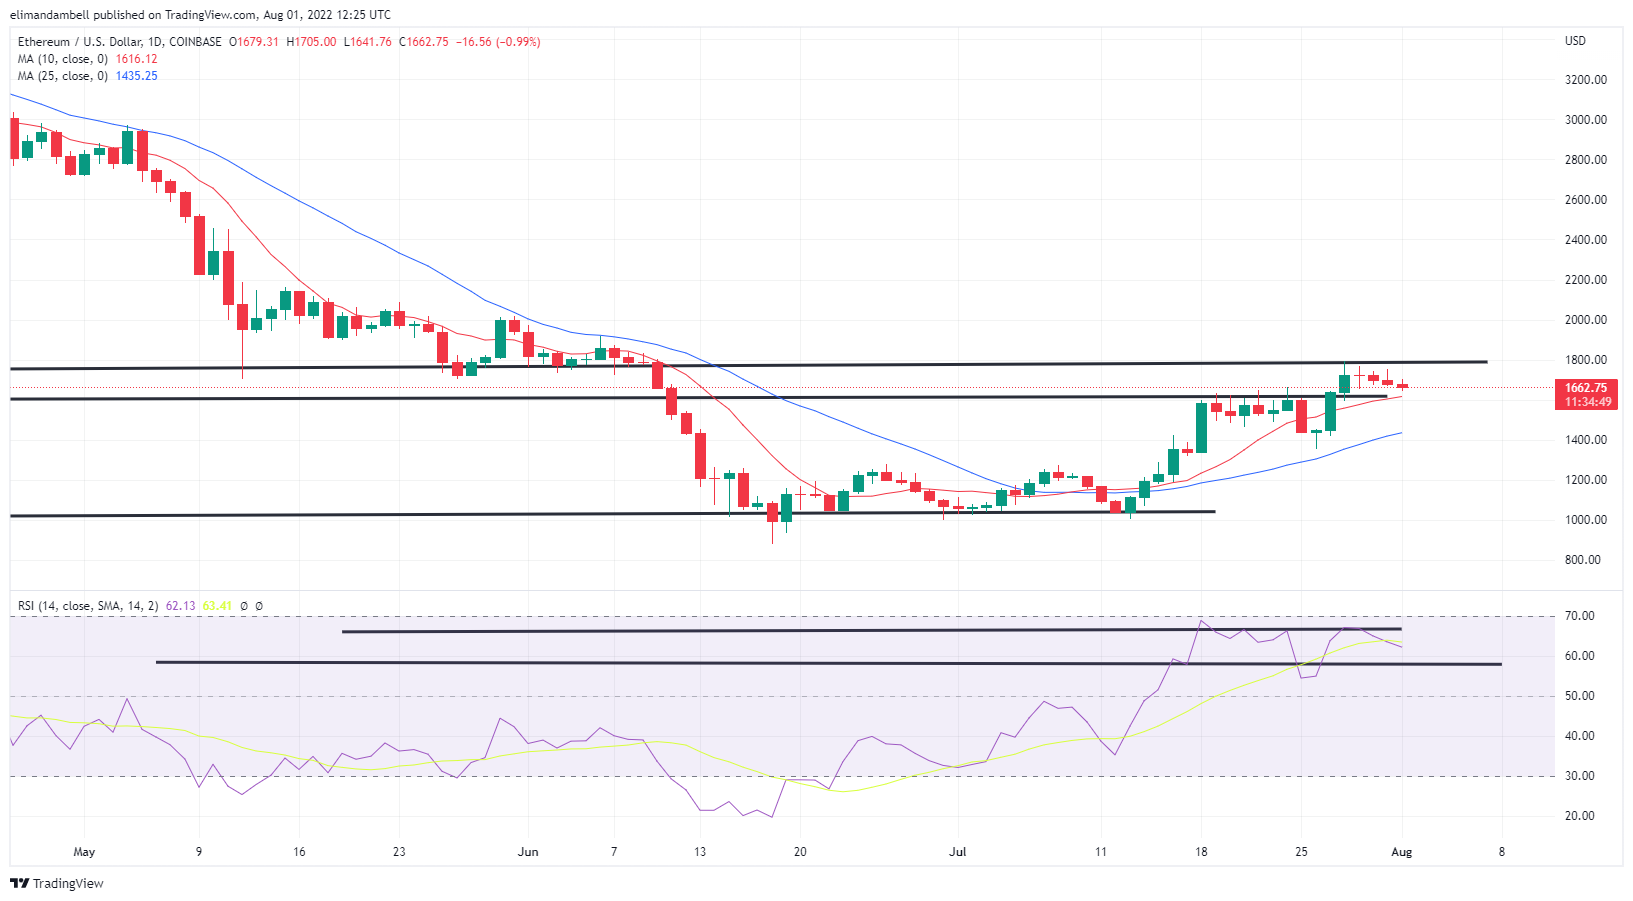
Like bitcoin, the 14-day RSI on the ETH chart was recently held at a resistance point, which then triggered this latest bearish downtrend.
As of writing, the relative strength index is tracking at 62.35, following a recent breakout of a floor of 63.
Should bearish pressure persist, the next floor on the indicator seems to be the 58 level, which may be a point that traders are now targeting.